Báo cáo khoa học: " The impact of dose calculation algorithms on partial and whole breast radiation treatment plans" pot
Bạn đang xem bản rút gọn của tài liệu. Xem và tải ngay bản đầy đủ của tài liệu tại đây (2.06 MB, 9 trang )
RESEARC H Open Access
The impact of dose calculation algorithms on
partial and whole breast radiation treatment
plans
Parminder S Basran
1,2*†
, Sergei Zavgorodni
1,2†
, Tanya Berrang
3,4†
, Ivo A Olivotto
3,4†
, Wayne Beckham
1,2†
Abstract
Background: This paper compares the calculated dose to target and normal tissues when using pencil beam
(PBC), superposition/convolution (AAA) and Monte Carlo (MC) algorithms for whole breast (WBI) and accelerated
partial breast irradiation (APBI) treatment plans.
Methods: Plans for 10 patients who met all dosimetry constraints on a prospective APBI protocol when using PBC
calculations were recomputed with AAA and MC, keeping the monitor units and beam angles fixed. Similar
calculations were performed for WBI plans on the same patients. Doses to target and normal tissue volum es were
tested for significance using the paired Student’s t-test.
Results: For WBI plans the average dose to target volumes when using PBC calculations was not significantly
different than AAA calculations, the average PBC dose to the ipsilateral breast was 10.5% higher than the AAA
calculations and the average MC dose to the ipsilateral breast was 11.8% lower than the PBC calculations. For ABPI
plans there were no differences in dose to the planning target volume, ipsilateral breast, heart, ipsilateral lung, or
contra-lateral lung. Although not significant, the maximum PBC dose to the contra-lateral breast was 1.9% higher
than AAA and the PBC dose to the clinical target volume was 2.1% higher than AAA. When WBI technique is
switched to APBI, there was significant reduction in dose to the ipsilateral breast when using PBC, a significant
reduction in dose to the ipsilateral lung when using AAA, and a significant reduction in dose to the ipsilateral
breast and lung and contra-lateral lung when using MC.
Conclusions: There is very good agreemen t between PBC, AAA and MC for all target and most normal tissues
when treating with APBI and WBI and most of the differences in doses to target and normal tissues are not
clinically significant. However, a commonly used dosimetry constraint, as recommended by the ASTRO consensus
document for APBI, that no point in the contra-lateral breast volume should receive >3% of the prescribed dose
needs to be relaxed to >5%.
Background
For early stage breast cancer, whole breast irradiation
(WBI) is used extensively to minimize the risk of ipsilat-
eral breast cancer recurrence after breast conserving
surgery. Over the last decade, there has been increased
interest in the use of accelerated partial breast irradia-
tion (APBI) as opposed to WBI [1]. The use of APBI
offers fewer fractions and lower dose to uninvolved
regions of the breast. A number of clinical trials com-
paring WBI with various methods of APBI treatments
are ongoing [2], however mature randomized data on
the efficacy and toxicity of APBI compared to standard
WBI will not be available for a number of years.
Publications supporting the dosimetric advantages of
using APBI as an alternative to WBI have m ainly
focused on intra-cavitary brachytherapy, inter stitial bra-
chytherapy or intra-operative radiation therapy [3-6]. A
common method of delivering A PBI in ongoing rando-
mized trials is linac-based, 3-dimensional conformal
external beam radiation therapy (3DCRT) employing the
* Correspondence:
† Contributed equally
1
Department of Medical Physics, BC Cancer Agency–Vancouver Island
Centre, Victoria, British Columbia, Canada
Full list of author information is available at the end of the article
Basran et al. Radiation Oncology 2010, 5:120
/>© 2010 Basran et al; li censee Bio Med Central Ltd. This is an Open Acces s article distributed under the terms of the Creative Commons
Attribution License ( nses/by/2.0 ), which permits unrestricted use, distribution, and reproduction in
any medium, provided the original work is properly cited.
same widely-available technology, staff, and treatment
planning systems as WBI [7].
Given the potential importance of linear accelerator
based delivery of APBI, the influence of dose calcula-
tion algorithms on trial eligibility and interpretation of
risks to normal tissues is relevant. The impact of scat-
ter corrections with WBI techniques comparing pencil
beam convolution (PBC), the analytic anisotropic algo-
rithm (AAA), and Monte Carlo (MC) calculations has
been previously described [8], with several articles dis-
cussing the benefits of using AAA over PBC [9,10].
However, there are no studies that examine the accu-
racy of the dose to target and normal tissues for
3DCRT APBI techniques. The accuracy of the calcu-
lated dose in regions well outside the irradiated
volume is particularly important when trying to ascer-
tain the risk of secondary cancer or normal tissue toxi-
city [11]. Obtaining a better understanding of the
potential increase, or decrease, in dose to target and
normal tissues could facilitate a better understanding
of the risks associated with APBI treatment strategies.
This is a report of the co nsequence s of changing dose
calculation algorithms on doses to target volumes and
important normal tissues during whole breast and par-
tial breast irradiation.
Methods
Treatment planning
We retrospectively examined plans for 10 consecutive
patients enr olled in a prospect ive APBI tri al who met all
the dosimetry constraints of the protocol when using sim-
plified pencil beam calculations [12]. All plans were initi-
ally calc ulated with a pencil beam convoluti on (PBC)
algorithm with Batho inhomogeneity corrections using the
Eclipse Treatment Planning System (Version 8.617, Varian
Medical Systems, Palo Alto, USA) [13]. Plans were then
recomputed (keeping the monitor units, beam weights and
angles fixed) within Eclipse using AAA. All calculations
were performed on 2.5 mm dose grid.
The WBI prescription was 42.5 Gy in 16 fractions,
normalized to a point mid-plane in the breast tissue and
to be delivered through a segmented MLC delivery with
6 MV photon beams.
The partial breast technique employed four non-
coplanar 6 MV beams that avoided direct beams into
the ipsilateral lung [14]. The planning target volume
(PTV) for the APBI plans was the seroma (the primary
surgical site density on a planning CT scan) plus a 1 cm
expansion, excluding chest wall and 0.5 cm from the
skin, to form the clinical target volume (CTV) and a
further 1 cm 3-dimensional expansion to form the PTV.
A dose-evaluation volume (DEV) was defined as the
portion of the PTV that excluded the chest wall and 0.5
cm from the skin [14]. In addition to defining these
target structures, the ipsilateral breast, ipsilateral lung,
heart, contra-lateral lung and contra-lateral breast were
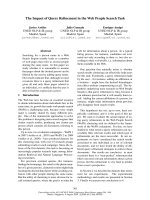
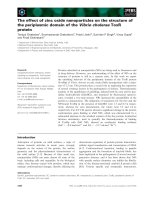
contoured (see Figure 1).
The APBI prescription was 38.5 Gy in 10 fractions
normalized to a point within the target volume. The
planning guidelines for APBI patients follow those
articulated in the American Society of Therapeutic Radi-
ology and Oncology (ASTRO) consensus document [1].
Monte Carlo Verification
WBI and APBI treatment plans were recomputed with
the Vancouver Island Monte Carlo (VIMC) system
[15,16]. The system provides a platform for Monte
Carlo verificatio n of the treatment plans generated by a
TPS and exported in DICOM format.
The main “ calculation engines” within the system are
BEAMnrc for modelling particle fluence and DOS-
XYZnrc for modelling the dose deposition w ithin the
patient [17]. The beam model for Varian 21EX treat-
ment machine was used in this study. The model utilises
a two-stage approach in calculating the dose where in
the “first stage” all non-variable linac components are
modelled and the particle fluence is stored in the phase
space file. Then, in the “second stage” the phase space
file is used in subsequent calculations as a radiation
source for transporting the fluence through the patient
phantom. Standard energy cut-off values were AP =
PCUT = 0.01 MeV and AE = ECUT = 0.700 MeV,
where AP and AE are the low energy thres hold s for the
production of secondary bremsstrahlung photons and
knock-on electrons and PCUT and ECUT are the global
cut-off energies for photon and electron transport used
during electron and photon transport. In addition, “azi-
muthal particle redistribution” has been used to sub-
stantially reduce phase space latent variance [18,19].
The model has been tuned and verified (except the
build-up and penumbra regions) demonstrating dose
agreement with the measured open field dose profiles
within 1% for the field sizes within the range of 4 × 4 to
40 × 40 cm
2
[11]. This excluded build-up and penumbra
regions where t he dose differences were higher, as
expected, but still agreed to within 2% or within a 2
mm distance. Modelli ng of IMRT and RapidArc, as well
as fixed-aperture fields’ delivery has been performed
with the dynamic multi-leaf collimators (dMLC) model
by Siebers et al. and verified in our previous publications
[11,20,21].
As most of the treatment fields used in the current
study utilise the Varian implementation of collimator-
controlled wedging, or enhanced dynamic wedges
(EDWs), it is important that the dose from such fields is
calculated correctly. Radiation transport through the
movingjawofEDWsismodelledinVIMCsystem
using the method developed by Verhaegen and Liu [22].
Basran et al. Radiation Oncology 2010, 5:120
/>Page 2 of 9
Each particle is transported through the dynamic jaw
with its position sampled from a probability density
function that describes jaw motion. Then, the particle is
transported through the physical jaw in its sampled
position. This method naturally models the radiation
transmitted through the dynamic jaw towards the
patient as well as radiation backscattered from t he jaw
into the linac monitor chamber. The latter is essential
for correct absolute dose calculation implemented in the
VIMC linac model [23]. Verhaegen and Liu demon-
strated excellent agreement of this EDW model with
measured data. Our implementation of this model has
been verified against the EDW commissioning measure-
ments collected in our department. The measurements
were done using Scanditronix Wellhofer CA24 ioniza-
tion chamber array with IC-10 ionization chambers that
have effective volume of 0.13 cm
3
. Examples of this veri-
fication for Monte Carlo as well as PBC and AAA calcu-
lations that include 10 × 10 and 20 × 20 cm
2
fields with
60° wedge are shown in the Results section.
MC simulations of the treatment plans presented in
this study were performed on 2.5 mm dose grid with
less than 1% statistical uncertainty at the DEV.
Statistical Analysis
Volumetric and dosimetric statistics as defined in
Table 1 were recorded from each of the patient’ s6
plans (WBI-PBC, WBI-AAA, WBI-MC, APBI-PBC,
APBI-AAA, and APBI-MC). To determine whether
there is a difference to these volumes, the mean per-
centage differences in doses or volumes receiving a
specific dose were tested using the paired Student’st-
test computed in Microsoft Excel (Microsoft, Redmond
WA). For a significance level of p = 0.05, the adjusted
significance level with Bonferroni corrections for the
8 different tissues analyzed in this study is p = 0.006
[24].
Results
Verification of MC, AAA and PBC dose calculations for
EDW fields
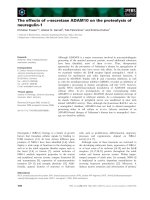
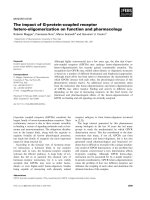
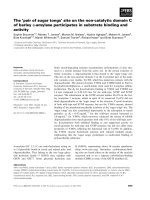
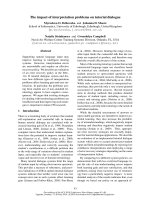
Figures 2 and 3 demonstrate agreement of the three cal-
culation algorithms with the dose measurement in water
for10×10and20×20cm
2
EDW fields at 10 cm
depth. All algorithms show good overall agreement with
the measurement data, however MC agrees with the
measurement slightly better, especially in the out-of-
Figure 1 Transaxial (upper left), coronal (lower left), sagittal (lower right), and three dimensional rendering of a partial breast plan
computed with the pencil beam algorithm. The dose escalation volume (DEV), shown in purple, is a 5 millimeter expansion of the clinical
target volume, shown in pink, but excludes the chest wall.
Basran et al. Radiation Oncology 2010, 5:120
/>Page 3 of 9
field regions. Of all algorithms considered, MC has the
best agreement with the 10 × 10 cm
2
measured data,
and the agreement with 2 0 × 20 cm
2
field is excellent:
the measurement points essentially overlap with MC
data. Error bars on MC points demonstrate their calcu-
lated standard deviation of 1%, and most measurements
fall within this range.
Dose Calculation Algorithm Effects on Whole Breast
Irradiation
Table 2 summarizes the mean, standard deviations and
ranges of the target and normal tissue statisti cs recorded
from the three WBI pl ans. The volumes of the DEV and
PTV receiving 95% of the prescription dose using PBC cal-
culations were not significantly d ifferent than AAA
Table 1 Target and normal tissue dosimetric definitions and the average volumes for 10 patients in this study
Target & Normal Tissue Average Volume [cm
3
] Statistic Recorded
Planning Target Volume (PTV) 215.0 Relative volume covered by 95% of the prescription dose
Dose Evaluation Volume (DEV) 149.3 Relative volume covered by 95% of the prescription dose
Ipsilateral Breast (IPS-BR) 1094.5 Relative volume covered by 95% of the prescription dose
Ipsilateral Lung (IPS-LUNG) 1368.1 Relative volume receiving 10% of the prescription dose
Heart 537.4 Percent of prescription dose delivered to 10% of the volume
Contra-lateral lung (CON-LUNG) 1182.0 Percent of prescription dose delivered to 5% of the volume
Contra-lateral breast (CON-BR) 525.2 Maximum point dose as a percent of the prescription dose
Figure 2 Dose profile of a 10 × 10 cm
2
field at a depth of 10 cm in water for a 60° enhanced dynamic wedge measured with
ionisation chamber array (Measured), calculated by Monte Carlo method (MC), as well as AAA and PBC algorithms implemented in
Eclipse™ TPS.
Basran et al. Radiation Oncology 2010, 5:120
/>Page 4 of 9
calculations (all p > 0.127). The ipsilateral whole breast
volume receiving 10% of the prescription dose in the PBC
plan was 10.5% higher tha n the AAA dose (p = 0.004).
There were no statistically significant differences between
PBC and AAA, or AAA and MC calculations for target or
normal tissue structures. This was also true when PBC
and MC calculations were c ompared, with the exception
that the ipsilateral breast dose was 11.8% lower than the
PBC calculations with MC calculations (p = 0.004).
Dose Calculation Algorithm Effects on Accelerated Partial
Breast Irradiation
Table 3 summarizes the mean, standard deviations and
ranges of the target and normal tissue statistics recorded
from the three APBI plans. The dosimetric statistics
from PBC and AAA plans were not significantly
different for the PTV, ipsilater al breast, heart, ipsilateral
lung, and contra-lateral lung. Although not significant,
the maximum dose to the contra-lateral breast was 1.9%
higher for AAA compared to PBC (p = 0.030) and the
average volume to the DEV receiving 95% of the pre-
scription dose was 2.1% higher with PBC calculations
compared to AAA (p = 0.012). There were no statisti-
cally significant differences between PBC and MC (p >
0.019), or AAA and MC (p = 0.100) calculations for tar-
get or normal tissue structures.
Accelerated Partial Breast versus Whole Breast Irradiation
Table 4 summarizes the differences in volumes and
doses to the target and normal tissues when comparing
WBI with APBI plans for the three different algorithms.
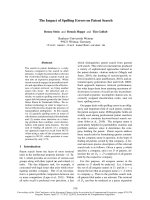
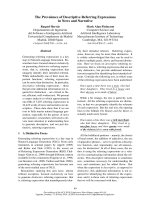
Figure4illustratesthedifferenceindosetotargetand
Figure 3 Dose profile of a 20 × 20 cm
2
field at a depth of 10 cm in water for a 60° enhanced dynamic wedge measured with
ionisation chamber array (Measured), calculated by Monte Carlo method (MC), as well as AAA and PBC algorithms implemented in
Eclipse™ TPS.
Basran et al. Radiation Oncology 2010, 5:120
/>Page 5 of 9
normal tissues when comp aring WBI with APBI for t he
three different algorithms. When switching from WBI to
APBI with PBC, there was significant reduction in dose
to the ipsilateral breast (p = 0.002). When switching
from WBI to APBI with AAA, there was significant
reductionindosetotheipsilateral lung (p = 0.001).
When switching from WBI to APBI with MC, there was
significant reduction in dose to the ipsilateral breast and
lung and contra-lateral lung (p = 0.003, p < 0.001, p =
0.001 respectively). The magnitude of the difference in
dose to these structures depends on the dose calculation
algorithm used.
Discussion
This study demonstrates very good agreement between
the AAA and PBC algorithms when planning either
WBI or ABPI. This suggests that there are no major
concerns associated with target and normal tissue cover-
age if switching from PBC to AAA for WBI or ABPI.
Given that AAA provides a significant improvement
over the PBC plus Batho-heterogeneity corrections in
lung tissue, our cl inical practice has migrated from PBC
to AAA along with dose calculations for the APBI clini-
cal trial.
For APBI plans, the dose t o target and normal tissue
volumes varied with the dose calculation algorithm. This
result is in agreement with work that explored the
impact of PBC, AAA, and MC algorithms in non-clinical
scenarios [11]. The volumes of the DEV and PTV
receiving 95% of the prescription dose from PBC plans
were higher or equal to the plans recomputed with
AAA and MC. This is predictable because the lung-tis-
sue interface is poorly calculated with PBC. If APBI
plans are switched from PBC to AAA calculations, the
dose to the PTV and DEV requires re-evaluation. Based
on our results, a plan generated using AAA compared
to PBC calculations would deliver approximately 2%
more dose within the DEV. This may not have any mea-
surable effect on tumour control but could influence the
risk of late breast fibrosis because during APBI the dose
per fraction is already high. This may be a particular
risk if the DEV or PTV is large. The doses (and volumes
receiving a specific dose) to normal structures will also
correspondingly increase. Apart from the contra-lateral
breast, the treatment plan can be re-configured to
ensure that normal tissue constraints are maintained.
This is not difficult to achieve since the doses to normal
tissues are relatively independent of the calculation algo-
rithm, with the important exception of the contra-lateral
breast.
There may be a small but important difference in the
contra-lateral breast dose when comparing APBI plans
computed with PBC, AAA and MC algorithms. The
dose to the contra-lateral breast was 2-3% higher with
AAA as compared to MC. Despite the fact that dose
calculation algorithms are not generally validated for
dose points far away from the treatment volume and
that this metric is sensitive and unstable, existing accel-
erated partial breast clinical trials use a maximum point
dose as a constraint to the contra-lateral breast. The
Table 2 Mean, standard deviation and ranges of volumetric coverage and percent dose delivered to selected target
and normal tissues as defined in Table 1 for three dose calculation algorithms during whole breast tangent radiation
therapy
DEV
[%]
PTV
[%]
IPS-BR
[%]
IPS-LUNG
[%]
HEART
[%]
CON-LUNG
[%]
CON-BR
[%]
PBC 97.4 (4.3) 80.3 (8.7) 67.1 (5.9) 15.1 (6.3) 12.8 (15.9) 1.1 (0.9) 18.6 (29.7)
87.4-100.0 60.7-93.7 60.8-76.6 7.1-26.1 1.6-47.0 0.0-2.6 1.4-91.6
AAA 92.5 (8.5) 73.4 (9.3) 56.6 (7.9) 21.2 (7.6) 12.6 (16.0) 1.0 (0.6) 23.7 (25.0)
72.0-100.0 60.6-91.3 41.0-69.1 10.9-33.6 1.3-47.0 0.8-2.2 3.0-101.1
MC 94.4 (5.5) 75.9 (13.7) 55.3 (9.4) 19.9 (6.2) 12.4 (15.6) 1.1 (0.5) 19.3 (26.8)
83.9-100.0 60.5-98.4 42.6-69.3 10.6-31.1 1.3-44.3 0.5-2.0 5.6-94.1
Table 3 Mean, standard deviation and ranges of volumetric coverage and percent dose delivered to selected target
and normal tissues as defined in Table 1 for three dose calculation algorithms during partial breast radiation therapy
DEV
[%]
PTV
[%]
IPS-BR
[%]
IPS-LUNG
[%]
HEART
[%]
CON-LUNG
[%]
CON-BR
[%]
PBC 99.9 (0.2) 86.1 (9.1) 32.2 (24.9) 7.5 (4.8) 3.1 (3.0) 0.3 (0.3) 2.0 (1.3)
99.4-100.0 61.8-94.2 18.0-101.7 2.3-16.9 0.9-9.1 0.1-0.8 0.3-3.8
AAA 97.8 (2.1) 78.5 (12.2) 31.4 (21.4) 9.5 (6.1) 3.1 (2.9) 0.4 (0.3) 3.9 (2.3)
92.5-100.0 61.5-96.1 18.0-99.6 2.3-21.4 0.8-9.1 0.0-1.0 0.3-7.4
MC 97.3 (2.9) 79.6 (12.1) 22.9 (4.5) 10.8 (5.6) 3.6 (4.4) 0.4 (0.2) 2.6 (1.3)
91.5-100.0 61.8-96.1 14.9-28.4 2.8-20.9 0.8-12.3 0.2-0.7 0.8-4.6
Basran et al. Radiation Oncology 2010, 5:120
/>Page 6 of 9
selection of this constraint stems from a desire to hav e
simple planning objectives and constraints for dosime-
trists. The ASTRO consensus document states that no
point i n the contra-lateral breast volume should receive
> 3% of the prescribed dose. This work suggests that
switching from the PBC to the AAA treatment planning
algorithm could affect the apparent eligibility of patients
for accelerated partial breast treatment. Out of ten
patients in the current study, two would have failed the
ASTRO contralateral breast dosimetry guideline when
calculated using the PBC or MC algorithm. However,
delivering an identical amount of MUs and using the
Table 4 Differences in percentage of volumetric coverage and percent dose delivered to selected target and normal
tissues as defined in Table 1 when WBI plans are replanned with ABPI
DEV PTV IPS-BR IPS-LUNG HEART CON-LUNG CON-BR
Dose PBC [%] -2.5 -5.8 35.0 7.6 9.6 0.7 0.7
Dose AAA [%] -5.4 -5.1 25.2 11.7 9.6 0.8 0.6
Dose MC [%] -2.9 -4.2 32.5 9.0 8.8 0.8 0.7
A negative value indicates that the partial breast plan result is lower than the whole breast result. Values in italics denote significant differences between WBI
and APBI doses (p < 0.006)
Figure 4 Re ductions in dose to target and normal tissue when the WBI technique is converted to ABPI. As expected, the APBI reduces
the dose to important tissues such as the ipsilateral breast, contralateral breast, heart. Note however, that the magnitude of dose reductions
depends the type of dose calculation algorithm.
Basran et al. Radiation Oncology 2010, 5:120
/>Page 7 of 9
same beam angles and weightings but calculated with
AAA, seven patients would have not met the contra-lat-
eral breast constraint. If reproduced across the popula-
tion of patients considered for APBI, this could
represent a significant reduction in eligibility. An exami-
nation of the DVH data for APBI plans suggests that
relaxing the contra-lateral breast maximum dose con-
straint from 3% to 5% would retain eligib ility for APBI
without any real increase in the risk of radiation expo-
sure or second breast cancer that is considered accepta-
ble using existing PBC planning algorithms.
A more detailed investigation on these differences was
conducted to understand where these differen ces stem
from.Figure5displaysthreedosedistributionshigh-
lighting the differences between the algorithms for tis-
sues far from the treated volume. For PBC, the isodoses
are fairly parallel to the field borders, suggesting that
the in-patient scatter contributes most to the peripheral
dose. For AAA, this is partially true with the exception
of the dose in lung tissue and the surface of the patient,
far from the field borders. This suggests that the head-
scatter modelling contributes the most for tissues on the
surface such as the contra-lateral breast, and in-phan-
tom scatter contributes the most for deeper tissues.
With the exception of the dose in lung, the Monte
Carlo isodoses agree well with PBC for isodoses higher
than 5%, and with AAA for isodoses lower than 3%.
The APBI technique often employs wedges to achieve
tumor coverage, hence the accuracy of the dose calcula-
tion to the contra-lateral breast can be largely affected
by the algorithm’ s ability to correctly calculate the in-
field and penumbra dose for the EDW fields. The AAA
algorithm uses a semi-analytic model to account for
leakage radiation, jaw and multi-leaf transmission for
open and wedged fields and can over-estimate the dose
in penumbra by 1-2% when compared with MC [10]. In
our centre, in-field open and wedged field agreement
between measurement and calculations was better than
2% for AAA, and better than 1.5% for MC. This leads
us to hypothesise that the dose differenc es in the con-
tra-lateral breast are mostly due to head scatter and
leakage modelling within AAA [ 25]. These contributions
are modelled as extra-focal and electron contamination
parameters within the treatment planning system, which
are optimized in the beam fitting procedure. In the fit-
ting procedure, these extra-focal parameters cannot be
distinguished from other parameters in the beam tuning,
leading to excellent agreement in the open field and
penumbra, but not necessarily far from the open beam.
Conclusions
There is very good agreement between PBC, AAA and
MC for most tissues when treating with APBI. However,
if calculation algorithms are switched from a simple
pencil beam to a scatter-correction convolution/super-
position algorithm, careful consideration should be
given to tissues peripheral to th e treated volume. In this
study, it was found that a commonly used dosimetry
constraint, as recommended by the ASTRO consensus
document, that no point in the contra-lateral breast
volume should receive >3% of the prescribed dose needs
to be relaxed to >5%.
Acknowledgements
The authors would like to thank Michael Crane for his assistance with some
of the planning of the patients in this study. The authors also greatly
appreciate VIC Monte Carlo group and particularly Karl Bush for technical
support of VIMC system used in this study.
Author details
1
Department of Medical Physics, BC Cancer Agency–Vancouver Island
Centre, Victoria, British Columbia, Canada.
2
Department of Physics and
Astronomy, University of Victoria, Victoria, British Columbia, Canada.
3
Department of Radiation Oncology, BC Cancer Agency,Vancou ver Island
Figure 5 Isodose displays of the pencil beam convolution (left), analytic anisotropy algorithm (middle) and Monte Carlo (right) for an
external beam partial breast irradiation treatment. The field border is shown in green on each of the slices. Differences in the distributions
present predominantly at the lower doses. In-patient scattering modelled by the analytic anisotropic algorithm agrees well with the Monte Carlo
calculations, but over predicts at the patient surface, increasing the dose to the contra-lateral breast shown in blue.
Basran et al. Radiation Oncology 2010, 5:120
/>Page 8 of 9
Centre, Victoria, British Columbia, Canada.
4
Department of Surgery, University
of British Columbia, Vancouver, British Columbia, Canada.
Authors’ contributions
PSB calculated patient plans within the treatment planning system,
performed the statistical analysis, provided the initial draft and coordinated
subsequent drafts of the manuscript. SZ performed the Monte Carlo
calculations and helped draft the manuscript. TB assisted in the design of
the study and helped draft the manuscript. IO assisted in the design of the
study and helped draft the manuscript. WB assisted in the design of the
study and helped draft the manuscript. All authors read and approved the
final manuscript.
Competing interests
The authors declare that they have no competing interests.
Received: 27 August 2010 Accepted: 16 December 2010
Published: 16 December 2010
References
1. Smith BD, Arthur DW, Buchholz TA, Haffty BG, Hahn CA, Hardenbergh PH,
Julian TB, Marks LB, Todor DA, Vicini FA, Whelan TJ, White J, Wo JY,
Harris JR: Accelerated partial breast irradiation consensus statement from
the American Society for Radiation Oncology (ASTRO). Int J Radiat Oncol
Biol Phys 2009, 74:987-1001.
2. RAPID: Randomized Trial of Accelerated Partial Breast Irradiation. [http://
clinicaltrials.gov/ct2/show/NCT00282035].
3. Kuerer HM, Julian TB, Strom EA, Lyerly HK, Giuliano AE, Mamounas EP,
Vicini FA: Accelerated partial breast irradiation after conservative surgery
for breast cancer. Ann Surg 2004, 239:338-351.
4. Scanderbeg D, Yashar C, White G, Rice R, Pawlicki T: Evaluation of three
APBI techniques under NSABP B-39 guidelines. J Appl Clin Med Phys 2010,
11:274-280.
5. Stewart AJ, O’Farrell DA, Cormack RA, Hansen JL, Khan AJ, Mutyala S,
Devlin PM: Dose volume histogram analysis of normal structures
associated with accelerated partial breast irradiation delivered by high
dose rate brachytherapy and comparison with whole breast external
beam radiotherapy fields. Radiat Oncol 2008, 3:39.
6. Bush DA, Slater JD, Garberoglio C, Yuh G, Hocko JM, Slater JM: A technique
of partial breast irradiation utilizing proton beam radiotherapy:
comparison with conformal x-ray therapy. Cancer J 2007, 13:114-118.
7. Lomax AJ, Cella L, Weber D, Kurtz JM, Miralbell R: Potential role of
intensity-modulated photons and protons in the treatment of the breast
and regional nodes. Int J Radiat Oncol Biol Phys 2003, 55:785-792.
8. Baglan KL, Sharpe MB, Jaffray D, Frazier RC, Fayad J, Kestin LL,
Remouchamps V, Martinez AA, Wong J, Vicini FA: Accelerated partial
breast irradiation using 3 D conformal radiation therapy (3D-CRT). Int J
Radiat Oncol Biol Phys 2003, 55:302-311.
9. Panettieri V, Barsoum P, Westermark M, Brualla L, Lax I: AAA and PBC
calculation accuracy in the surface build-up region in tangential beam
treatments. Phantom and breast case study with the Monte Carlo code
PENELOPE. Radiother Oncol 2009, 93:94-101.
10. Breitman K, Rathee S, Newcomb C, Murray B, Robinson D, Field C,
Warkentin H, Connors S, Mackenzie M, Dunscombe P, Fallone G:
Experimental validation of the Eclipse AAA algorithm. J Appl Clin Med
Phys 2007, 8:76-92.
11. Gagné IM, Zavgorodni S: Evaluation of the analytical anisotropic
algorithm in an extreme water-lung interface phantom using Monte
Carlo dose calculations. J Appl Clin Med Phys 2007, 8:33-46.
12. Stathakis S, Li J, Ma CCM: Monte Carlo determination of radiation-induced
cancer risks for prostate patients undergoing intensity-modulated
radiation therapy. J Appl Clin Med Phys 2007, 8:2685.
13. Storchi PR, van Battum LJ, Woudstra E: Calculation of a pencil beam
kernel from measured photon beam data. Phys Med Biol 1994,
44:2917-2928.
14. Mitchell T, Truong PT, Salter L, Graham C, Gaffney H, Beckham W,
Olivotto IA:
A low-dose ipsilateral lung restriction improves 3-D
conformal planning for partial breast radiation therapy. Med Dosim .
15. Zavgorodni S, Bush K, Locke C, Beckham W: Vancouver Island Monte Carlo
(VIMC) system for radiotherapy treatment planning dosimetry and
research. Radiother Oncol 2007, 84(Supplement 1):S49.
16. Bush K, Townson R, Zavgorodni S: Monte Carlo simulation of RapidArc
radiotherapy delivery. Phys Med Biol 2008, N359-7.
17. Walters BRB, Kawrakow I, Rogers DWO: History by history statistical
estimators in the BEAM code system. Med Phys 2002, 29:2745-2752.
18. Bush K, Zavgorodni SF, Beckham WA: Azimuthal particle redistribution for
the reduction of latent phase-space variance in Monte Carlo simulations.
Phys Med Biol 2007, 52:4345-4360.
19. Sempau J, Sánchez-Reyes A, Salvat F, ben Tahar HO, Jiang SB, Fernández-
Varea JM: Monte Carlo simulation of electron beams from an accelerator
head using PENELOPE. Phys Med Biol 2001, 46:1163-1186.
20. Siebers JV, Keall PJ, Kim JO, Mohan R: A method for photon beam Monte
Carlo multileaf collimator particle transport. Phys Med Biol 2002,
47:3225-3249.
21. Stapleton S, Zavgorodni S, Popescu IA, Beckham WA: Implementation of
random set-up errors in Monte Carlo calculated dynamic IMRT
treatment plans. Phys Med Biol 2005, 50:429-439.
22. Verhaegen F, Liu HH: Incorporating dynamic collimator motion in Monte
Carlo simulations: an application in modelling a dynamic wedge. Phys
Med Biol 2001, 46:287-296.
23. Popescu IA, Shaw CP, Zavgorodni SF, Beckham WA: Absolute dose
calculations for Monte Carlo simulations of radiotherapy beams. Phys
Med Biol 2005, 50:3375-3392.
24. Wackerly Dennis, Mendenhall William, Scheaffer LRichard: Mathematical
Statistics With Applications. 6 edition. Duxbury Press Toronto; 2008.
25. Tillikainen L, Siljamäki S, Helminen H, Alakuijala J, Pyyry J: Determination of
parameters for a multiple-source model of megavoltage photon beams
using optimization methods. Phys Med Biol 2007, 52:1441-1467.
doi:10.1186/1748-717X-5-120
Cite this article as: Basran et al.: The impact of dose calculation
algorithms on partial and whole breast radiation treatment plans.
Radiation Oncology 2010 5:120.
Submit your next manuscript to BioMed Central
and take full advantage of:
• Convenient online submission
• Thorough peer review
• No space constraints or color figure charges
• Immediate publication on acceptance
• Inclusion in PubMed, CAS, Scopus and Google Scholar
• Research which is freely available for redistribution
Submit your manuscript at
www.biomedcentral.com/submit
Basran et al. Radiation Oncology 2010, 5:120
/>Page 9 of 9