Báo cáo khoa học: "Quantitative assessment of inter-observer variability in target volume delineation on stereotactic radiotherapy treatment for pituitary adenoma and meningioma near optic tract" pot
Bạn đang xem bản rút gọn của tài liệu. Xem và tải ngay bản đầy đủ của tài liệu tại đây (713.53 KB, 6 trang )
RESEARCH Open Access
Quantitative assessment of inter-observer
variability in target volume delineation on
stereotactic radiotherapy treatment for pituitary
adenoma and meningioma near optic tract
Hideya Yamazaki
1,2*
, Hiroya Shiomi
2,8
, Takuji Tsubokura
1,2
, Naohiro Kodani
1,2
, Takuya Nishimura
1,2
, Norihiro Aibe
1,2
,
Hiroki Udono
3
, Manabu Nishikata
4
, Yoshimi Baba
5
, Mikio Ogita
6
, Koichi Yamashita
7
, Tadayuki Kotsuma
8
Abstract
Background: To assess inter-observer variability in delineating target volume and organs at risk in benign tumor
adjacent to optic tract as a quality assurance exercise.
Methods: We quantitatively analyzed 21 plans made by 11 clinicians in seven CyberKnife centers. The clinicians
were provided with a raw data set (pituitary adenoma and meningioma) including clinical information, and were
asked to delineate the lesions and create a treatment plan. Their contouring and plans (10 adenoma and
11 meningioma plans), were then compared. In addition, we estimated the influence of differences in contouring
by superimposing the respective contours onto a default plan.
Results: The median planning target volume (PTV) and the ratio of the largest to the smallest contoured volume
were 9.22 cm
3
(range, 7.17 - 14.3 cm
3
) and 1.99 for pituitary adenoma, and 6.86 cm
3
(range 6.05 - 14.6 cm
3
) and
2.41 for meningioma. PTV volume was 10.1 ± 1.74 cm
3
for group 1 with a margin of 1 -2 mm around the CTV (n =
3) and 9.28 ± 1.8 cm
3
(p = 0.51) for group 2 with no margin (n = 7) in pituitary adenoma. In meningioma, group
1 showed larger PTV volume (10.1 ± 3.26 cm
3
) than group 2 (6.91 ± 0.7 cm
3
, p = 0.03). All submitted plan keep
the irradiated dose to optic tract within the range of 50 Gy (equivalent total doses in 2 Gy fractionation). However,
contours superimposed onto the dose distribution of the default plan indicated that an excess ive dose 23.64 Gy
(up to 268% of the default plan) in pituitary adenoma and 24.84 Gy (131% of the default plan) in meningioma to
the optic nerve in the contours from different contouring.
Conclusion: Quality assurance revealed inter-observer variability in contour delineation and their influences on
planning for pituitary adenoma and meningioma near optic tract.
Background
Target delineation is an important issue in radiation
oncology, especially for image-guided, high-precision
radiotherapy [1]. With increasing conformity of dose
delivery, inter-observer variability in tumor identification
and delineation plays an ever more critical role, even for
uncomplicated lesions [2-6]. Although inter-observer
variability in contouring is a well-known fact, we could
not find any data on variability in the contouring of
benign tumors near the optic tract.
Pituitary adenoma and meningioma are regarded as
benign tumors and are rarely treated by radiotherapy if
surgery can be performed. However, in cases that are
ineligible for surgery due to a risk of excessiv e surgical
complications, radiotherapy can play an important role
in treatment for these benign tumors. Radiotherapy was
initially performed using conventional technologies
(Co-60 or Linac-based units) [7,8]. Stereotactic, single-
fraction radiosurgery (SRS) using the Gamma knife was
then begun, followed shortly thereafter by stereotactic
* Correspondence:
1
Department of Radiology, Graduate School of Medical Science, Kyoto
Prefectural University of Medicine, 465 Kajiicho Kawaramachi Hirokoji,
Kamigyo-ku, Kyoto 602 - 8566 Japan
Full list of author information is available at the end of the article
Yamazaki et al. Radiation Oncology 2011, 6:10
/>© 2011 Yamazaki et al; licensee BioMed Cen tral Ltd. This is an Open Access articl e distributed under the terms of the Creative
Commons Attribution License (http://creativeco mmons.org/licenses/by/2.0), which permits unrestricted use, dist ribution, and
reproduction in any medium, pro vided the original work is properly cite d.
radiotherapy (SRT) at a number of institutes [9]. The
SRT experience for such tumors has been in sufficient to
develop a consensus on optimal treatment parameters,
including prescribed dose and fractionation, especially
for hypofractionated SRT. This lack of consensus applies
as well to contouring of the planning target volume
(PTV).
Therefore, we conducted a multi-institutional study in
which participating radiation oncologists delineated
tumors and organs at risk (OARs) and created treatment
plans using inverse planning software for the CyberKnife
System (Accuray, Sunnyvale CA, USA). Participants cre-
ated treatment plans for two patients, one with pituitary
adenoma and second with meningioma. Variability in
contouring, planning target volumes, prescribed doses,
and doses to OARs was assessed. In addit ion, we exam-
ined the influence of different contouring especially
optic tract by superimposing each contour onto the
default plan, and we visualized dose distribution using
prescribed dose 3-D rendering.
Methods
Enhanced CT images for Case 1 (pituit ary adenoma) and
CT and MRI images for Case 2 (meningioma) were
obtained at Soseikai General Hospital and sent via inter-
net to seven CyberKnife institutes. For Case 1, CT images
were acquired with a SOMATOM Volume Access scan-
ner (Siemens AG, Munchen, Germany) at a 2-mm slice
thickness. For Case 2, Contrast enhanced CT images
were obtained with a Brilliance CT 64 scanner (Royal
Philips Electronics, Euronext: PHIA, Eindhoven, Holland)
at a 1.25-mm slice thickness (Default; CT level 35, win-
dow 75). MRI images were obtained by an Achieve
1.5 scanner (Royal Philips Electronics, Euronext: PHIA,
Eindhoven, Holland) usin g a 4-mm slice gapless scan (TE
10 ms, TR 450 ms, FA 70°, SPIR). At each CyberKnife
institute, the images were transferred to a treatment
planning system (TPS; MultiPlan or OnTarget, Accuray)
to create a radiotherapy plan for CyberKnife stereotactic
radiotherapy (SRT). Participating physicians were
required to submit both the printed materials used in
their routine clinical work and raw data.
From seven CyberKnife centers, 11 radiation oncolo-
gists submitted plans and raw data for the meningioma
and 10 for the pituitary adenoma. The collected data
contained target volume contours, organs at risk
(OARs), and minimum and maximum irradiated dose
for those structures. Maximum and minim um doses for
the PTV and the maximum dose for O ARs were ana-
lyzed. Uniformity of dose distribution was assessed in
terms of the minimum and maximum prescribed dose
for the PTV.
The raw treatment plan data in TPS format were also
submitted and analyzed using ShioRIS and ShioRIS-
2(softwaredevelopedin-housebyauthorH.S.).We
superimposed those contours on our default plan (cre-
ated by author T. T. in Soseikai General H ospital and
confirmed by other two physicians), and examined dif-
ferences in the dose-volume histogram (DVH) for each
contour to estimate a prescribed dose for each con-
toured PTV and organs at risk. The equation; equivalent
total doses, EQD2 = n × d × (a/b +d)/(a/b + 2); the
dose that would be equivalent to a 2 Gy fractionation
was used for the calculation, with EQD2
10
; a/b =10for
PTV and E QD2
2
; a/b = 2 for OARs. Next, comparison
of dose distribution and dose volume renderings for the
prescribed dose were analyzed for the pituitary adenoma
using ShioRIS-2 in 9 contours.
Generally, treatment plan was made according to
the guideline of radiotherapy planning published by
Japanese society for therapeutic radiology and oncolog y
2008 (Table 1) [10,11]. Postsurgical areas are not
included intentionally in this trial. However, no consen-
sus was obtained in hypofractionated SRT.
Table 1 Reference for planning of pituitary adenoma and
meningioma
Pituitary adenoma Meningioma
PTV definitions
PTV = CTV + 1 mm
(CTV = GTV),
PTV = CTV + 1 mm
(CTV = GTV)
PTV = CTV + 2 - 4 mm
(CTV = GTV)
PTV = CTV + 2 - 3 mm
(CTV = GTV)
Prescribed dose
SRS 15 - 20 Gy marginal
dose, 25 Gy or more for
secreting pituitary
adenoma
11 - 18 Gy marginal dose
(recommended for 14 Gy
or more)
Conventional
fractionated SRT
isocenter 45 - 68 Gy/daily
1.8 Gy/fr., D95 50 - 56 Gy/
daily 2 Gy/fr.
SRT 45 - 50 Gy/25 - 28 fr. 2 Gy/fr.
Constrains for
organs at risk
[11]
SRS Optic tract < 8 - 10 Gy,
Conventional
fractionated
SRT Optic tract 50 Gy/25 fr
Spinal cord < 50 Gy (10
cm or less in length)
Retina < 45 Gy
Lens < 10 Gy
Brain stem < 60 Gy (1/3
volume)
SRS; stereotactic radiosurgery, SRT; stereotactic radiotherapy.
GTV; gross tumor volume, CTV; clinical treatment volume, PTV; planning target
volume, fr.; fraction.
D95; irradiation dose that included 95% volume of PTV.
Yamazaki et al. Radiation Oncology 2011, 6:10
/>Page 2 of 6
Case 1. Pituitary adenoma
This patient is a 46-year-old male with pituitary ade-
noma. He initially presented 4 years before with visual
disturbance, and was diagnosed as h aving a pituitary
adenoma. He underwent two surgical interventions,
resulting in loss of vision in the right eye; vision w as
maintained in the left eye. The adenoma gradually pro-
gressed, eventually requiring SRT using 25 Gy in
5 equal fractions (5 Gy × 5 times in consecutive 5 days)
for a minimum coverage of 90% of the PTV (D90).
DefaultplanusedCTV=GTVandPTV=CTV+
1 m m. Conformity index was 1.14. Prescribed doses for
OARs are depicted in Table 2.
Case 2. Meningioma
This patient is a 50-year-old female with sphenoid ridge
men ingio ma. She experienced back pain while perform-
ing nursing care for her mother three years before, and
was diagnosed at the time as having a meningioma.
During several years of follow-up the tumor grew, even-
tually requiring surgical intervent ion. Thereafter, a resi-
dual tumor grew slowly and she was recommended for
further treatment with the CyberKnife. She received
SRT using 30 Gy in 5 fractio ns (6 Gy × 5 times in con-
secutive 5 days) for D90. Default plan used CTV = GTV
andPTV=CTV+1mm.Conformityindexwas1.12.
Those plans were verified by other two physicians, and
used as a control references.
Statistical Analysis
All statistical analyses were carried out with the Stat-
view-v5.0 software program. Student’ s t-test was used
for normally distributed data and the Mann Whitney
U-test for skewed data. Percentages were analyzed with
the Chi-square test. A value of p < 0.05 was considered
to be statistically significant.
Results
Case 1. pituitary adenoma
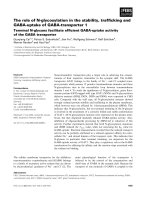
Each contour was superimposed on the original CT
images (Figure 1). Three physicians used PTV = CTV +
1mm(group1withamarginof1mmaroundthe
CTV). Seven used a protocol in which the PTV = CTV
= GTV (group 2 with no margin). The median PTV was
9.22 cm
3
(range, 7.17 - 14.3 cm
3
; Figure 2); the rat io of
thelargesttothesmallestcontouredvolumewas1.99.
Table 2 Plan characteristics
Meningioma EQD2
2
(Gy) Pituitary adenoma EQD2
10
(Gy)
No of plan 11 10
Tumor
Volume of PTV
(cm
3
)
8.06 ± 2.45 9.53 ± 1.75
Prescribed dose 5 30 Gy/5 fr. 40 4 25 Gy/5 fr. 31.3
1 16 Gy/1 fr. 34.6 2 21 Gy/3 fr. 29.8
1 21 Gy/3 fr. 29.8 1 22.5 Gy/3 fr. 32.8
1 24 Gy/5 fr. 29.6 2 24 Gy/5 fr. 29.6
1 23 Gy/3 fr. 33.9 1 24 Gy/3 fr. 36
1 24 Gy/3 fr. 36
Minimal dose/prescribed dose
(%)
83.7 ± 9 range 72 - 90 80 ± 12 range 60 - 99
Maximal dose/prescribed dose
(%)
122 ± 15 range 110 - 157 129 ± 17 range 105 - 157
OARs
(Gy)
Left eye 0.12 - 2.25 0.02 - 4.48
Right eye 3.07 - 18.6 0.05 - 4.52
Brain stem 4.97 - 15.4 4.5 - 19.5 17.3 - 24.74 30.0 - 42.9
Optic chiasm 4.61 - 15.4 4.1 - 19.9 16.6 - 26.4 22 - 48
Left lens 0.01 - 2.00 0.03 - 4.08
Right lens 0.88 - 6.68 0.13 - 3.81
Left optic nerve 0.79 - 8.96 0.4 - 8.5 12.4 - 23.4 23 - 50
Right optic nerve 7.93 - 26.4 14.6 - 47.9 0.37 - 23.4 17.5 - 57.5
EQD2 = n × d × (a/b+d)/(a/b+2), EQD2
10
; a/b = 10 for PTV and EQD2
2
; a/b = 2 for organs at risk.
OARs; organs at ri sk, fr.; fraction.
Yamazaki et al. Radiation Oncology 2011, 6:10
/>Page 3 of 6
Group 1 used PTV volume 10.1 ± 1.74 cm
3
and group
2used9.28±1.8cm
3
(p = 0.51, n.s.). Four physicians
used D90 (9.37 ± 0.4 cm
3
) and six used D95 (9.7 ±
2.6 cm
3
,n.s.vs.D90group)asdoseprescriptionmeth-
ods. The average of the smallest prescribed dose divided
by the prescribed dose in the PTV was 80% and the
mean maximum dose was 129%. The irradiated doses
for the OARs are depicted in Table 2. The irradiated
dose to the intact left optic nerve was kept below 50 Gy
(EQD2
2
) according to guideline [10,11], whereas the
right optic n erve in which vision was alr eady lost
received 57.5 Gy (EQD2
2
). Thus, no plan exceeded the
critical dose for the OARs [10,11]. Next, we analyzed
DVHs by superimposing the dispatched contours onto
the original default plan (25 Gy in 5 f ractions for D90;
Figure 3). The prescribed dose for D90 varied from
23.34 - 24.78 Gy (median: 24.68 Gy). Maximum dose
for left optic nerve ranged from 8.78 - 23.64 Gy (med-
ian: 12.41 Gy). Although the default plan delivered a
maximum dose of 8.79 Gy to the left optic nerve, the
maximum dose was increased up to 23.64 Gy (268%
higher dose than the default plan) in the comparison
contours. Therefore, c ontour deviation co uld cause an
unintended higher dose delivered to the OARs.
Case 2. meningioma
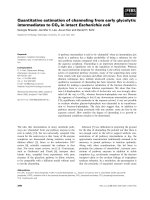
Each contour was superimposed on the original CT
images (Figure 2). Two physicians used PTV = CTV +
1mm,andoneusedPTV=CTV+1-2mm(group
1 with a margin of 1 mm around the CTV). Seven used
protocol PTV = CTV = GTV (gro up 2 with no margin).
The median PTV was 6.86 cm
3
(range, 6.04 - 14.6 cm
3
)
(Figure 3), and the ratio of the largest to the smallest
contoured volume was 2.41. Group 1 used larger PTV
volume (10.1 ± 3.26 cm
3
) than group 2 (6.91 ± 0.7 cm
3
,
p = 0.03). Four physicians used D90 (6.7 ± 0.4 cm
3
),
and seven used D95 (8.1 ± 1.2 cm
3
, vs. D90 group) as a
prescribed dose. The average minimum prescribed dose
(%) in the PTV was 83.7% and the mean maximum dose
was 122%. The prescribed dose for OARs was assessed
in 11 cases and is depicted in Table 2. No plan exceeded
(a)
(b)
(
c
)
(d)
Figure 1 Contours superimposed on t he default CT image
(Pituitary adenoma). (a) (b) axial section (c) sagittal section (d)
coronal section.
(a) (b) (c)
(
d
)(
e
)
Figure 2 Contours superimposed on t he default CT image
(Meningioma). (a) (b) (c) axial section (d) sagittal section (e) coronal
section The red lines depict planning target volumes, and the green
lines depict delineations of organs at risk from each clinician.
16
14
16
10
12
m
3
᧥
6
8
volume (c
m
4
6
PTV
0
2
Meningioma
Pituitar
y
adenoma
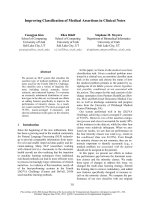
Figure 3 Variationinplanningtreatmentvolume(PTV)in
pituitary adenoma and meningioma cases.
Yamazaki et al. Radiation Oncology 2011, 6:10
/>Page 4 of 6
the determined critical dose for OARs [10,11]. Next, the
DVHs were reanalyzed by superimposing the contours
from participants onto the default plan (Figure 4). The
median value for the D90 prescribed dose for PTV was
30.29 Gy (24.24 - 30.66 Gy), and the maximum dose
received by the right optic nerve had a median value of
19.39 Gy (16.21 - 24.84 Gy). Therefore, some plans used
24.24 Gy as a D90 prescribed dose (19% lower dose
than anticipated) when using t heir contoured PTV. In
addition, a higher maximum dose of 24.84 Gy (131% of
the default plan dose of 18.9 Gy) was delivered for the
right optic nerve in the contours used in some
institutes.
Discussion
Inter-observer variation is a well-known problem in med-
ical practice. Gardenia et al. first repo rted on this issue in
the 1950 s [3], and it became a subject for discussion in
the radiotherapeutic community in the 1970 s. In the
1990 s, many articles were published about inter-observer
variation for a variety of cancers: prostate cancer [4],
brain tumors [5], breast cancer [6] head and neck cancer
[12,13], and lung cancer [14,15]. However, we were
unable to find any papers that examined inter-observer
variation for pituitary adenoma and meningioma; to the
best of our knowledge, this is the first such report.
DVHs analysis by superimposing different contours
from multipl e clinicians onto the default treatment plan
showed higher maxim al dose for o ptic tract (F igure 3).
It was increased to 23.64 Gy (268% higher dose than
default plan) for the pituitary adenoma and 1 9.39 Gy
(131%) for the m eningioma. These results imply that
contour deviations across plans could easily cause unex-
pectedly higher doses to OARs. On the other hand,
some comparison plans prescribed 19% lower does than
the default 24.24 Gy in the meningioma. Although the
dose to PTV is not a matter of this study because it will
be changed by physician’s decision (PTV definition etc.),
we can suggest that there are such a variety of different
SRT plans using same CT images.
Several li mitations should be considered in our study.
At first, BED assessment is not validated in hypofractio-
nated SRT, however it is an only method to compare
different fractionation quantitatively at present. Next,
although we used default plan as a control references
after confirmed by other two phys icians, there is neither
consensus in contouring nor planning in these area, so
that in fact it is only simulation examination. Thirdly,
although we confirmed precision of fusion software by
visual inspection at least by other two physicians, accu-
racy of fusion is still qualified by subjective methods.
To obtain reproducible outcomes using an inverse
plan, consensus among the participants should be
reached in advance to avoid uncertainty; for example,
definitions of major violations should be provided and
training sessions made available for participants to
improve the conformity of their plans to an agreed upon
benchmark. These results underline the importance of
QA assessment for reproducible outcomes, not only in
contouring and t he setting of dose constraints, but also
for planned dose distributions especially in a multi-clini-
cian study. We should keep in mind the risk of such new
techniques as cyberknife if the QA is not followed.
In conclusion, quality assurance revealed inter-observer
variability in contour delineation of pituitary adenoma
and meningioma near optic tract.
Acknowledgements
The authors wish to thank Ms. Hitomi Fuse, Mr. Yoshiichi Murashima, Mr.
Naokazu Higashinaka, and Mr. Yoshiaki Furutani for their dedicated
contributions to this manuscript.
Author details
1
Department of Radiology, Graduate School of Medical Science, Kyoto
Prefectural University of Medicine, 465 Kajiicho Kawaramachi Hirokoji,
Kamigyo-ku, Kyoto 602 - 8566 Japan.
2
CyberKnife Center, Soseikai General
(a)
(
b
)
()
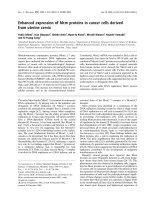
Figure 4 Influence of different contours on the DVH anal ysis.
Each contour was layered over the original default plan (Soseikai
General Hospital). The dose calculation was made by ShioRIS, and
the DVH was calculated using ShioRIS-2. a) Pituitary adenoma:10
contours Left panel. PTV. Default D90 = 25 Gy/5 fractions. According
to the applied contours, the D90 median dose was 24.68 Gy (23.34 -
24.78 Gy). Right panel. OAR (left optic nerve). Left optic nerve
received 8.79 Gy in default plan (made by T. T.), median 12.41 Gy
(8.78 - 23.64 Gy; 23.64 Gy = 268% of default plan) b) Meningioma:
11 contours Left panel. PTV. Default D90 = 30 Gy/5 fractions.
According to the applied contours, the D90 median dose was 30.29
Gy (24.24 - 30.66 Gy). Right panel. OAR (right optic nerve). The right
optic nerve received a median dose of 19.39 Gy (16.21 - 24.84 Gy;
18.9 Gy in the default plan). Therefore, some plans used 24.24 Gy as
a D90 prescribed dose (19% lower dose than anticipated in widen
PTV group) when using their contoured PTV. In addition, a higher
maximum dose of 24.84 Gy (131% higher dose than default plan
18.9 Gy) was delivered to the right optic nerve in contours used in
some institutes.
Yamazaki et al. Radiation Oncology 2011, 6:10
/>Page 5 of 6
Hospital,126 Kami-Misu, Shimotoba Fushimi-ku, Kyoto Japan.
3
CyberKnife
Center, Tobata Kyoritsu Hospital, Sawami 2 - 5 - 1, Tobata-ku, Kita-Kyusyu,
Fukuoka Japan.
4
Toyama Cyberknife Center, Hiyodorijima 1837 - 5, Toyama,
Toyama Japan.
5
CyberKnife Center, Okayama Kyokuto Hospital, Kurata 567 -
1, Naka-ku, Okayama, Okayama Japan.
6
Radiotherapy Department, Fujimoto
Hayasuzu Hospital, Hayasuzu 17 - 1, Miyakonojo, Miyazaki 885 - 0055, Japan.
7
Tokyo CyberKnife Center, 27 - 1 Negishi, Machida, Tokyo 194 - 0034, Japan.
8
Department of Radiation Oncology, Osaka University Medical School, 2 -
2 Yamadaoka Suita, Osaka Japan.
Authors’ contributions
HY conceived of this study and drafted manuscript, HS made software and
participated in the design of this study. TT, NK and TN participated in
confirmation of default plan and the statistical analysis. HY, HS, TT, NK, TN,
NA, HU, MN, YB, MO, KY and TK made plan and participated coordination
and helped to draft the manuscript. All authors read and approved the final
manuscript.
Competing interests
The authors declare that they have no competing interests
Received: 2 December 2010 Accepted: 27 January 2011
Published: 27 January 2011
References
1. Riboldi M, Sharp GC, Baroni G, Chen GT: Four-dimensional targeting error
analysis in image-guided radiotherapy. Phys Med Biol 2009, 54:5995-6008.
2. Yamazaki H, Nishiyama K, Tanaka E, Koiwai K, Shikama N, Ito Y, Arahira S,
Tamamoto T, Shibata T, Tamaki Y, Kodaira T, Oguchi M: Dummy run for a
phase II multi-institute trial of chemoradiotherapy for unresectable
pancreatic cancer: inter-observer variance in contour delineation.
Anticancer Res 2007, 27:2965-71.
3. Gandevia B, Stradling P: Observer variation in the tomographic diagnosis
of tuberuculous cavitation. Tubercle 1957, 38:113-22.
4. Villeirs GM, Van Vaerenbergh K, Vakaet L, Bral S, Claus F, De Neve WJ,
Verstraete KL, De Meerleer GO: Interobserver delineation variation using
CT versus combined CT + MRI in intensity-modulated radiotherapy for
prostate cancer. Strahlenther Onkol 2005, 181:424-30.
5. Weltens C, Menten J, Feron M, Weltens C, Menten J, Feron M, Bellon E,
Demaerel P, Maes F, Van den Bogaert W, van der Schueren E, et al:
Interobserver variations in gross tumor volume delineation of brain
tumors on computed tomography and impact of magnetic resonance
imaging. Radiother Oncol 2001, 60:49-59.
6. Poortmans PM, Venselaar JL, Struikmans H, Hurkmans CW, Davis JB,
Huyskens D, van Tienhoven G, Vlaun V, Lagendijk JJ, Mijnheer BJ, De
Winter KA, Van der Hulst MH, Van den Bogaert WF: The potential impact
of treatment variations on the results of radiotherapy of the internal
mammary lymph node chain: a quality-assurance report on the dummy
run of EORTC Phase III randomized trial 22922/10925 in Stage I–III
breast cancer. Int J Radiat Oncol Biol Phys 2001, 49:1399-408.
7. Stafford SL, Pollock BE, Foote RL, Link MJ, Gorman DA, Schomberg PJ,
Leavitt JA: Meningioma radiosurgery: tumor control, outcomes, and
complications among 190 consecutive patients. Neurosurgery 2001,
49:1029-1037.
8. Erridge SC, Conkey DS, Stockton D, Strachan MW, Statham PF, Whittle IR,
Grant R, Kerr GR, Gregor A: Radiotherapy for pituitary adenomas: long-
term efficacy and toxicity. Radiother Oncol 2009, 93:597-601.
9. Milker-Zabel S, Debus J, Thilmann C, Schlegel W, Wannenmacher M:
Fractionated stereotactically guided radiotherapy and radiosurgery in
the treatment of functional and nonfunctional adenomas of the
pituitary gland. Int J Radiat Oncol Biol Phys 2001, 50:1279-1286.
10. Guideline for radiotherapy planning. Japanese society for therapeutic
radiology and oncology Japanese College of Radiology, Japan radiological
society; [ (in Japanese).
11. Emami B, Lyman J, Brown A, Coia L, Goitein M, Munzenrider JE, Shank B,
Solin LJ, Wesson M: Tolerance of normal tissue to therapeutic irradiation.
Int J Radiat Oncol Biol Phys 1991, 21:109-22.
12. Jeanneret-Sozzi W, Moeckli R, Valley JF, Zouhair A, Ozsahin EM,
Mirimanoff RO, SASRO: The reasons for discrepancies in target volume
delineation: a SASRO study on head-and-neck and prostate cancers.
Strahlenther Onkol 2006, 182:450-7.
13. Geets X, Daisne JF, Arcangeli S, Coche E, De Poel M, Duprez T, Nardella G,
Grégoire V: Inter-observer variability in the delineation of pharyngo-
laryngeal tumor, parotid glands and cervical spinal cord: comparison
between CT-scan and MRI. Radiother Oncol 2005, 77
:25-31.
14. Steenbakkers RJ, Duppen JC, Fitton I, Deurloo KE, Zijp L, Uitterhoeve AL,
Rodrigus PT, Kramer GW, Bussink J, De Jaeger K, Belderbos JS, Hart AA,
Nowak PJ, van Herk M, Rasch CR: Observer variation in target volume
delineation of lung cancer related to radiation oncologist-computer
interaction: a ‘Big Brother’ evaluation. Radiother Oncol 2005, 77:182-90.
15. van Sornsen de Koste JR, Senan S, Underberg RW, Oei SS, Elshove D,
Slotman BJ, Lagerwaard FJ: Use of CD-ROM-based tool for analyzing
contouring variations in involved-field radiotherapy for stage III NSCLC.
Int J Radiat Oncol Biol Phys 2005, 63:334-339.
doi:10.1186/1748-717X-6-10
Cite this article as: Yamazaki et al.: Quantitative assessment of inter-
observer variability in target volume delineation on stereotactic
radiotherapy treatment for pituitary adenoma and meningioma near
optic tract. Radiation Oncology 2011 6:10.
Submit your next manuscript to BioMed Central
and take full advantage of:
• Convenient online submission
• Thorough peer review
• No space constraints or color figure charges
• Immediate publication on acceptance
• Inclusion in PubMed, CAS, Scopus and Google Scholar
• Research which is freely available for redistribution
Submit your manuscript at
www.biomedcentral.com/submit
Yamazaki et al. Radiation Oncology 2011, 6:10
/>Page 6 of 6