Báo cáo khoa học: " Dose-response relationship for breast cancer induction at radiotherapy dose" doc
Bạn đang xem bản rút gọn của tài liệu. Xem và tải ngay bản đầy đủ của tài liệu tại đây (298.7 KB, 7 trang )
RESEARCH Open Access
Dose-response relationship for breast cancer
induction at radiotherapy dose
Uwe Schneider
1,2*
, Marcin Sumila
2
, Judith Robotka
2
, Günther Gruber
2
, Andreas Mack
2
and Jürgen Besserer
2
Abstract
Purpose: Cancer induction after radiation therapy is known as a severe side effect. It is therefore of interest to
predict the probability of second cancer appearance for the patient to be treated including breast cancer.
Materials and methods: In this work a dose-response relationship for breast cancer is derived based on
(i) the analysis of breast cancer induction after Hodgkin’s disease,
(ii) a cancer risk model developed for high doses including fractionation based on the linear quadratic model, and
(iii) the reconstruction of treatment plans for Hodgkin ’s patients treated with radiotherapy,
(iv) the breast cancer induction of the A-bomb survivor data.
Results: The fitted model parameters for an a/b =3Gy were a = 0.067Gy
-1
and R = 0.62. The risk for breast cancer
is according to this model for small doses consistent with the finding of the A-bomb survivors, has a maximum at
doses of around 20 Gy and drops off only slightly at larger doses. The predicted EAR for breast cancer after
radiotherapy of Hodgkin’s disease is 11.7/10000PY which can be compared to the findings of several
epidemiological studies where EAR for breast cancer varies between 10.5 and 29.4/10000PY. The model was used
to predict the impact of the reduction of radiation volume on breast cancer risk. It was estimated that mantle field
irradiation is associated with a 3.2-fold increased risk compared with mediastinal irradiation alone, which is in
agreement with a published value of 2.7. It was also shown that the modelled age dependency of breast cancer
risk is in satisfying agreement with published data.
Conclusions: The dose-response relationship obtained in this report can be used for the prediction of radiation
induced secondary breast cancer of radiotherapy patients.
Keywords: second cancer, breast cancer, carcinogenesis
Background
Cancer induction after radiation therapy is known as a
severe side effect. I t is therefore of interest to predict
the probability of second cancer appearance for the
patient to be treated. For this purpose it is not sufficient
to apply the results from epidem iological studies on
cancer induction from more than 20 years ago to the
patient treated today, since radiation therapy changed
significantly in the last decades, for instance radiation
type, treatment technique, application of treatment,
treatment duration and 3D dose distributions.
As a consequence it is necessary to model cancer
induction for patients undergoing radiother apy and thus
the underlying dose-response relationship [1-3]. Such
modelling can be based on epidemiological studies of
patients treated with old techniques. However, most of
the epidemiological studies, which are published in large
numbers, don’t provide a correlation of cancer induction
with dose. Unfortunately, if a dose correlation is
deduced, cancer induction is usually related to the inte-
gral dose or average organ dose and thus implies a lin-
ear dose-response relationship. Therefore, such data
cannot be used directly to obtain non-linear dose-
response relationships. Up to now there are only few
studies which correlate cancer induction in radiotherapy
patients with point dose estimates at the location of sec-
ondary tumor growth [4-10].
* Correspondence:
1
Vetsuisse Faculty, University of Zürich, Winterthurerstrasse 260, 8057 Zürich,
Switzerland
Full list of author information is available at the end of the article
Schneider et al. Radiation Oncology 2011, 6:67
/>© 2011 Schneider et al; licensee BioMed Central Ltd. This is an Open Access a rticle distributed under the terms of the Creative
Commons Attribution License ( which permits unrestricted use, distribut ion, and
reproduction in any medium, provided the original work is properly cited.
Radiotherapy of patients with Hodgkin’s disease is very
successful, but women treated with mantle fie ld radia-
tion experience up to a 30-fold increased risks for breast
cancer compared with thei r peers in the general popula-
tion. Travis et al [8] for instance studied breast cancer
induction for mantle field treatments of Hodgkin’sdis-
ease. They reconstructed the point doses where the sec-
ondary breast cancer was l ocated and performed a case/
contro l study to stratify breast canc er risk as a function
of dose.
The goal of this report is the derivation of a dose-
response relationship for breast cancer induction based
on the analysis of Hodgkin’s disease patients by Travis
et al [8] and breast cancer induction from the A-bomb
survivors [11]. A recently developed cancer induction
model [12] including fractionation was fitted to the
available data. The model was tested by predicting sec-
ond cancer risk resulting from historical mantle field
treatments for Ho dgkin’ s disease and comparing them
to published epidemiological data. In addition model
predict ions were compared to recently published second
breast cancer risk for mediastinal involved field
radiotherapy.
Materials and methods
Dose-response model
It is assumed that cancer induction is proportional to
the number of cells in the tissue a nd thus to the mass
of the tissue. Since we are analyzing breast tissue only,
cancer induction is considered to be proportional to the
involved volume assuming a constant cell density over
the whole breast. The tissue is irradiated with a fractio-
nated treatment schedule of equal dose fr actions d up
to a dose D. The number of original cells after irradia-
tion is reduced by cell kill which is proportional to a’
and is defined using the linear quadratic model
α
= α +
βd
(1)
It is further assumed for this work, that the number of
killed original tissue cells is replaced by a number of
new cells. Additionally it is assumed that t he repopula-
tion kinetics of repopulate d cells will follo w the same
basic patterns as those of normal cells. Cells which were
irradiated can be mutated and have the potential to
develop a tumor. In the context of this work the word
“mutation” is used as a synonym for each cell transfor-
mation which develops new tumor cells. In fact the
development o f a tumor usually implies several muta-
tions. The mutational process for one dose fraction is
modelled according to the linear-no-threshold model
and thus cancer risk originating from an irradiation with
one dose fraction d is taken proportional to μ which is
the slope of cancer induction from the linear-no-
threshold model which is mainly based on the data of
theA-bombsurvivors.Itisfinallyassumedthatthe
number of involved cells is treated as a continuous func-
tion of dose, a system of differential equations derived
from the cell kinetics can be solved [12]. The excess
absolute risk for carcinoma induction is then
EAR
mod
= μ
e
−α
D
α
R
⎛
⎜
⎝
1 − 2R + R
2
e
α
D
−
(
1 − R
)
2
e
−
α
R
1 − R
D
⎞
⎟
⎠
≡ μRED
,
(2)
where R is the fraction of repopulated cells at the end
of treatment and thus characterizes the ability of the tis-
suetorepopulate.Tissuewhichisnotabletorepopu-
late/repair corresponds to R=0and complete
repopulation/repair is characterized by R=1.Eq.2was
obtained from [12] by substituting R=ξ(a’+ ξ) into Eq.
7a of [12] where ξ was origi nall y introduced to describe
the repopulation/repair rate. Risk equivalent dose (RED),
as defined by Eq. 2, is a dose-response weighted local
dose value which is by definition proportional to risk.
When RED is averaged over the whole breast the organ
equivalent dose (OED) can be calculated [1]. OED
which is measured in Gy is then dir ectly proportional to
cancer risk in the breast:
EAR
Breast
= μ
1
V
Breast
i
V
i
RED
i
≡ μOED
Breas
t
(3)
where the sum is taken over all volume elements V
i
of
the breast and V
Breast
is the total breast volume.
It is assumed here an a/b = 3 Gy for breast tissue.
However, a/b =1Gyanda/b =5Gywerealsoused
for optimization to test the robustness of the model.
A requirement for any realistic dose-response model is
that the predicted cancer risk approaches in the limit of
low dose the well known linear-no-threshold (LNT)
model which is usually used for risk estimates in radia-
tion protectio n. The excess absolute risk for breast can-
cer induction at low dose derived from the A-bomb
survivor data according to Table 29 in Preston et al [11]
is 9.2 (CI95: 6.8-12) cases per 10000 persons per year
per Gy at age 70 after exposure at age 30. This value
must be modified to fit the age distributio n of the
cohort of the Travis [8] study. Average age at diagnosis
(agex) of the Hodgkin’s disease patients was 2 2 years.
The patients d eveloped breast cancer in average 18
years after diagnosis of Hodgkin’s disease, which results
in an attained age (agea) of 40. The LNT-risk for breast
cancer induction is according to [11]:
μ = 9.2 exp
−0.037
agex − 30
+1.7ln
agea
70
= 4.8/10000PY/G
y
(4)
where the age modelling was centered around 30 and
70 years, respectively. This risk representing the A-
Schneider et al. Radiation Oncology 2011, 6:67
/>Page 2 of 7
bomb survivor data is plotted with the corresponding
error bar in all figures of this report as a dashed line.
Patient data and statistical analysis
In the analysis for this work a matched case-control
study condu cted by Travis et al [8] was used. The study
analysed a population-based cohort of 3817 women who
were treated for Hodgkin’ s disease between 1965 and
1994. The mean and median age at diagnosis was 22
years. Point dose reconstruction for the breast cancer
was possible for 102 cases and 257 controls. Patients
with breast cancer were grouped into 7 dose categories
(Table 1).
The unadjusted odds ratio was computed from con-
trols and cases, and the error factor and confidence
levels were obtained using maximum likelihood esti-
mates. The odds ratio, which approximates relative risk,
is listed in Table 1.
The model parameters a and R of Eq.2 were opti-
mized by a variation in the interval [0,1] for both case-
control studies independently. For any combination of
( a
,
R)Î [0,1] the relative risks of Travis et al [8] were
converted to excess absolute risk. The risk for radiation
induced cancer after radiation therapy is better modelled
using excess absolute risk (EAR) as expressed by Eq. 2,
since relative risk estimates make only sense when
patients with the same dose distributions are compared
and this is most often not the case for radiotherapy
patients. As EAR defined by Eq. 2 approaches for small
dose the LNT model it was assumed that the risk of the
lowest dose category corresponds to the findings of the
A-bomb survivor data. This correspondence was used to
transform the Travis data, expressed in odds ratios, into
EAR. However, the LN T risk for breast cancer (μ =4.8/
10000PY/Gy according to Eq. 4) is subject to an uncer-
tainty between 3.5 and 6.2/10000PY/Gy (95% CI-interval
according to [11]). This uncertainty was included in the
model fit for the lowest dose category.
The model parameters a and R were determined by a
least square minimization of
Min
(
α, R
)
i
EAR
study
i
− EAR
(
α, R
)
i
mod
2
(5)
The parameters were optimized using a 0.1% precision
criteria and were performed for t hree different a/b
values (1, 3, 5 Gy). The standard deviation of the fitted
parameters were calculated from t he error of the odds
ratios by Gaussian error propagation using the partial
derivatives of Eq. 2 and are listed in Table 2. It was
further assumed that the total number of person years
in the seven dose groups is comparable.
Dose reconstruction for risk predictions
Dose distributions were reconstructed, which were char-
acteristic for a large patient collective of Hodgkin’sdis-
ease patients. We calculated the dose distributions in an
Alderson Rando Phantom with a 200 ml breast
attachment.
Typical treatment techniques for Hodgkin’ sdisease
radiotherapy were reconstructed. Treatment planning
was performed on the basis of the review by Hoppe [13]
and the German Hodgkin disease study protocols
(). We used for treatment planning
the Eclipse External Beam Planning system version 8.6
(Varian Oncology Systems, Palo Alto, CA) using the
AAA-algorithm (version 8.6.14). Treatment plans were
computed which included mantle field treatment and
treatment of supraclavicular, axillary and mediastinal
lymph nodes for both, left and right location. All plans
were calculated with 6 MV photons and consisted of
two opposed fields. The technique for shaping large
fields included divergent lead blocks. Treatment was
performed at a distance of 100 cm (SSD). Anterior-pos-
terior (ap/pa) oppos ed field t reatment techniques wer e
applied to insure dose homogeneity.
The mantle field included the bilateral cervic al, supra-
clavicular, axillary, infraclavicular, mediastinal and pul-
monary hilar lymph nodes. The unblocked field size was
34 cm × 33 cm with equal field weights from 0° and
180°. The superior border of the mantle was located
Table 1 Point dose estimates and related odd ratios for breast cancer after radiotherapy of Hodgkin’s disease from
Travis et al [8]
Median dose (range)
[Gy]
Cases Controls Odds ratio (stand.
dev.)
p-value EAR optimized with A-bomb agex =30agea = 70, a/b =3
(std. dev.)
3.2 (0-3.9) 15 76 Reference Reference 19.3
4.6 (4.0-6.9) 13 30 2.2 (1.4-3.4) 0.07 42.5 (27.5-65.7)
21.0 (7.0-23.1) 16 30 2.7 (1.8-4.1) 0.02 52.3 (34.4-79.5)
24.5 (23.2-27.9) 9 30 1.5 (0.9-2.4) 0.38 29.4 (18.3-47.2)
35.2 (28.0-37.1) 20 31 3.3 (2.2-4.9) <0.01 63.3 (42.3-94.6)
39.8 (37.2-40.4) 12 31 2.0 (1.3-3.1) 0.13 38.0 (24.4-59.0)
41.7 (40.5-61.3) 17 29 3.0 (2.0-4.5) 0.01 57.5 (37.9-87.1)
EAR was optimized for age at exposure of 30 years, attained age 70 years and a/b = 3Gy.
Schneider et al. Radiation Oncology 2011, 6:67
/>Page 3 of 7
along the base of the mandible, and the inferior border
was at the level of the insertion of t he diaphragm (T10
vertebra). Blocks were placed over the lung and the
humeral heads both anteriorly and posteriorly. Spinal
cord blocking was not needed, since the planned total
dose was 38 Gy, which is the average dose of the
patients studied by Travis et al [8]. All blocks were con-
toured by hand.
The pelvic field included bilateral iliac and inguinal
lymph nodes with 2 cm safety m argins laterally. The
superior border was drawn at the L4-5 interspace, the
inferior border was bilateral at the inferior border of the
obturatorial foramen.
The supraclavicular field included the ipsilateral
supraclavicular fossa and the lower cervical lymph
nodes, that means from the i nferior border of the hyoid
bone to 1.5 - 2 cm below the clavicle.
Theaxillarvfieldencompassedtheaxillarlymph
nodes. It included the periclavicular region and reached
caudally to the 6th rib. A small peripheral lung zone of
1.5 cm was included. We used a block over the humeral
head. The mediastinal fie ld included both the s uperior
and inferi or mediastinal and hilar lymph nodes in addi-
tion to the lower cervical and supraclavicular lymph
nodes (medial 2/3 of clavicula). The upper border was
the hyoid bone, the lower border the insertion of the
diaphragm. The field border was on each site 1.5 cm
inferior to the clavicule, along transversal processi and
1.5 cm laterally from each hilus.
Results
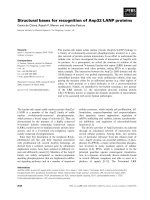
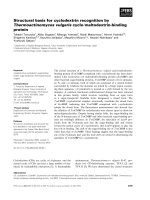
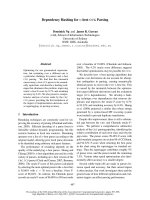
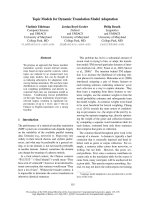
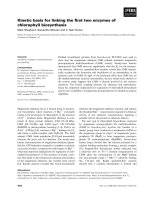
Results of the model fit
The results of the fitting procedure to the Travis data [8]
are displayed for a/b =1,3,5GyinFigures.1,2and3,
respectively. The squares represent the data points from
the work of Travis et al. [8] for the outlined breast
volume with the corresponding dose (one standard devia-
tion). Modelled risk is the average of the left and right
breast. It should be noted here that the dose axis shows
the total dose in breast tissue after the end of treatment
and not the cumulated target dose. The optimized model
parameters are listed in table 2 for a/b =1,3and5Gy.
A variation of a/b from1Gyto5Gyshowsnosignifi-
cant differences in breast cancer risk at high dose.
Comparison of modelled breast cancer risk with
published results of mantle field treatment
The dose-response relationship for breast cancer induction
obtained in this work was used to predict female breast
cancer risk resulting from independent epidemiological
studies of mantle field treatments of Hodgkin’s disease.
Data for female breast cancer risk were taken from the
publications of Hancock and Hoppe [14] who found an
EAR
Breast
= 21.5/10000PY, from Swer dlow et al [15] 3.1/
10000 PY, from Dores et al [16] 10.5/10000PY and from
vanLeeuwenetal29.4/10000PY [17]. The mean age at
exposure and attained age of the respective patient
cohorts are listed in Table 3 and were used for the
model calculations with Eq. 4. Cal culations using the
Table 2 Fitted model parameters with the corresponding
standard deviation for different a/b-values
Fitted
parameter
a/b [Gy]
13 5
a (±s
a
)/[Gy
-1
] 0.036 (0.021-
0.076)
0.067 (0.033-
0.112 )
0.080 (0.042-
0.130)
R(±s
R
) 0.66 (0.43-0.92) 0.62 (0.34-0.90) 0.62 (0.34-0.90)
Figure 1 Plot of the modelled excess absolute risk (solid line)
to the epidemiological data of Travis et al [8]for a/b =1Gy.
The dashed line represents the LNT-model for breast cancer with
the corresponding error [10].
Figure 2 Plot of the modelled excess absolute risk (solid line)
to the epidemiological data of Travis et al [8]for a/b =3Gy.
The dashed line represents the LNT-model for breast cancer with
the corresponding error [10].
Schneider et al. Radiation Oncology 2011, 6:67
/>Page 4 of 7
model parameters with a/b = 3 Gy resulted in an EAR
of 10.6/10000PY, 11.7/10000PY, 11.0/10000PY and 12 .9/
10000PY for Hancock and Hoppe, Swerdlow, Dores and
van Leeuwen, respectively and are listed in Table 4.
These predictions can be viewed as a test of the model.
It should be noted here that the statistical power of
the published data is quite different due to the differ ent
cohortsizes(Table3)involved.ThedatafromDoreset
al[16]arebyfarthemostreliablesincethenumberof
observed persons is six-times larger than the second lar-
gest group.
Comparison of modelled breast cancer risk with
published results for involved field treatment
De Bruin et al [18] recently assessed the long-term risk of
breast cancer after treatment for Hodgk in’ s lymphoma.
In contrast to other researchers they focused on the risk
after smaller radiation volumes. De Bruin et al [18] per-
formed a cohort study among 1,122 female 5-year survi-
vors treated for Hodgkin’s lymphoma and compared the
incidence of breast cancer with that in the general popu-
lation. During fo llow-up, 122 patients develo ped breast
cancer. All of them had previously received radiotherapy
with a dose o f 40 Gy (36 to 44 Gy) in fractions of 2.0 Gy.
The median follow-up time for the total cohort was 17.8
years. The median age at first treatment for Hodgkin’s
lymphoma was 26.3 years. The distribution of radiation
fields was carefully recorded and is listed in Table 5
together with the treatment techniques for which De
Bruin et al determined risk.
Breast cancer risk for the cohort analysed by De Bruin
et al [18] was modelled using the dose-volume histo-
grams for the left and right breast obtained from the
treatment plans listed in Table 5. OED was calculated
using Eqs. 2-4 with an a/b = 3 Gy using the fitted
model parameters from Table 2. Since OED is additive
the total OED for a treatment technique was determined
using the weighting of the treatment fields of Table 5.
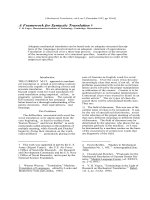
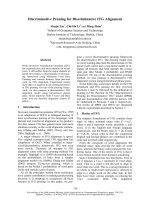
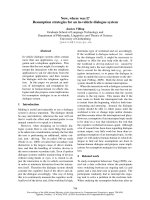
Comparison of modelled age dependence of breast
cancer risk with clinical results
Another question is whether the age dependence of breast
cancer of the presented model which is based on the
recent data of the A-bomb survivors fits clinical data of
breast cancer induction after radiotherapy. For this pur-
pose the modelled age dependence according to Eq. 4 was
compared to the published results of De Bruin et al [Table
3 in 18]. In Figure 4 the modelled age dependence of risk,
normalised to the De Bruin dat a, is shown together with
the corresponding epidemiological data from De Bruin as
the symbols. The model agrees well for the age groups 21-
50. The age group <20 years shows significant differences.
The involved errors, however, are large.
Discussion
The aim of this study was the determination of model
parameters for a dose-re sponse relationship for breast
cancer covering dose levels relevant for radiotherapy. In
addition a model for the age dependence o f breast can-
cer risk was verified. The model was tested with epide-
miological data o n second breast cancer of historic
mantle field treatments and high dose involved field
radiotherapy. Satisfying agreement was found. In the
limit of small dose the model approaches the LNT-
model for cancer induction.
In this report a cancer induction model for the radio-
therapy dose range was used. Several assumptions had
to be made to simplify the biological processes leading
to cancer induction [12]. This includes the design of tis-
sues, the repopulation process and processe s which
result in the formation of a tumor cell. This was done
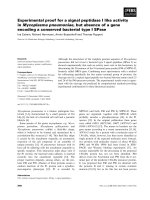
Figure 3 Plot of the modelled excess absolute risk (solid line)
to the epidemiological data of Travis et al [8]for a/b =5Gy.
The dashed line represents the LNT-model for breast cancer with
the corresponding error [10].
Table 3 Cohort size (number of patients), median age at exposure and attained age for the published breast cancer
rates after Hodgkin’s disease radiotherapy
Published breast cancer risk after Hodgkin’s disease Cohort size Age at exposure Age at exposure + mean follow-up
Dores et al. [16] 32’591 37 45
Hancock and Hoppe [14] 2’162 29 40
Swerdlow et al. [15] 5’519 36 45
van Leeuwen et al. [17] 1’253 24 38
Schneider et al. Radiation Oncology 2011, 6:67
/>Page 5 of 7
to keep the number of model parameters at a minimum.
However, this is associated with uncertainties.
When interpreting the results o f this study, certain
limitations should be taken into account. The model
was fitted to epidemiological data describing breast can-
cer risk after radiotherapy of H odgkin’ s disease. Several
assumptions were made to use these data for model fit-
ting. It has been hypothesized that the age parameters
of the complete patient co horts can be applied to the
patients grouped in different dose categories. In addition
the median/averages of the characteristic age parameters
were used knowin g that the ages can vary significantly
and that the age dependence is in general non-linear.
In addition the impact of ov arian function on breast can-
cer induction is not included in the model. Chemotherapy
andpelvicradiotherapycouldhaveaprotectiveeffect
regarding breast cancer induction. However, in the publica-
tion of De Bruin e t al [ 18] such an effect was not f ound.
In this work EAR has been used to quantify radiation-
induced cancer. Usually excess relative risk (ERR) is
recommended for transferri ng risk from the Japanese
population to other populations. EAR is used here, since
the risk calculations of the Hodgkin’s cohort are based on
extremely inhomogeneous dose distributions. Currently
there is no method available for obtaining analogous
organ risks using ERR. As the difference between the Japa-
nese and the US population in EAR for all solid tumors is
less than 10% the use of EAR is probably justifiable.
Additionally, as the results of this report are expressed
in terms of EAR, it is also difficult to compare them
with th e findings of Sachs and Brenner [2] who fitted an
algebraic model of cancer induction to breast cancer
risk. The risk ratio between historic mantle field treat-
ments and high dose involved field radiotherapy is how-
ever comparable with other ERR models [19].
The treatment plans calculated in this work were
computed using 6 MV photons. Apparently, patients
treated in a time period of nearly 30 years were irra-
diated with x-ray beams of various e nergies. Since De
Bruin e t al [18] presented no information on the range
of treatment energies, it was decided to use 6 MV
photons. However, this could have an impact on the cal-
culated dose distributions in particular on the deposited
energy from scattered radiation.
Conclusion
In this work a dose-response relationship for breast can-
cer was derived based on the analysis of breast cancer
induction after Hodgkin’ s disease, a cancer risk model
developed for high doses including fractionation based
on the linear qua dratic model, and the reconstruction of
treatment plans for Hodgkin’ s patients treated with
radiotherapy.
The fitted model parameters for an a/b = 3 Gy and μ
= 4.8/10000PY/Gy were a = 0.067 Gy
-1
and R =0.62.
Breast cancer risk is according to this model for small
doses consistent with the findings of the A-bomb survi-
vors, has a maximum at doses of around 20 Gy and
drops off only slightly at larger doses. The predicted
EAR for breast cancer after radiotherapy of Hodgkin’s
disease is 11.7/10000PY which can be compared to the
findings of several epidemiological studies were EAR for
Table 4 Modelled breast cancer risk for different a/b-values for mantle field treatment of Hodgkin’s disease and
comparison with published data
EAR [/10000 PY] Dores et al [16] Hancock and Hoppe [14] Swerdlow et al [15] van Leeuwen [17] average
observed 10.5 21.5 3.1 29.4 16.1
a/b = 1 Gy 12.0 (10.9-13.7) 13.2 (12.0-15.0) 12.4 (9.1-15.1) 14.5 (13.2-16.6) 13.0
a/b = 3 Gy 10.7 (8.3-14.3) 11.8 (9.2 -15.8) 11.1 (8.7-14.9) 13.0 (10.1-17.4) 11.7
a/b = 5 Gy 10.3 (8.0-13.7) 11.3 (8.1-13.7) 10.7 (8.4-14.2) 12.5 (9.8-16.6) 11.2
Table 5 Comparison of modelled and observed relative breast cancer risk for involved field radiotherapy
Technique Used Treament plans Weighting according to # treated
patients
Relative OED (Travis
fit)
Observed relative
risk
Mediastinal Mediastinal 109 1 1
Mantle Mantle field alone 637 3.2 2.7 (1.1-6.9)
other
Supradiaphragmatic
Supraclavicular/neck 34
Axillary + Mediastinal/
homolat
41
Axillary + Mediastinal/bilat 7
Axillary, no Media. 14
Total 96 1.9 0.9 (0.2-4.8)
Modelling was performed fora/b = 3Gy. Since OED is proportional to risk relative OED it can be compared to observed relative risk.
Schneider et al. Radiation Oncology 2011, 6:67
/>Page 6 of 7
breast varies between 10.5 and 29.4/10000PY. The
model was used to predict the impact of the reduction
of radiation volume on breast cancer risk. It was pre-
dicted that mantle field irradiation is associated with a
3.2-fold increased risk compared with mediastinal irr a-
diation alone. This is comparable to the findings of De
Bruin et al [18] who found a 2.7-fold increase.
It was also shown that the modelled age dependency of
breast cancer risk based on the A-bomb survivor data is in
satisfying agreement with published data on breast cancer
risk after radiotherapy of Hodgkin’s disease. The work pre-
sented here might provide the first direct evidence that
cancer risk age modelling based on the A-bomb survivor
data can be applied to radiotherapy patients.
The dose-response relationship obtained in this report
can be used for the predictio n of radiation induced sec-
ondary breast cancer of radiotherapy patients. It might
be used to further optimize radiation therapy of Hodg-
kin’ s disease w ith regard to second breast cancer. In
addition the obtained a-value for breast tissue can be
used for applications of the linear-quadratic model in
radiotherapy.
Acknowledgements
This study was supported in part financially by the European Commission
with ALLEGRO grant No. 231965.
Author details
1
Vetsuisse Faculty, University of Zürich, Winterthurerstrasse 260, 8057 Zürich,
Switzerland.
2
Institute for Radiotherapy, Hirslanden Hospital Zürich,
Witellikerstrasse 40, 8032 Zürich, Switzerland.
Authors’ contributions
US designed this study, performed the modelling, and drafted the
manuscript. MS and JR performed the treatment planning and the dose
reconstruction for the risk predictions. JB, AM and GG participated in the risk
predictions. All authors read and approved the final manuscript.
Competing interests
The authors declare that they have no competing interests.
Received: 23 March 2011 Accepted: 8 June 2011 Published: 8 June 2011
References
1. Schneider U, Zwahlen D, Ross D, et al: Estimation of radiation-induced
cancer from three-dimensional dose distributions: Concept of organ
equivalent dose. Int J Radiat Oncol Biol Phys 2005, 61(5):1510-5.
2. Sachs RK, Brenner DJ: Solid tumor risks after high doses of ionizing
radiation. Proc Natl Acad Sci USA 2005, 102(37):13040-5, 13.
3. Schneider U, Stipper A, Besserer J: Dose-response relationship for lung
cancer induction at radiotherapy dose. Z Med Phys 2010, 20(3):206-14.
4. Dörr W, Herrmann T: Second primary tumors after radiotherapy for
malignancies. Treatment-related parameters. Strahlenther Onkol 2002,
178(7):357-62.
5. Travis LB, Gospodarowicz M, Curtis RE, et al: Lung cancer following
chemotherapy and radiotherapy for Hodgkin’s disease. J Natl Cancer Inst
2002, 94(3):182-92.
6. Gilbert ES, Stovall M, Gospodarowicz M, et al: Lung cancer after treatment
for Hodgkin’s disease: focus on radiation effects. Radiat Res 2003,
159(2):161-73.
7. Diallo I, Haddy N, Adjadj E, et al: Frequency distribution of second solid
cancer locations in relation to the irradiated volume among 115
patients treated for childhood cancer. Int J Radiat Oncol Biol Phys 2009,
74(3):876-83.
8. Travis LB, Hill DA, Dores GM, et al: Breast cancer following radiotherapy
and chemotherapy among young women with Hodgkin disease. JAMA
2003, 290(4):465-75.
9. van Leeuwen FE, Klokman WJ, Stovall M, et al: Roles of radiation dose,
chemotherapy, and hormonal factors in breast cancer following
Hodgkin’s disease. J Natl Cancer Inst 2003, 95(13):971-80.
10. Inskip PD, Robison LL, Stovall M, Smith SA, Hammond S, Mertens AC,
Whitton JA, Diller L, Kenney L, Donaldson SS, Meadows AT, Neglia JP:
Radiation dose and breast cancer risk in the childhood cancer survivor
study. J Clin Oncol 2009, 27(24):3901-7.
11. Preston DL, Ron E, Tokuoka S, et al: Solid cancer incidence in atomic
bomb survivors: 1958-1998. Radiat Res 2007, 168(1):1-64.
12. Schneider U: Mechanistic model of radiation-induced cancer after
fractionated radiotherapy using the linear-quadratic formula. Med Phys
2009, 36(4):1138-43.
13. Hoppe RT: Radiation therapy in the management of Hodgkin’s disease.
Semin Oncol 1990, 17(6):704-15.
14. Hancock SL, Hoppe RT: Long-Term Complications of Treatment and
Causes of Mortality After Hodgkin’s Disease. Semin Radiat Oncol 1996,
6(3):225-242.
15. Swerdlow AJ, Barber JA, Hudson GV, et al: Risk of second malignancy after
Hodgkin’s disease in a collaborative British cohort: the relation to age at
treatment. J Clin Oncol 2000, 18(3):498-509.
16. Dores GM, Metayer C, Curtis RE, et al: Second malignant neoplasms
among long-term survivors of Hodgkin’s disease: a population-based
evaluation over 25 years. J Clin Oncol 2002, 20(16):3484-94.
17. van Leeuwen FE, Klokman WJ, Veer MB, et al: Long-term risk of second
malignancy in survivors of Hodgkin’s disease treated during
adolescence or young adulthood. J Clin Oncol 2000, 18(3):487-97.
18. De Bruin ML, Sparidans J, van’t Veer MB, et al: Breast cancer risk in female
survivors of Hodgkin’s lymphoma: lower risk after smaller radiation
volumes. J Clin Oncol 2009, 27(26):4239-46, 10.
19. Koh ES, Tran TH, Heydarian M, Sachs RK, Tsang RW, Brenner DJ, Pintilie M,
Xu T, Chung J, Paul N, Hodgson DC: A comparison of mantle versus
involved-field radiotherapy for Hodgkin’s lymphoma: reduction in
normal tissue dose and second cancer risk. Radiat Oncol 2007, 2:13.
doi:10.1186/1748-717X-6-67
Cite this article as: Schneider et al.: Dose-response relationship for
breast cancer induction at radiotherapy dose. Radiation Oncology 2011
6:67.
Figure 4 Plot of the modelled age dependence of the
standardized incidence ratio (normalised to the De Bruin data)
as the solid lines for the age at treatment groups <20, 21-30,
31-40 and 41-50, respectively. The corresponding epidemiological
data from De Bruin are plotted as the symbols together with the
corresponding 95% confidence interval.
Schneider et al. Radiation Oncology 2011, 6:67
/>Page 7 of 7