Báo cáo khoa học: "Survival rate in nasopharyngeal carcinoma improved by high caseload volume: a nationwide population-based study in Taiwan" docx
Bạn đang xem bản rút gọn của tài liệu. Xem và tải ngay bản đầy đủ của tài liệu tại đây (266.63 KB, 7 trang )
RESEARCH Open Access
Survival rate in nasopharyngeal carcinoma
improved by high caseload volume: a nationwide
population-based study in Taiwan
Ching-Chih Lee
1,6,7
, Tze-Ta Huang
2,6
, Moon-Sing Lee
3,6
, Yu-Chieh Su
4,6
, Pesus Chou
7
, Shih-Hsuan Hsiao
1,6
,
Wen-Yen Chiou
3,6
, Hon-Yi Lin
3,6
, Sou-Hsin Chien
5,6*
and Shih-Kai Hung
3,6*
Abstract
Background: Positive correlation between caseload and outcome has previously been validated for several
procedures and cancer treatments. However, there is no information linking caseload and outcome of
nasopharyngeal carcinoma (NPC) treatment. We used nationwide population-based da ta to examine the
association between physician case volume and survival rates of patients with NPC.
Methods: Between 1998 and 2000, a total of 1225 patients were identified from the Taiwan National Health
Insurance Research Database. Survival analysis, the Cox proportional hazards model, and propensity score were
used to assess the relationship between 10-year survival rates and physician caseloads.
Results: As the caseload of individual physicians increased, unadjusted 10-year survival rates increased (p < 0.001).
Using a Cox proportional hazard model, patients with NPC treated by high-volume physicians (case load ≥ 35) had
better survival rates (p = 0.001) after adjusting for comorbidities, hospital, and treatment modality. When analyzed
by propensity score, the adjusted 10-year survival rate differed significa ntly between patients treated by high-
volume physicians and patients treated by low/medium-volume physic ians (75% vs. 61%; p < 0.001).
Conclusions: Our data confirm a positive volume-outcome relationship for NPC. After adjusting for differences in
the case mix, our analysis found treatment of NPC by high-volume physicians improved 10-year survival rate.
Introduction
The fact that increased caseload is associated with better
patient outcomes has been noted for three decades in
many areas of health care, including acute myocardial
infar ction, many types of high-ri sk surgeries, and cancer
treatment [1,2]. The “practice makes perfect” hypothesis
may b e valid for certain procedures such as open-heart
and vascular surgery and “selective referral” may in part
account for this phenomenon [3,4]. However, such a
positive volume-outcome relationship is not well vali-
dated for other proc edures. Only a few studies have
examined the effect of physician caseload on treatment
outcome for head and neck cancers [5,6].
Taiwan has a high incidence of nasopharyngeal carci-
noma (NPC): the annual incidence rate is 6.17 per
100,000 as compared with < 1 per 100,000 in Western
countries [7]. Radiotherapy or concurrent chemora-
diotherapy (CCRT) is the principal treatment because
NPC is anatomically inaccessible and highly sensitive to
radiotherapy and chemotherapy [8].
Previous volume-outcome studies have shown
improved treatment outcome in breast cancer, oral can-
cer, esophageal cancer, radical prostatectomy, and
nephrectomy [5,9-11]. However, there is scant informa-
tion on the volume-outc ome relationship for NPC. The
purpose of this study was to examine the relationship
between physician caseload and survival rate in NPC
using population-based data.
In most previous studies on the association between
caseload and outcome, a Cox proportional hazards
model or logistic regression was routinely used, raising
* Correspondence: ;
3
Department of Radiation Oncology, Buddhist Dalin Tzu Chi General
Hospital, Chiayi, Taiwan
5
Division of Plastic Surgery, Department of Surgery, Buddhist Dalin Tzu Chi
General Hospital, Chiayi, Taiwan
Full list of author information is available at the end of the article
Lee et al. Radiation Oncology 2011, 6:92
/>© 2011 Lee et al; licensee BioMed Central Ltd. This is an Open Access article distributed under the terms of the Creative Commons
Attribution License ( which permits unrestricted use, distribution, and reproduction in
any medium, pro vided the original work is properly cited.
the possibility that selection bias might still exist. There-
fore,weevaluatedtheassociation between physician
caseload and s urviva l rate u sing population-based data,
Cox regression analysis, and propensity score to mini-
mize the effect of selection bias.
Patients and methods
The database contained a registry of contracted medical
facilities, a registry of board-certified physicians, and
monthly claims summary for all inpatient claims.
Because these were de-identified secondary data, this
study was exempt from full review by the i nternal
review board.
Patients and study design
We used data for the years 1998 to 2008 from the
National Health Insurance (NHI) Research Database,
which contains data on all covered medical benefit
claims for over 23 million people in Taiwan (approxi-
mately 97 percent of the island’s population).
All patients with NPC (International Classification of
Disease, Ninth Revision, Clinical Modification codes
147.0-147.9) who received curative treatment by radiother-
apy or chemoradiotherapy between the years 1998 and
2000 were included. Patients with unclear treatment mod-
ality and incomplete physician data or treated by physi-
cians with a very small caseload (less than 4 cases within 3
years) were excluded. Finally, 1225 patients treated by 98
radiation oncologist during this period were included.
Physicians were further sorted by their total patient
volume using the unique physician identifiers in this
database and by their caseload of NPC patients. The
volume category cutoff points (high, medium, and low)
were determined by sorting the 1225 patients into 3
groups of approximately equal size (4-16 cases [low],
17-34 cases [medium], and ≧35 cases [high]) as pre-
viously described [5,12,13].
These NPC patients were then linked to the death
data extracted from the re cords covering the years 1998
to 2008.
Measurements
The key dependent variable of interest was the 10-year
survival rate. The key independent variables were the
NPC caseloads (low, medium, or high). Other physician
characteristics included age (≦40, 41-50, ≧51 years) and
gender. Patient characteristics included age, gender, geo-
graphic location, treatment modality, severity of disease,
and enrollee category (EC). The disease severity in each
patient was assessed using the modified Charlson
Comorbidity Index score, which has been widely used in
recent years for risk adjustment in administrative claims
data sets [14].
ThisstudyusedECasaproxymeasureofsocioeco-
nomic status, which is an important prognostic factor
for cancer patients [15,16]. Patients with NPC were clas-
sified into 4 subgrou ps: EC 1 (civil servants, full-time or
regular paid personnel with a government affiliation),
EC 2 (employees of privately owned institutions), EC 3
(self-employed individuals, other employees, and mem-
bers of farmers’ or fishermen’s associations), and EC 4
(veterans, low-income families, and substitute service
draftees) [17].
The hospitals were categorized by ownership (public,
not-for-profit or for-profit), geographic location (North-
ern, Central , Southern, and Eastern Taiwan), and hospi-
tal type (medical center, regional hospital, and district
hospital).
Statistical analysis
The SAS statistical package (version 9.2; SAS Institute,
Inc., Cary, N.C.) and SPSS (version 15, SPSS Inc., Chi-
cago, IL, USA) were used for data analysis. A two- sided
value of p < 0.05 was used to determine statistical
significance.
The cumulative 10-year survival rates and the survival
curves of each group were compared by the log-rank
test. Survival was measured from the time of NPC diag-
nosis to the time of death. Cox proportional regression
model and su rvival analysis with propensit y score strati-
fication were used to compare outcomes between differ-
ent caseload size groups.
(1) Cox proportional hazards model The Cox propor-
tional regression model was used to evaluate the e ffect
of caseload on survival rate after adjusting for hospital
type, surgeon characteristics, and patient demographics.
(2) Propensity score Propensity analysis was used to
reduce the effect of selection bias on our hypothesis as
described by Rosenbaum and Rubin [18-20]. Propensity
score stratification replaces the many confounding fac-
tors that may be present in an observational study with
a variable of these factors. To calculate the propensity
score, patient characteristics in this study were entered
into a logistic regression model predicting selection for
high-volume surgeons. These characteristic s included
year in which the patient was diagnosed, age, gender,
Charlson Comorbidity Index score, geographic area of
residence, enrollee category, and treatment mo dality.
The study population was then divided into five discrete
strata on the basis of propensity score. The effect of
caseload assignment on 10-year survival rate was ana-
lyzed within each quintile. The Mantel-Haenszel odds
ratio was calculated in add ition to the Cochran-Mantel-
Haenszel c
2
statistic.
Results
A t otal of 423 patients (35%) died out of 1225 patients
who underwent curative treatment between 1998 and
2000. A total of 98 radiation oncologists were included.
The characteristics of the physicians and patients are
Lee et al. Radiation Oncology 2011, 6:92
/>Page 2 of 7
summarized in Tables 1 and 2. The majority of the
patients were male (72%). Patients in the high-vo lume
physician group were more likely to undergo radiother-
apy, reside in Northern Taiwan, have lower comorbidity
score, and better enrollee category than their counter-
parts in other groups. T here were 74 radiation oncolo-
gists (76%) in the low-volume group, 17 physicians
(17%) in the medium-volume group, and 7 (7%) physi-
cians in the high-volume group. The mean age of all
physicians was 40 ± 12 years. There was no significant
difference in age between these three caseload groups (p
= 0.507).
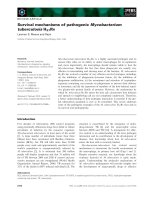
Analysis using a Cox proportional hazards model
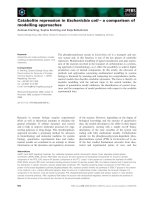
The 10-year survival rate, by physician caseload group,
is shown in Figure 1. The 10-year surv ival rates were
75%, 61%, and 60% for low-, medium-, and high-volume
surgeons, respectively (p <0.001).Table3showsthe
adjusted hazard ratios calculated usin g the Cox propor-
tional hazards regression model after adjusting for
patient comorbidities, hospital type, and treatment mod-
ality. The positive association between survival and phy-
sician caseload remained statistically significant in
multivariate analysis. Patients treated by high-volume
physicians had better survival rates (hazard ratio [HR] =
0.6; 95% confidence interval [CI], 0.45-0.78; p < 0.001)
after adjust other factors.
Analysis using propensity scores
Patients were stratified by propensity score and the
effect of physician caseload on survival was assessed.
The population was stratified into propensity quintiles
Table 1 Patient Characteristics in Different Caseload Groups (n = 1225)
NPC caseload group
Variable Low
(4-16)
(n = 424)
Medium
(17-34)
(n = 394)
High
(35-152)
(n = 407)
p
Age 0.037
35-44 years 136(32) 90(23) 103(25)
45-54 years 118(28) 143(36) 145(36)
55-64 years 93(22) 100(25) 99(24)
65-74 years 59(14) 51(13) 48(12)
≧ 75 years 18(4) 10(3) 12(3)
Gender 0.389
Male 316(75) 285(72) 286(70)
Female 108(25) 109(28) 121(30)
Charlson Comorbidity Index score < 0.001
< 4 216(51) 229(58) 274(67)
≧4 208(49) 165(42) 133(33)
Treatment modality < 0.001
Radiotherapy 278(66) 271(69) 322(79)
Chemoradiotherapy 146(34) 123(31) 85(21)
Geographic location < 0.001
North 266(63) 240(61) 317(78)
Central 93(22) 61(15) 43(11)
Southern and Eastern 65(15) 93(24) 47(11)
Enrollee category 0.008
EC 1-2 168(40) 133(34) 183(45)
EC 3 181(43) 172(44) 164(40)
EC 4 75(18) 89(23) 60(15)
Values are given as number (percentage).
Table 2 Physician Characteristics (n = 98)
Physician caseload group
Variable Low
(4-16)
Medium
(17-34)
High
(35-152)
p
Total no. physicians 74 17 7
Age(year) 0.507
Mean ± SD 39 ± 13 39 ± 11 45 ± 13
Gender 0.832
Male 65(88) 14(82) 6(86)
Female 9(12) 3(18) 1(14)
Caseload < 0.001
Mean ± SD 6 ± 5 24 ± 6 62 ± 45
Values are given as number (percentage).
Abbreviations: SD = standard deviation.
Lee et al. Radiation Oncology 2011, 6:92
/>Page 3 of 7
as previously descri bed. Table 4 shows survival rates for
both caseload groups after stratification. The percentage
of patients treated by low/medium-volume physicians
decreased from the first pr opensity quintile to the fifth
as predicted by the propensity model. In each of the five
strata, patients treated by high-v olume phys icians had a
higher 10-year survival rate. The p value for the
Cochran-Mantel-Haenszel statistic for the difference in
survival between pa tients treated by low/medium- and
high-volume physicians, while controlling for pr opensity
score, was < 0.001, with fewer patients dying who were
treated by high-volume physicians (adjusted odds ratio
= 0.54, 95% CI, 0.41-0.7). The adjusted 10-year survival
rates for low/medium- and high-volume physicians were
61% and 75% (p < 0.001).
In summary, NPC patients treated by high-volume
physicians had better survival. The robustness of this
result was demonstrated by two different multivariate
analyses, the Cox proportional regression model and
stratification by propensity score.
Discussion
Using a Cox proportion al hazards model and propensity
score, the relative benefit of treatment by high-volume
physicians over low/medium-volume physicians was
evaluated in NPC. After controlling for patient charac-
teristics and other variables in the Cox proportional
regression model, the adjusted hazard ratio was 0.6 for
Table 3 Nasopharyngeal Carcinoma Survival Rate and
Adjusted Hazard Ratios by Physician Caseload Groups
and the Characteristics of the Patients and Providers (n =
1225)
Variable Adjusted hazard
ratio
95% CI p
Physician characteristics
Physician volume
Low (3-17) 1
Medium (17-53) 0.884 0.70-1.16 0.884
High (54-130) 0.60 0.45-0.78 <
0.001
Physician age
≦40 years 1
41-50 years 1.22 0.97-1.52 0.086
≥51 years 0.78 0.59-1.02 0.073
Hospital characteristics
Hospital ownership
Public 1
Non-for-profit 1.11 0.87-1.42 0.414
For-profit 0.94 0.65-1.36 0.746
Hospital level
Medical center 1
Regional hospital 0.88 0.68-1.16 0.368
District hospital 1.25 0.77-2.03 0.376
Patient characteristics
Patient gender
Female 1
Male 0.93 0.75-1.15 0.509
Patient age
35-44 years 1
45-54 years 1.15 0.89-1.49 0.277
55-64 years 1.10 0.83-1.45 0.507
65-74 years 1.12 0.81-1.56 0.488
≧ 75 years 0.88 0.48-1.51 0.675
Charlson Comorbidity
Index score
<4 1
≧4 1.28 1.04-1.56 0.018
Treatment modality
Radiotherapy 1
Chemoradiotherapy 1.03 0.82-1.29 0.784
Geographic location
North 1
Central 1.18 0.90-1.55 0.242
Southern and
Eastern
1.30 1.00-1.70 0.051
Enrollee category
EC 1-2 1
EC 3 1.35 0.71-2.55 0.358
EC 4 1.04 0.86-1.26 0.698
95% CI, 95% confidence interval.
Figure 1 Nasopharyngeal carcinoma survival rates by physician
caseload.
Lee et al. Radiation Oncology 2011, 6:92
/>Page 4 of 7
high-volume physicians, indicating that patients with
NPC treated by high-volume physicians had a lower risk
of death and were more likely to live longer. When ana-
lyzed by propen sity score, the adjusted 10-ye ar survival
rate was 75% for patients treated by high-volume physi-
cians and 61% for patie nts treated by low/medium-
volume physicia ns. Moreover, fewer patients treated by
high-volume physicians died. The results of both forms
of analyses led to the conclusion that the 10-year survi-
val rates for patients with NPC treated by high-volume
physicians were significantly better.
Previous studies have evaluated the b enefits of high
hospital and physician volume on the outcomes of can-
cer treatment. In head and neck cancer, Lin et al.
reported that physician volume (not hospital volume)
was associated with oral cancer survival rates [5]. In our
series, we also found a better 10-year survival rate asso-
ciated with treatment by high-volume physicians.
The quality of the risk-adjustment technique in ana-
lyzing administrative information is an important issue.
In the first part of this study, a Cox proportional hazard
model was used to co mpare the effects of high volume
versus low/medium volume on survival rate. We found
treatment by high-volume physicians was significantly
associated with lower adjusted hazard ratio for death.
Patients treated by high-vol ume physicians were found
tohavea40%lowerriskofdeath after adjusting for
comorbidities and other confounding factors. However,
there was some difference in age and clinical condition
between caseload groups. In the second part of our ser-
ies, propensity score was used to stratify patients into
five strata with similar propensity score in order to
reduce the effect of selection bias on caseload groups
[19-21]. Patients treated by high-volume physicians were
found to have a 14% relative improvement in adjusted
10-year survival rate (p < 0.001).
Although NPC patients may be followed up i n a team
consisting of otolaryngologist, radiation oncologists,
hematology oncologists, and radiologists, the corner-
stone of treatment of NPC relied on the successful
eradication of disease by radiotherapy. In order to
expl ore the caseload effect of radiothera py on NPC sur-
vival, we calculated the caseload volume of radiation
oncologists. In agreement with previous volume-out-
come studies, our results indicated that increa sed case-
load of radiation oncologists is associated with improved
outcomes after other factors.
Several hypotheses relating to the volume-outcome
relationship have been proposed. The “ practice makes
perfect” concept suggests that incre ased caseload may
help physicians or hospital staff improve the execution
of treatment procedures, suc h as planning the radiation
field and manipulation of the radioactive source of tele-
therapy units. The role of surgery in the treatment of
NPC is limited, and carefully defining the planning tar-
get volume with the aid of CT or MRI i mages is impor-
tant for radiotherapy or concurrent chemoradiotherapy
in NPC. A high-volume team may be more adept at
administering a radiation dose, with or without a boos-
ter dose, that balance s the benefit of successful loco-
regional control against the risk of radiation toxicity.
Previous study reported that high-volume physicians
use effective treatment and strategies more often than
do low-volume physicians [22]. In breast cancer series,
high-volume surgeons adopted a multi-disciplinary
approach whereas low-volume surgeons were less likely
to interact with oncologists or attend multi-disciplinary
meetings [23]. Use of multidisciplinary approaches may
account for the better outcomes achieved by high-
volume physicians. Possibly, low-volume physicians do
not always follow the international guidelines for NPC
treatment.
The “selective referral hypothesis” postulates that heal-
thier patients or patients with early-stage disease tend to
be referred to high-volume physicians. The referral sys-
tem in T aiwan is weakly e nforced, and people are free
to choose any phy sician. Because official performance
information to help consumers select healthcare provi-
ders is not available, patients choose physicians with
better reputations or more successful physicians after
Table 4 10-year survival of NPC patients in different propensity score strata; low/medium-volume vs. high-volume
physicians
a
Propensity score stratum Low/medium-volume physician group High-volume physician group p
No. % of stratum Survival rate (%) No. % of stratum Survival rate (%)
1 193 79 56 51 21 75 0.004
2 191 78 59 52 22 74 0.029
3 173 70 57 74 30 75 0.013
4 145 58 64 104 42 76 0.021
5 116 48 69 126 52 76 0.28
Total 818 61 407 33 75 < 0.001
a. Stratum 1 had the strongest propensity for low/medium physicians; stratum 5, for high-volume physicians.
b. Conchran-Mantel-Haenszel statistics; adjusted odds ratio = 0.54, 95% confidence interval = 0.41-0.70.
Lee et al. Radiation Oncology 2011, 6:92
/>Page 5 of 7
consulting with their relatives and friends [4]. Selective
referral bias may also result from the referral of more
curable patients to high-volume physicians. Patients not
seeking curative treatment or for whom curative treat-
ment is not possible may continue to receive their care
from low-volume physicians.
Our study revealed some i ssues that may be useful for
policy makers. Research is needed to ident ify the differ-
ences in care and treatment strategy between low-, med-
ium-, and high-volume physicians. In our study, nearly
33% of patients were treated by 7 high-volume radiation
oncologists. The viewpoints of high-volume physicians
may influence the development of effective protocols
and practice guidelines for the majority of clinical situa-
tions. The t reatment strategies of high-volume physi-
cians should be analyzed and adopted throughout the
country to improve survival rates.
Our study has several limitations. First, we could not
assess the relation ship of caseload to NPC stage because
this information was not available from the database.
However, Begg et al., using a SEER-Medicare linked
database, reported that cancer stage and patient age
were independent of caseload volume [24]. Instead of
cancer-specific survival rates, overall survival rate was
used, because it was not possible t o determine cause-
specific mortality based on the registry data. Previous
study by Roohan et al. showed no significant difference
between survival models for all-cause mort ality and
breast cancer mortality [25]. Given the rob ustness of the
evidence and statistical analysis in this study, these lim-
itations are unlikely to compromise our results.
In summary, our findings support the conclusion that
provider volume affects survival outcome in NPC. Ana-
lysis using a Cox proportional hazard model and pro-
pensity score found an association between high-volume
physicians and improved 10-year survival rate in
patients with NPC. Analysis of the treatment strategies
adopted by high-volume physicians may improve overall
survival rate.
Conflict of interest
The authors declare that they have no competing
interests.
Acknowledgements
This study is based in part on data from the National Health Insurance
Research Database provided by the Bureau of National Health Insurance,
Department of Health and managed by the National Health Research
Institutes (Registry number 99018). The interpretation and conclusions
contained herein do not represent those of the Bureau of National Health
Insurance, Department of Health, or National Health Research Institutes.
Author details
1
Department of Otolaryngology, Buddhist Dalin Tzu Chi General Hospital,
Chiayi, Taiwan.
2
Department of Oral and Maxillofacial Surgery, Buddhist Dalin
Tzu Chi General Hospital, Chiayi, Taiwan.
3
Department of Radiation
Oncology, Buddhist Dalin Tzu Chi General Hospital, Chiayi, Taiwan.
4
Department of Hematology Oncology, Buddhist Dalin Tzu Chi General
Hospital, Chiayi, Taiwan.
5
Division of Plastic Surgery, Department of Surgery,
Buddhist Dalin Tzu Chi General Hospital, Chiayi, Taiwan.
6
School of Medicine,
Tzu Chi University, Hualien, Taiwan.
7
Community Medicine Research Center
and Institute of Public Health, National Yang-Ming University, Taipei, Taiwan.
Authors’ contributions
LCC, CSH and HSK developed the ideas for these studies, performed much
of the work, and drafted the manuscript. CSH, CP, LCC, HTT and HSK revised
the manuscript. LMS, SYC, CP, CWY and LHY designed the study, managed
and interpreted the data. LCC performed the statistical analysis. All authors
read and approved the final manuscript.
Received: 27 February 2011 Accepted: 11 August 2011
Published: 11 August 2011
References
1. Luft HS, Bunker JP, Enthoven AC: Should operations be regionalized? The
empirical relation between surgical volume and mortality. N Engl J Med
1979, 301:1364-1369.
2. Halm EA, Lee C, Chassin MR: Is volume related to outcome in health
care? A systematic review and methodologic critique of the literature.
Ann Intern Med 2002, 137:511-520.
3. Luft Harold S, Hunt Sandra S, Maerki SC: The volume-outcome
relationship: practice-makes-perfect or selective-referral patterns? Health
Serv Res 1987, 22:157-582.
4. Cheng SH, Song HY: Physician performance information and consumer
choice: a survey of subjects with the freedom to choose between
doctors. Qual Saf Health Care 2004, 13:98-101.
5. Lin CC, Lin HC: Effects of surgeon and hospital volume on 5-year survival
rates following oral cancer resections: the experience of an Asian
country. Surgery 2008, 143:343-351.
6. Lin CS, Lee HC, Lin CT, Lin HC: The association between surgeon case
volume and hospitalization costs in free flap oral cancer reconstruction
operations. Plast Reconstr Surg 2008, 122:133-139.
7. Department of Health: The Executive Yuan: Cancer registry annual report.
Republic of China 2004.
8. Al-Sarraf M, LeBlanc M, Giri PG, Fu KK, Cooper J, Vuong T, Forastiere AA,
Adams G, Sakr WA, Schuller DE, Ensley JF: Chemoradiotherapy versus
radiotherapy in patients with advanced nasopharyngeal cancer: phase III
randomized Intergroup study 0099. J Clin Oncol 1998, 16:1310-1317.
9. Begg CB, Riedel ER, Bach PB, Kattan MW, Schrag D, Warren JL, Scardino PT:
Variations in morbidity after radical prostatectomy. N Engl J Med 2002,
346:1138-1144.
10. Begg CB, Cramer LD, Hoskins WJ, Brennan MF: Impact of hospital volume
on operative mortality for major cancer surgery. JAMA 1998,
280:1747-1751.
11. Sosa JA, Bowman HM, Gordon TA, Bass EB, Yeo CJ, Lillemoe KD, Pitt HA,
Tielsch JM, Cameron JL: Importance of hospital volume in the overall
management of pancreatic cancer. Ann Surg 1998, 228:429-438.
12. Laks MP, Cohen T, Hack R: Volume of procedures at transplantation
centers and mortality after liver transplantation. N Engl J Med 2000,
342:1527.
13. Goodney PP, Stukel TA, Lucas FL, Finlayson EV, Birkmeyer JD: Hospital
volume, length of stay, and readmission rates in high-risk surgery. Ann
Surg 2003, 238:161-167.
14. Deyo RA, Cherkin DC, Ciol MA: Adapting a clinical comorbidity index for
use with ICD-9-CM administrative databases. J Clin Epidemiol 1992,
45:613-619.
15. Braaten T, Weiderpass E, Lund E:
Socioeconomic differences in cancer
survival:
the Norwegian Women and Cancer Study. BMC Public Health
2009, 9:178.
16. Kwok J, Langevin SM, Argiris A, Grandis JR, Gooding WE, Taioli E: The
impact of health insurance status on the survival of patients with head
and neck cancer. Cancer 2010, 116:476-485.
17. Chen CY, Liu CY, Su WC, Huang SL, Lin KM: Factors associated with the
diagnosis of neurodevelopmental disorders: a population-based
longitudinal study. Pediatrics 2007, 119:435-443.
18. Joffe MM, Rosenbaum PR: Invited commentary: propensity scores. Am J
Epidemiol 1999, 150:327-333.
Lee et al. Radiation Oncology 2011, 6:92
/>Page 6 of 7
19. Rubin DB: Tasks in statistical inference for studying variation in
medicine. Med Care 1993, 31:YS103-110.
20. Rubin DB: Estimating causal effects from large data sets using propensity
scores. Ann Intern Med 1997, 127:757-763.
21. D’Agostino RB Jr: Propensity score methods for bias reduction in the
comparison of a treatment to a non-randomized control group. Stat Med
1998, 17:2265-2281.
22. Thiemann DR, Coresh J, Oetgen WJ, Powe NR: The association between
hospital volume and survival after acute myocardial infarction in elderly
patients. N Engl J Med 1999, 340:1640-1648.
23. Stefoski Mikeljevic J, Haward RA, Johnston C, Sainsbury R, Forman D:
Surgeon workload and survival from breast cancer. Br J Cancer 2003,
89:487-491.
24. Begg CB, Cramer LD, Hoskins WJ, Brennan MF: Impact of hospital volume
on operative mortality for major cancer surgery. JAMA 1998,
280:1747-1751.
25. Roohan PJ, Bickell NA, Baptiste MS, Therriault GD, Ferrara EP, Siu AL:
Hospital volume differences and five-year survival from breast cancer.
Am J Public Health 1998, 88:454-457.
doi:10.1186/1748-717X-6-92
Cite this article as: Lee et al.: Survival rate in nasopharyngeal carcinoma
improved by high caseload volume: a nationwide population-based
study in Taiwan. Radiation Oncology 2011 6:92.
Submit your next manuscript to BioMed Central
and take full advantage of:
• Convenient online submission
• Thorough peer review
• No space constraints or color figure charges
• Immediate publication on acceptance
• Inclusion in PubMed, CAS, Scopus and Google Scholar
• Research which is freely available for redistribution
Submit your manuscript at
www.biomedcentral.com/submit
Lee et al. Radiation Oncology 2011, 6:92
/>Page 7 of 7