Báo cáo khoa học: "Technology Assessment of Automated Atlas Based Segmentation in Prostate Bed Contouring" pptx
Bạn đang xem bản rút gọn của tài liệu. Xem và tải ngay bản đầy đủ của tài liệu tại đây (443.06 KB, 9 trang )
RESEARCH Open Access
Technology Assessment of Automated Atlas
Based Segmentation in Prostate Bed Contouring
Jeremiah Hwee
1
, Alexander V Louie
2
, Stewart Gaede
3
, Glenn Bauman
2
, David D’Souza
2
, Tracy Sexton
2
,
Michael Lock
2
, Belal Ahmad
2
and George Rodrigues
1,2*
Abstract
Background: Prostate bed (PB) contouring is time consuming and associated with inter-observer variability. We
evaluated an automated atlas-based segmentation (AABS) engine in its potential to reduce contouring time and
inter-observer variability.
Methods: An atlas builder (AB) manually contoured the prostate bed, rectum, left femoral head (LFH), right femoral
head (RFH), bladder, and penile bulb of 75 post-prostatectomy cases to create an atlas according to the recent
RTOG guidelines. 5 other Radiation Oncologists (RO) and the AABS contoured 5 new cases. A STAPLE contour for
each of the 5 patients was generated. All contours were anonymized and sent back to the 5 RO to be edited as
clinically necessary. All contouring times were recorded. The dice similarity coefficient (DSC) was used to evaluate
the unedited- and edited- AABS and inter-observer variability among the RO. Descriptive statistics, paired t-tests
and a Pearson correlation were performed. ANOVA analysis using logit transformations of DSC values was
calculated to assess inter-observer variability.
Results: The mean time for manual contours and AABS was 17.5- and 14.1 minutes respectively (p = 0.003). The
DSC results (mean, SD) for the comparison of the unedited-AA BS versus STAPLE contours for the PB (0.48, 0.17),
bladder (0.67, 0.19), LFH (0.92, 0.01), RFH (0.92, 0.01), penile bulb (0.33, 0.25) and rectum (0.59, 0.11). The DSC results
(mean, SD) for the comparison of the edited-AABS ve rsus STAPLE contours for the PB (0.67, 0.19), bladder (0.88,
0.13), LFH (0.93, 0.01), RFH (0.92, 0.01), penile bulb (0.54, 0.21) and rectum (0.78, 0.12). The DSC results (mean, SD)
for the comparison of the edited-AABS versus the expert panel for the PB (0.47, 0.16), bladder (0.67, 0.18), LFH (0.83,
0.18), RFH (0.83, 0.17), penile bulb (0.31, 0.23) and rectum (0.58, 0.09). The DSC results (mean, SD) for the
comparison of the STAPLE contours and the 5 RO are PB (0.78, 0.15), bladder (0.96, 0.02), left femoral head (0.87,
0.19), right femoral head (0.87, 0.19), penile bulb (0.70, 0.17) and the rectum (0.89, 0.06). The ANOVA analysis
suggests inter-observer variability among at least one of the 5 RO (p value = 0.002).
Conclusion: The AABS tool results in a time savings, and when used to generate auto-contours for the femoral
heads, bladder and rectum had superior to good spatial overlap. However, the generated auto-contours for the
prostate bed and penil e bulb need improvement.
Keywords: radiotherapy, prostate bed, contouring, target volume delineation, contouring atlas
* Correspondence:
1
Department of Epidemiology and Biostatistics, University of Western
Ontario, London, Ontario, Canada
Full list of author information is available at the end of the article
Hwee et al. Radiation Oncology 2011, 6:110
/>© 2011 Hwee et al; licensee BioMed Central Ltd. This is an Open Access article distributed u nder the terms of the Creative Commons
Attribution License ( which permits unre stricted use, distri bution, and reproduction in
any medium, provided the original work is pro perly cited.
Background
Radiotherapy as an adjunct to radical prostatectomy for
prostate cancer with adverse features such as pT3 and
margin positive disease has established benefits of
reduced disease recurrence and improved clinical out-
comes [1]. Increasingly, prostate bed radiotherapy is
being delivered with intensity modulated radiotherapy
(IMRT) and/or image-guided radiotherapy (IGRT)
which have both facilitated dose escalation to target
tissues while sparing adjacent normal structures. This
has improved the therapeutic ratio. However, these
advanced technologies require the radiation oncologist
to have a comprehensive understanding of cross sec-
tional anatomy as compared to conventionally planned
treatment (based on skeletal landmarks) for the accurate
delineation and dose coverage of target volu mes and
organs at risk (OARs) [2]. Inadequate coverage of the
prostate bed has been demonstrated to lead to an
increased risk of local recurrence [3].
Significant levels of inter- and intra-observer variabil-
ity in target volume delineation (TVD) has been repeat-
edly demonstrated in prostate cancer radi otherapy [4-7].
In fact, it has been argued that inter-observer TVD
variability is the most significant contributor to uncer-
tainty in radiation treatment planning [8]. A recent
development in Radiation Oncology is the use of auto-
mated atlas-based segmentation (AABS) algorithms to
aid in TVD. AABS is a computer-assiste d tool that uti-
lizes an algorithm th at resamples local data to automati-
cally outline the structures of interest to be irradiated.
AABS algorithms have the potent ial to address the
variability and time-intensive problems associated with
manual contouring.
As with most technologies that are rapidly being
introduced into Radiation Oncology practice, the evalua-
tion of AABS in the form of tra ditional clinical trials
can be costly and is likely unfeasible [9]. The purpose of
this paper is to evaluate the accuracy, reliability and
potential time-savings of an AABS. Secondly, we
assessed inter- and intra-observer variability in the deli-
neation of the post-prostatectomy clinical target volume
(CTV) (prostate bed) and relevant organs at risk
(OARs).
Methods
Eighty post-prostat ectomy patients planned for adjuvan t
or salvage radiotherapy from January to December 2009
were randomly selected as part of this University of
Western Ontario Research Ethics Board approved study.
All patients were scanned in the supine position, from
L4 to the ischial tuberosities. The computed tomography
(CT) images were saved according to the Digital Ima-
ging and Communications in Medicine (DICOM) stan-
dards of practice. For all three stages of this protocol,
physicians were asked to contour the prostate bed and
OARs (bladder, rectum, penile bulb, bilateral femora)
according to the recently published Radiation Therapy
Oncology Group (RTOG) guidelines for post-prostatect-
omy radiotherapy [2].
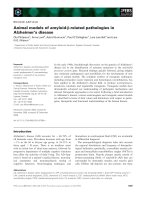
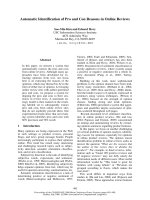
In the first stage of the protocol (Figure 1), 75 patients
were randomly selected to be the sample for the atlas
building process. A mu lti-atlas segmentation approach
was utilized (MIM Version 5. 2, MIMVista Corp, Cleve-
land, Ohio) as opposed to a single-atlas segmentation
approach . In a single atlas approach, only one patient is
inserted into the atlas and therefore the algorithm
extracts information from one subject to generate the
automated contour. In a multi-atlas method, a database
of pre-contoured medical images is scanned to select
the most similar atlas subject based on the shape of the
specified anatomical sites. Multi-atlas methods are typi-
cally used over the single atlas approach because of the
improved ability to account for the large variability of
anatomical regions among patients [10].
The atlas builder (GR) manually contoured an index
case and inserted the contoured CT image into the
atlas. A second patient was randomly selected to have
the MIM atlas-based segmentation engine generate an
automated contour. Since the index case was the only
possible match in the atlas, the algorithm selected the
index case as t he best match. The pre-contoured CT
image is then deformably registered onto the patient’s
empty CT image. The atlas pre-contoured CTV and the
five OARs were warped and transformed onto the CT
to create a tailored automated contour. The elapsed
time f or these first three steps was recorded. The auto-
contour for the prostate bed, bladder, left and right
femoral head, penile bulb and rectum was edited by th e
atlas builder according to the RTOG guidelines. The
time required to edit the CTV and each of the five
OARs was recorded. The final contours were then
added to t he atlas database, totaling two atlas subjects.
The atlas builder repeated these steps for the remaining
73 patients that were selected at random. Once the atlas
was completed, a second investigator (AVL) audited the
final contours to ensure all contours complied with the
RTOG consensus guidelines for the delineation of the
prostate bed. Thus at the completion of stage I, the
AABS engine had 75 reference cases with RTOG com-
pliant segmentation for the generation of automated
contours in stages II and III.
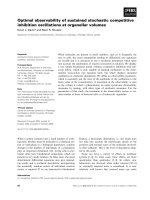
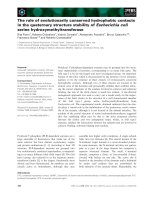
In stage two of the protocol (Figure 2), five Genitour-
inary Radiation Oncologists that routinely delineate
prostate bed cases at our institution (institutional
“expert panel”) contoured the remaining 5 cases. Each
member from th e expert panel was instructed to deline-
ate according to the RTOG guidelines and to record the
total conto uring time from de novo to completion.
Hwee et al. Radiation Oncology 2011, 6:110
/>Page 2 of 9
Enrollment, N = 75 Patient
Index Patient, n = 1
Input Into Atlas
N = n+1
Atlas Builder (AB) Manually Contours n = 1
According to RTOG Guidelines
Automated Atlas Deformable
Segmentations of Patients n+1
AB Edits Auto-Contours of
Patients n+1
Computational Time
Manual Contouring Time
RTOG Compliant Atlas is audited by
a Radiation Oncology
Professional
Figure 1 Stage I-Atlas Building Process Map.
Enrollment = 5 New Patients
Expert Panel (5 Radiation Oncologists) and the
Atlas Builder Manually Contour the 5 Patients
STAPLE Contours are Created Using the Contours
from the Expert Panel
Auto-Contours are Generated for the 5
Patients
Computational Time
Dice Similarity Coefficient
Manual Contouring Time
Figure 2 Stage II-Assessment of the automated atlas-based segmentations and inter-observer variability.
Hwee et al. Radiation Oncology 2011, 6:110
/>Page 3 of 9
OARs were pre-labeled on the Philips Pinnacle planning
system with a fixed zoom and a standardized window/
level setting was applied to decrease the chance of bias
and incorrect contouring. Data were gathered from the
expert panel to create the simultaneous truth and per-
formance level estimation (STAPLE) contours for each
prostate bed CTV and OAR. STAPLE is an expected
maximization algorithm that computes a probabilistic
estimate of the true segmentation by weighin g each seg-
mentation on i ts estimated performa nce level and can
be used to generate reference ("gold standard”)orcon-
sensus volumes among multi-observer datasets for com-
parison purposes where a true gold standard may be
difficult or impossible to define o therwise [11]. In paral-
lel with creating STAPLE contours, AABS were gener-
ated for the prostate bed CTV and the five OARs in the
remaining five patients. Inter-observer variability
(see statistical analysis below) was assessed and
baseline measurements were established to assess intra-
observer variability for the third and final stage of this
investigation.
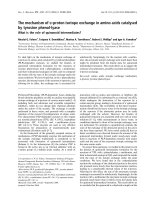
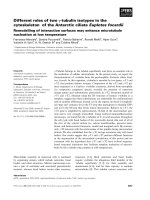
In stage three of t his protocol (Figure 3), a set of 20
anonymized contours consisting of a strategic sample of
the physician’s own, the atlas builder’s, AABS, and STA-
PLE contours (gathered from stage two) were sent to
each member of the expert panel for review four weeks
after the completion of stage two. They were each
instructed to 1) identify the source of each contour
(own, other physician, STAPLE, AABS), 2) determine if
the c ontours were clinically acceptable o r unacceptable,
and 3) record the time required to edit the contours.
Statistical Analysis
The SAS (SAS Institute I nc, North Carolina, USA) and
StructSure (Standard Imaging Inc, Wisconsin, USA)
were used to perform all the statistical analyses. The
dice similarity coefficient (DSC) is a simple spatial over-
lap index that is defined as:
(
V
1
,V
2
)
=2
V
1
∩ V
2
/
V
1
|
+
|
V
2
where V
1
and V
2
represent the volumes of the first
and the second contours respectively and ∩ is the inter-
section. As the DSC in contouring studies generally do
not f ollow a normal distribution, a logit transformation
was performed to allow for appropriate statistical
inferences.
Statistical Analysis Stage One: Atlas Building
Descriptive statistics and Pearson correlation coefficients
were calculated to explore the performance and effi-
ciency of the AABS tool (DSC and contour generation
time as a function of number of patients in the atlas).
The calculated DSC compared the initial, unedited-
AABS to the version edited by the atlas builder to gain
Stage 2 Contours
Contours by:
AB
, MD
1
,
MIM, STAPLE
Contours by:
AB
, MD
2
,
MIM, STAPLE
Contours by:
AB
, MD
3
,
MIM, STAPLE
Contours by:
AB
, MD
4
,
MIM, STAPLE
Contours by:
AB
, MD
5
,
MIM, STAPLE
MD
1
MD
2
MD
3
MD
4
MD
5
MDs Individually Evaluate and Edit Their Respective Datasets
Clinically Acceptable = Yes or No
Identify Contour Creator =
Own, Other Radiation Oncologist, Non-
Human
or Unknown
Computational Time
Dice Similarity Coefficient
Manual Contouring Time
Figure 3 Stage III: Validation of the automated atlas-based segmentation process.
Hwee et al. Radiation Oncology 2011, 6:110
/>Page 4 of 9
insights on the performance of the AABS. One-way
quintile ANOVA assessed the contouring time in rela-
tion to the number of patients in the atlas. Shapiro-
Wilk test for normal distribution was performed on the
calculated DSC. Quintile ANOVA using logit(DSC)
ass essed the performance of the AABS engine to gener-
ate R TOG compliant segmentations for every 15
patients added to the atlas. Bonferroni correction
was u sed to adjust for m ultiplicity in the quintil e
comparisons.
Statistical Analysis Stage Two: Assessment of the AABS
and Inter-observer Variability
The DSC was calculated t o compare the AABS, expert
panel members ("observers” ) and the atlas builder.
Descripti ve statistics were calculated to illustrate overall
inter-observer variability. Shapiro-Wilk test for normal
distribution was performed on the calculated DSC. One-
way analysis of variance was performed using logit(DSC)
to test for inter-observer variability in the delineation of
the CTV and five OARs among the expert panel. Two-
way analysis of variance was performed modeling the
effects of the observer and patient on logit(DSC) values
for the CTV and five OARs, and the effects of the
observer and patient on the contouring time.
Statistical Analysis Stage Three: Validation of the
Automated Atlas-Based Segmentations
The DSC was calculat ed for a number of spatial overlap
comparisons to determine th e convergence of the ed ited
automated contours towards the gold stand ard and
intra-observer variability in the delineation of the CTV
and five OARs. Descriptive statistics was calculated to
describe the performance of the AABS engine using
DSC and the total contouring time for hu man observers
and non-human raters. A paired t-test was performed to
assess differences in the time required to edit the auto-
contours and the de novo manual contouring time.
Attempts to Minimize Bias
Four measures were taken to minimize bias. The first
attempt to eliminate bias occurred at the construction
of the RTOG atlas stage through the appraisal of the
edited contours by a second radiation oncology expert
to ensure compliance. Calculati ng the DSC between the
atlas builder and STAPLE generated consensus contours
at stage two to evalua te the appropriateness of that par-
ticular radiation o ncologist as the atlas builder was the
second attempt to minimize bias. Sending the expert
panel the anonymized blinded dataset to be assessed in
stage three was used as another attempt to minimize
bias. In stage three the expert panel was blinded as to
thesourceofthecontoursinassessing intra-observer
variability to hopefully prevent any bias the expert panel
may have had if they knew the creator of the contour.
Finally, waiting four weeks after the expert panel fin-
ished stage two before sending the anonymized data set
to the exper t panel to be reviewed was designed to pre-
vent the members from recalling their own contours.
Results
Stage I
In stage one, generating AABS for the 75 patients took
an average of 108 seconds per patien t (standard devia-
tion, SD = 25 seconds, range 68 to 200 seconds).
ANOVA suggested no improvements in auto-contouring
time as the number of subjects increased in the atlas (p
value = 0.28). The mean (SD) for the auto-contouring
time for qui ntile 1, 2, 3, 4, and 5 were 103 (37), 97 (11),
109 (27), 114 (23) and 115 (22) seconds, respectively (p
= 0.282 between quintiles).
The mean (SD) time for the atlas builder to ed it the
automated contours were: 154 seconds (71 seconds) for
the prostate bed, 156 seconds (79 seconds) for the blad-
der, 125 seconds (80 seconds) for the left femoral head,
97 seconds (61 seconds) for the right femoral head, 19
seconds (9 seconds) for the penile bulb and 149 seconds
(65 seconds) for the rectum. The DSC was ca lculated to
compare the edited auto-contours by the atlas builder to
the initial auto-contours generated by the AABS tool.
The mean (SD) DSC for the CTV and the OARs was
0.65 (0.16) fo r the prostate bed, 0.73 (0.18) for the blad-
der, 0.95 (0.04) for the left femoral head, 0.96 (0.04) for
the right femoral head, 0.60 (0.28) for the penile bulb
and 0.68 (0.13) for the rectum. Table 1 i llustrates the
Table 1 The ability of the automated atlas-based
segmentation tool to generate segmentations compliant
with the consensus guidelines as more subjects are
added to the atlas
Variables Quintile
1
Quintile
2
Quintile
3
Quintile
4
Quintile
5
DSC mean
(SD)
Prostate Bed 0.63
(0.13)
0.64
(0.20)
0.63
(0.17)
0.71
(0.13)
0.66
(0.16)
Bladder 0.58
(0.15)
0.75
(0.16)
0.74
(0.20)
0.84
(0.10)
0.72
(0.17)
LFH 0.90
(0.07)
0.96
(0.02)
0.96
(0.02)
0.97
(0.02)
0.97
(0.02)
RFH 0.93
(0.04)
0.94
(0.04)
0.97
(0.01)
0.97
(0.01)
0.96
(0.04)
Penile Bulb 0.37
(0.39)
0.65
(0.23)
0.60
(0.27)
0.72
(0.13)
0.64
(0.23)
Rectum 0.62
(0.12)
0.72
(0.15)
0.66
(0.15)
0.71
(0.13)
0.68
(0.11)
DSC = dice similarity coefficient.
SD = standard deviation.
LFH = left femoral head.
RFH = right fem oral head.
Hwee et al. Radiation Oncology 2011, 6:110
/>Page 5 of 9
descriptive statistics for the quintile analysis (n = 15 per
group) for every 15 patients added to the atlas for each
OAR and the CTV to evaluate the performance of the
AABS as more subjects are added.
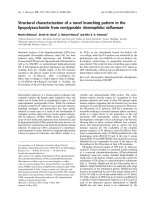
Stage II
In stage two, five new subjects were used to test the
performance of the atlas and inter-observer variability
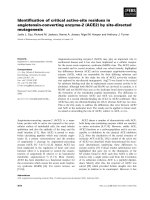
(Figure 4). Table 2 illustrates the DSCs evaluating the
MIM generated auto-contours against STAPLE (esti-
mated truth) and the expert panel as well as inter-obser-
ver variability among the Radiation Oncologists. The
MIM AABS tool had higher mean DSC when compared
to the STAPLE than compared to the observers for the
CTV and all OAR. The variability in the DSC seen in
the comparisons between the auto-contours versus
STAPLE and the auto-contours versus the expert panel
for the prost ate bed, bladder , penile bulb and the rec-
tum regions are comparable.
The spatial overlap between the atlas builder and
STAPLE was calculated to determine if the atlas builder
contours the CTV and ROI as the community of radia-
tion oncologists would contour th ese regions. The mean
DSC (SD, range) was 0.93 (0.03, 0.90-0.96) for the
Figure 4 Axial and Sagittal Computed T omography Image Demonstrat ing Individual Contours From the Expert Panel. Colors: red
represents the contours for the prostate bed; green represents the contours for the bladder; pink represents the contours for the left femoral
head; yellow represents the contours for the right femoral head; royal blue represents the contours for the rectum; and teal represents the
contours for the penile bulb.
Table 2 DSCs of the CTV and ROIs, assessing auto-contours and inter-observer variability
Variables AC vs. STAPLE Edited AC vs.
STAPLE
AC vs. Expert
Panel
STAPLE vs. Expert
Panel
Observers vs. Other
Observers
AB vs. STAPLE
Prostate Bed 0.48 (0.17, 0.18-
0.59)
0.67 (0.19, 0.18-
0.91)
0.47 (0.16, 0.11-
0.64)
0.78 (0.15, 0.37-0.91) 0.65 (0.14, 0.29-0.84) 0.93 (0.03, 0.90-
0.96)
Bladder 0.67 (0.19, 0.34-
0.80)
0.88 (0.13, 0.34-
0.97)
0.67 (0.18, 0.33-
0.81)
0.96 (0.02, 0.92-0.98) 0.94 (0.03, 0.87-0.97) 0.97 (0.01, 0.95-
0.99)
Left Femoral
Head
0.92 (0.01, 0.92-
0.93)
0.93 (0.01, 0.92-
0.97)
0.83 (0.18, 0.43-
0.93)
0.87 (0.19, 0.47-0.98) 0.76 (0.23, 0.42-0.99) 0.96 (0.01, 0.95-
0.98)
Right Femoral
Head
0.92 (0.01, 0.91-
0.93)
0.92 (0.01, 0.90-
0.96)
0.83 (0.17, 0.45-
0.94)
0.87 (0.19, 0.46-0.98) 0.77 (0.23, 0.46-0.99) 0.97 (0.01, 0.95-
0.98)
Penile Bulb 0.33 (0.25, 0.10-
0.70)
0.54 (0.21, 0.10-
0.78)
0.31 (0.23, 0-0.78) 0.70 (0.17, 0-0.88) 0.55 (0.22, 0-0.84) 0.84 (0.07, 0.75-
0.94)
Rectum 0.59 (0.11, 0.48-
0.77)
0.78 (0.12, 0.49-
0.90)
0.58 (0.09, 0.45-
0.77)
0.89 (0.06, 0.67-0.94) 0.83 (0.07, 0.65-0.91) 0.94 (0.02, 0.92-
0.96)
Mean DSC (SD, Range)
AC = auto-contours
STAPLE = Simultaneous Truth and Performance Level Estimation
AB = atlas builder
DSC = dice similarity coefficient
SD = standard deviation
Hwee et al. Radiation Oncology 2011, 6:110
/>Page 6 of 9
prostate bed, 0.97 (0.01, 0.95-0.99) for the bladder, 0.96
(0.01, 0.95-0.98) for the left femoral head, 0.97 (0.01,
0.95-0.98) for the right femoral head, 0.84 (0.07, 0.75-
0.94) for the penile bulb and 0.94 (0.02, 0.92-0.96) for
the rectum.
One-way ANOVA on DSC b etween Radiation Oncol-
ogists was performed to evaluate inter-observer variabil-
ity. At least one observer significantly differed from the
other observers when contouring the prostate bed (p
value = 0.002), left femoral head (p value < 0.001) and
right femoral head (p value < 0.001). There was no sig-
nificant difference among observers when contouring
the bladder, penile bulb and the rectum. Two-way
ANOVA modeling the effects of the observer and
patient on the DSC was performed. This reve aled signif-
icant differences in the delineation of the prostate bed,
(p < 0.001). Observer and patient differences signifi-
cantly predicted for variability in DSC for prostate bed
(p < 0.001, p = 0.006) and bladder (p = 0.002, p <
0.001). Variability in right and left femoral heads DSC
was significantly dependent on the observer only (both
p < 0.001), while variability in rectum and penile bulb
delineation was dependent on patient factors (p <
0.001). Another two-way ANOVA analysis modeling the
effects of the observers and patients on the contouring
time was performed. The full two-way model for the
contouring time was significant (p < 0.001) with both
the observers (p < 0.001) and the patients (p < 0.001)
having a significant effect on the contouring time.
Stage III
With regards to stage three, Table 2 displays the results
of the DSC comparing the edited-auto-contours by the
expert panel to the STAPLE. The highest spatial overlap
was seen in the left femoral head and the right femoral
head, while the lowest spatial o verlap was seen in the
penile bulb. The second lowest spatial overla p was seen
in the prostate bed. These results are consistent with
those seen in stage two that compared the unedited
auto-contours to STAPLE.
The expert panel was sent an anonymized representa-
tive contour sets generated by another expert panel
member, the AABS, the STAPLE algorithm. Prior to any
editing of the stage two contours by the observers, the
observers were asked if the contours were acceptable.
Of the 100 cases distributed, 78% of the human con-
tours, 96% of the STAPLE contours, and 12% of the
MIM auto-contours were considered clinically accepta-
ble. The expert panel was also asked to identify the
source of the contours. Out of the 50 non-human con-
tours, 54% were correctly identified while out of the 50
human contours, 70% was correctly identified. The
probability that a Radiation Oncologist was able to
properly identify his own contours was 56%.
The panel members were asked to edit the contours
as clinically necessary. There appeared to be little intra-
observer variability among the edited contours among
the expert panel. The penile bulb had the lowest mean
DSC at 0.89 (0.04, 0.84-0.98) which is still considered to
be good spatial overlap. The remaining OARs intra-
observer variability DSC were: prostate bed 0.94 (0.04,
0.84-0.98), bladder 0.98 (0.01, 0.96-0.99), left femoral
head 0.97 (0.01, 0.96 -0.99), right femoral head 0.97
(0.01, 0.95-0.99), and rectum 0.94 (0.04, 0.80-0.98).
The mean (SD) contouring time for all five cases for
the edited auto-contouring time and the manual con-
touring time was 14.1 minutes (8.4 minutes) and 17.5
minutes (5.4 minu tes) respectively, equating to an aver-
age 24% time reduction when using the AABS tool. A
paired t-test comparing the times of the edited auto-
contouring to the manual contouring time showed s ig-
nificant difference in contouring times (p value = 0.003).
Discussion
Inter-observer variability in segmentation (targets and
organs at risk) may be the most s ignificant contributor
to uncertainty in radiation treatment planning [8]. We
have shown that even with the use of consens us guide-
lines, inter-observer variability still exists. With these
findings, it is important to continue to address the varia-
bility challenges. Computerized contouring aids can
potentially reduce this variability and increase efficiency
in the segmentation workflow and AABS is one such
tool. This was the first study to evaluate automated atlas
based segmentations for the prostate bed. In this study
we evaluated and validated contours created by atlas-
based segmentation engines in the contex t of segmenta-
tion of post-prostatectomy radiotherapy planning CT
datasets. In the context of this study, only 12% of the
unedited contours generated by the AABS were found
to be clinically acceptable by the expert panel. Specifi-
cally, while the AABS tool appears to reasonably deline-
ate the femoral heads, bladder and rectum, the
delineation of the prostate bed and penile bulb were
unacceptable. The edited-auto-contours for the femoral
heads, bladder and rectum had superior t o good spatial
overlap when compared to the gold standard. However,
the edited-auto-contours for the prostate bed and the
penile bulb require improvement when compared to the
gold standard. The penile bulb represents a small
volume, and thus small variations in its contouring will
result in a large change in DSC. In terms of the prostate
bed our findings are not surprising given that AABS
algorithms are typically developed to detect and segment
intact structures and the prostate bed is a “virtual” tar-
get defined by boundaries of surrounding normal tissues
based on known patterns of recurrence and expert opi-
nion rather than a discrete structure.
Hwee et al. Radiation Oncology 2011, 6:110
/>Page 7 of 9
The inherent difficulty in defining the “ virtual” pros-
tate bed target is reflected in the presence of inter-
observer variability in the delineation of t he prostate
bed and has been repeatedly demonstrate d in the litera-
ture [2-4,12,13]. This variability appears to persist even
despite the use of rigorous contouring protocols and
guidelines [12,14-16]. Symon et al., in their study of
prostate bed contouring variability, defined a high-risk
volume, which on average is missed in 27.5% (range,
2.3%-78.7% ) of cases. At le ast 25% of the high -risk
volume at the bladder neck anastomosis and the retro-
vesical space was excluded in 11 out of 38 CTVs [13].
Our study found that intra-observer variability was a
smaller source of TVD error than inter-observer varia-
bility, consistent with the literature [3,17]. Wiltshire et
al. quantified TVD variability using a distance-based
approach, and found consistent inter-observer variability
within the anterioposterior and superioinferior dimen-
sions measuring a mean (SD) distance between contours
of 3.8 mm (2.2 mm) and 1.2 mm (2.3 mm) resp ectively.
The main source of the intra-observer variability in this
study was in the anterior-posterior dimension measuring
amean(SD)distancebetweencontoursof0.4mm
(1.2 mm).
The use o f AABS tools to delineate OARs for other
cancer disease sites including head and neck [10], breast
[18], and endometrium [19] have been shown to reduce
TVD variability and the total time required to contour;
in our study the main benefit of the AABS was in
decreasing the amount of time for contouring through
editing of the auto contours rather than requiring de
novo generation of contours.
The conclusions of this study need to be considered in
the context of its limitations. The 80 post-prostatectomy
cases used from our institution may limit the applicabil-
ity of the atlas to other practice groups. Incorporating
all available patients into the atlas building process does
have a drawback. While increasing the number of
patients added to the atlas increases the potential to
account for differences in anatomy post surgery, it is at
the cost of computational time. The larger the atl as, the
longer it will take the tool to search through the atlas to
select the best match. Other studies used 10 patients
[10] and one study that assessed the same AABS tool
included 15 patients in their atlas [19]. We found no
improvement in performance of the A ABS when ana-
lyzed by quintile; suggesting a dataset of 15 patients
may be sufficient to provide auto contours that are use-
ful for subsequent editing/refinement.
This study’s methodology builds on the available lit-
erature to improve the methodological strength. The
strengths of the methodology include the use of consen-
sus guidelines, anonymized datasets, the blinding
of observers, the creation of a ground truth, and our
specific measures to limit bias, especia lly with the com-
parison of the atlas builder to the ground truth. Except
for our attempts to limit bias, this methodology is simi-
lar to that used in another study [20]. The differences
are i n the att empts to limit bias a nd the statistical
analyses.
We recommend that the MIM AABS tool can be
adopted for routine clinical use to generate auto-con-
tours for the bilateral femoral heads with no editing
required. For the bladder and rectum, the auto-contours
require some editing by a Radiation Oncologist. Clinical
use of the atlas requires a Radiation Oncologist to
review and edit the auto-contours, in particular for
OARs where the AABS underperforms such as the
penile bulb and prostate bed CTV. The automated con-
touring workflow from a clinical perspective was shown
to be significantly shorter than the manual contouring
process. The methodolog y highlights the strengths and
areas of improvement for AABS and systematically
assesses the presence and amount of inter- and intra-
observer variability. If c ontouring practices for CTVs
and OARs converge with the adoption of contouring
guidelines, AABS algorithms may be programmed in
parallel with these guidelines to optimize how Radiation
Oncologists delineate targets. Performing these tasks in
a systematic manner through technological assessment
as demonstrated in this paper is crucial to ensure the
appr opriate use of such tools in clinical practice. As th e
field of AABS advances, it becomes increasingly impor-
tant to evaluate the accuracy and reliability of the atlas-
based segmentations to garner empirical e vidence to
support the decision-making process prior to its adop-
tion for routine clinical use.
Author details
1
Department of Epidemiology and Biostatistics, University of Western
Ontario, London, Ontario, Canada.
2
Department of Radiation Oncology,
London Regional Cancer Program, London, Ontario, Canada.
3
Department of
Medical Biophysics, University of Western Ontario, London, Ontario, Canada.
Authors’ contributions
JH drafted the manuscript and performed the statistical calculations. AL
coordinated participation in the study and assisted in manuscript
preparation and drafting. GB, TS, DD, ML, and BA participated in the study.
GR and SG conceived and coordinated the design of the study. All authors
read and approved the final manuscript.
Competing interests
The authors declare that they have no competing interests.
Received: 10 June 2011 Accepted: 9 September 2011
Published: 9 September 2011
References
1. Bolla M, Collette L: pT3N0M0 prostate cancer: a plea for adjuvant
radiation. Nat Rev Urol 2009, 6(8):410-412.
2. Michalski JM, Lawton C, El Naqa I, Ritter M, O’Meara E, Seider MJ, Lee WR,
Rosenthal SA, Pisansky T, Catton C, et al: Development of RTOG consensus
guidelines for the definition of the clinical target volume for
Hwee et al. Radiation Oncology 2011, 6:110
/>Page 8 of 9
postoperative conformal radiation therapy for prostate cancer. Int J
Radiat Oncol Biol Phys 2010, 76(2):361-368.
3. Wiltshire KL, Brock KK, Haider MA, Zwahlen D, Kong V, Chan E, Moseley J,
Bayley A, Catton C, Chung PW, et al: Anatomic boundaries of the clinical
target volume (prostate bed) after radical prostatectomy. Int J Radiat
Oncol Biol Phys 2007, 69(4):1090-1099.
4. Mitchell DM, Perry L, Smith S, Elliott T, Wylie JP, Cowan RA, Livsey JE,
Logue JP: Assessing the effect of a contouring protocol on
postprostatectomy radiotherapy clinical target volumes and
interphysician variation. Int J Radiat Oncol Biol Phys 2009, 75(4):990-993.
5. Lawton CA, Michalski J, El-Naqa I, Kuban D, Lee WR, Rosenthal SA,
Zietman A, Sandler H, Shipley W, Ritter M, et al: Variation in the definition
of clinical target volumes for pelvic nodal conformal radiation therapy
for prostate cancer. Int J Radiat Oncol Biol Phys 2009, 74(2):377-382.
6. Lawton CA, Michalski J, El-Naqa I, Buyyounouski MK, Lee WR, Menard C,
O’Meara E, Rosenthal SA, Ritter M, Seider M: RTOG GU Radiation oncology
specialists reach consensus on pelvic lymph node volumes for high-risk
prostate cancer. Int J Radiat Oncol Biol Phys 2009, 74(2):383-387.
7. Livsey JE, Wylie JP, Swindell R, Khoo VS, Cowan RA, Logue JP: Do
differences in target volume definition in prostate cancer lead to
clinically relevant differences in normal tissue toxicity? Int J Radiat Oncol
Biol Phys 2004, 60(4):1076-1081.
8. Jameson MG, Holloway LC, Vial PJ, Vinod SK, Metcalfe PE: A review of
methods of analysis in contouring studies for radiation oncology. J Med
Imaging Radiat Oncol 2010, 54(5):401-410.
9. Zietman A, Goitein M, Tepper JE: Technology evolution: is it survival of
the fittest? J Clin Oncol 2010, 28(27):4275-4279.
10. Piper JW: Evaluation of An Intensity-Based Free-form Deformable
Registration Algorithm. Medical Physics 2007, 34(6):2353-2354.
11. Warfield SK, Zou KH, Wells WM: Simultaneous truth and performance
level estimation (STAPLE): an algorithm for the validation of image
segmentation. IEEE Trans Med Imaging 2004, 23(7):903-921.
12. Ost P, De Meerleer G, Vercauteren T, De Gersem W, Veldeman L,
Vandecasteele K, Fonteyne V, Villeirs G: Delineation of the
Postprostatectomy Prostate Bed Using Computed Tomography:
Interobserver Variability Following the EORTC Delineation Guidelines. Int
J Radiat Oncol Biol Phys 2011.
13. Symon Z, Tsvang L, Wygoda M, Ben-Yoseph R, Corn BW, Poortmans P,
Portnoy O, Pfeffer MR: An interobserver study of prostatic fossa clinical
target volume delineation in clinical practice: are regions of recurrence
adequately targeted? Am J Clin Oncol 2011, 34(2):145-149.
14. Miralbell R, Vees H, Lozano J, Khan H, Molla M, Hidalgo A, Linero D,
Rouzaud M:
Endorectal MRI assessment of local relapse after surgery for
prostate cancer: A model to define treatment field guidelines for
adjuvant radiotherapy in patients at high risk for local failure. Int J Radiat
Oncol Biol Phys 2007, 67(2):356-361.
15. Poortmans P, Bossi A, Vandeputte K, Bosset M, Miralbell R, Maingon P,
Boehmer D, Budiharto T, Symon Z, van den Bergh AC, et al: Guidelines for
target volume definition in post-operative radiotherapy for prostate
cancer, on behalf of the EORTC Radiation Oncology Group. Radiother
Oncol 2007, 84(2):121-127.
16. Sidhom MA, Kneebone AB, Lehman M, Wiltshire KL, Millar JL, Mukherjee RK,
Shakespeare TP, Tai KH: Post-prostatectomy radiation therapy: consensus
guidelines of the Australian and New Zealand Radiation Oncology
Genito-Urinary Group. Radiother Oncol 2008, 88(1):10-19.
17. Louie AV, Rodrigues G, Olsthoorn J, Palma D, Yu E, Yaremko B, Ahmad B,
Aivas I, Gaede S: Inter-observer and intra-observer reliability for lung
cancer target volume delineation in the 4D-CT era. Radiother Oncol 2010,
95(2):166-171.
18. Reed VK, Woodward WA, Zhang L, Strom EA, Perkins GH, Tereffe W, Oh JL,
Yu TK, Bedrosian I, Whitman GJ, et al: Automatic segmentation of whole
breast using atlas approach and deformable image registration. Int J
Radiat Oncol Biol Phys 2009, 73(5):1493-1500.
19. Young AV, Wortham A, Wernick I, Evans A, Ennis RD: Atlas-based
segmentation improves consistency and decreases time required for
contouring postoperative endometrial cancer nodal volumes. Int J Radiat
Oncol Biol Phys 2011, 79(3):943-947.
20. Stapleford LJ, Lawson JD, Perkins C, Edelman S, Davis L, McDonald MW,
Waller A, Schreibmann E, Fox T: Evaluation of automatic atlas-based
lymph node segmentation for head-and-neck cancer. Int J Radiat Oncol
Biol Phys 2010, 77(3):959-966.
doi:10.1186/1748-717X-6-110
Cite this article as: Hwee et al.: Technology Assessment of Automated
Atlas Based Segmentation in Prostate Bed Contouring. Radiation
Oncology 2011 6:110.
Submit your next manuscript to BioMed Central
and take full advantage of:
• Convenient online submission
• Thorough peer review
• No space constraints or color figure charges
• Immediate publication on acceptance
• Inclusion in PubMed, CAS, Scopus and Google Scholar
• Research which is freely available for redistribution
Submit your manuscript at
www.biomedcentral.com/submit
Hwee et al. Radiation Oncology 2011, 6:110
/>Page 9 of 9