Báo cáo khoa học: "GP96 is over-expressed in oral cavity cancer and is a poor prognostic indicator for patients receiving radiotherap" ppt
Bạn đang xem bản rút gọn của tài liệu. Xem và tải ngay bản đầy đủ của tài liệu tại đây (571.15 KB, 24 trang )
This Provisional PDF corresponds to the article as it appeared upon acceptance. Fully formatted
PDF and full text (HTML) versions will be made available soon.
GP96 is over-expressed in oral cavity cancer and is a poor prognostic indicator
for patients receiving radiotherapy
Radiation Oncology 2011, 6:136 doi:10.1186/1748-717X-6-136
Chien-Yu Lin ()
Ting-Yang Lin ()
Hung-Ming Wang ()
Shiang-Fu Huang ()
Kang-Hsing Fan ()
Chun-Ta Liao ()
I-How Chen ()
Li-Yu Lee ()
Yan-Liang Li ()
Yin-Ju Chen ()
Ann-Joy Cheng ()
Joseph T. Chang ()
ISSN 1748-717X
Article type Research
Submission date 28 April 2011
Acceptance date 12 October 2011
Publication date 12 October 2011
Article URL />This peer-reviewed article was published immediately upon acceptance. It can be downloaded,
printed and distributed freely for any purposes (see copyright notice below).
Articles in Radiation Oncology are listed in PubMed and archived at PubMed Central.
For information about publishing your research in Radiation Oncology or any BioMed Central journal,
go to
/>Radiation Oncology
© 2011 Lin et al. ; licensee BioMed Central Ltd.
This is an open access article distributed under the terms of the Creative Commons Attribution License ( />which permits unrestricted use, distribution, and reproduction in any medium, provided the original work is properly cited.
For information about other BioMed Central publications go to
/>Radiation Oncology
© 2011 Lin et al. ; licensee BioMed Central Ltd.
This is an open access article distributed under the terms of the Creative Commons Attribution License ( />which permits unrestricted use, distribution, and reproduction in any medium, provided the original work is properly cited.
GP96 is over-expressed in oral cavity cancer and is a poor prognostic
indicator for patients receiving radiotherapy
Chien-Yu Lin
1,6
,
Ting-Yang Lin
2
,
Hung-Ming Wang
3
, Shiang-Fu Huang
4
,
Kang-Hsing Fan
1,6
,
Chun-Ta Liao
4
, I-How
Chen
4
, Li-Yu Lee
5,6
,
Yen-Liang Li
2
,
Yin-Ju Chen
2
, Ann-Joy Cheng
2
§
, Joseph T. Chang
1,7
§
1
Department of Radiation Oncology, Chang Gung Memorial Hospital, Taoyuan 333, Taiwan.
2
Department of Medical Biotechnology, Chang Gung University, Taoyuan 333, Taiwan.
3
Department of Medical Oncology, Chang Gung Memorial Hospital, Taoyuan 333, Taiwan.
4
Department of Otorhinolaryngology, Chang Gung Memorial Hospital, Taoyuan 333, Taiwan.
5
Department of Pathology, Chang Gung Memorial Hospital, Taoyuan 333, Taiwan
6
Graduate Institute of Clinical Medical Science, Chang Gung University, Taoyuan 333, Taiwan.
7
Department of Medicine, Chang Gung University, Taoyuan 333, Taiwan.
§
Co-corresponding authors
Corresponding author
Joseph Tung-Chieh Chang, Professor
Department of Radiation Oncology,
Chang Gung Memorial Hospital-Linko Medical Center
5 Fu-Hsing Road,
Taoyuan 333, Taiwan
Tel: 886-3-3281200 ex 2613
Fax: 886-3-3280797
E-mail:
Email addresses:
CYL:
AJC:
JTC:
Abstract
Background: Oral cavity cancers (ORC) are the most common cancers, and standard treatment is radical
surgery with postoperative radiotherapy. However, locoregional failure remains a major problem, indicating
radioresistance an important issue. Our previous work has shown that GP96 contributed to radioresistance in
nasopharyngeal and oral cancer cell lines. In this study, we determined clinical significance of GP96 in ORC
by evaluation of GP96 expression and its association with disease prognosis in patients receiving
radiotherapy
Methods: Total of 79 ORC patients (77 males, median age: 48 years old) receiving radical surgery and
postoperative radiotherapy between Oct 1999 and Dec 2004 were enrolled. Patients in pathological stages II,
III and IV were 16.5%, 16.5% and 67%, respectively. For each patient, a pair of carcinoma tissue and
grossly adjacent normal mucosa was obtained. GP96-expression was examined by western blot analysis, and
the association with clinicopathological status was determined.
Results: Three-year locoregional control (LRC), distant metastasis-free survival (DMFS), disease-specific
survival (DSS) and overall survival (OS) rates were 69%, 79%, 63% and 57%, respectively. We found that
55 patients (70%) displayed GP96-overexpression in the tumor tissue, which correlated with a higher pN
stage (p=0.020) and tumor depth (>10 mm) (p=0.045). Nodal extracapsular spreading (ECS) and
GP96-overexpression predicted adverse LRC (p=0.049 and p=0.008). When stratified by nodal ECS, the
adverse impact of GP96 remained significant in three-year LRC (p=0.004). In multivariate analysis,
GP96-overexpression was also an independent predictor of LRC, DSS and OS (p=0.018, p=0.011 and
p=0.012).
Conclusion: GP96 may play roles in radioresistance which attributes to tumor invasiveness in oral cancer
patients receiving radiotherapy. GP96 may serve as a novel prognostic marker of radiotherapy. However,
further independent studies are required to validate our findings in a larger series.
Keywords: GP96; oral cavity cancers; prognosis; radioresistance
Background
Oral cavity cancers (ORC) are among the most common cancers in the world [1]. Epidemiological
studies have shown strong associations between ORC and the use of tobacco, alcohol and betel quid [2]. The
standard treatment for ORC is radical surgery [3]. Postoperative radiotherapy (Postop-RT) with/without
concurrent chemotherapy is added to eliminate microscopic tumor cells in high-risk patients. However,
locoregional failure remains a major problem if the tumor is radioresistant [4-7].
Heat shock protein (Hsp) is a highly conserved molecular chaperone protein that functions as
biochemical regulators of cell growth, apoptosis, and homeostasis. It is up-regulated under stress conditions,
such as starvation, hypoxia, heat, virus infection and neoplasia [8,9]. Hsp GP96, also known as
glucose-regulated protein 94 (GRP94), is a member of the Hsp 90 family.[10] It plays an important role in
regulating mitogenesis, cell cycle and apoptosis [8,9,11]. In addition, GP96 has been found to induce
protective tumor-specific immunity [11]. Recently, aberrant GP96-expression has been observed in several
cancers [12,13], suggesting a link between neoplasms and GP96-expression. Our previous work has shown
that GP96 contributed to radioresistance in nasopharyngeal carcinoma (NPC) and ORC cell lines [14,15],
indicating that this molecule may affect the efficacy of radiotherapy. In this study, we investigated the
clinical significance of GP96 and the impact on treatment outcome in ORC patients with Postop-RT.
Materials and Methods
Patients and specimens
We obtained tissue bank specimens from ORC patients visiting the Chang Gung Memorial
Hospital-Linko between Oct 1999 and Dec 2004. Samples were from 79 patients with newly diagnosed
non-metastatic ORC receiving radical surgery followed by Postop-RT. A grossly normal sample of oral
mucosal tissue as well as a tumor specimen was collected. This study was approved by the Institutional
Review Broad of the Human Investigation Committee in our institution.
Staging and Treatments
The pre-treatment workup included a chest X-ray, liver ultrasound and bone scan to exclude distant
metastases. F18-FDG PET (18-fluoro,2-fluoro-2-deoxy-D-glucose, positron emission tomography) was
incorporated after Oct. 2003. Computed tomography (CT) or magnetic resonance imaging (MRI) was used
to determine tumor burden. Radical surgery was defined as a wide excision with a 1-2 cm safety margin
with/without immediate free-flap reconstruction. Mandibulectomy or maxillectomy were performed as
dictated by tumor extension or margin space. Ipsilateral elective neck dissection was used for clinical N0
patients and radical neck dissection for clinical N+ patients. Intraoperative frozen examinations were
performed to ensure adequate margins. The definition of an adequate margin was a tumor-free margin of at
least 5 mm according to final pathological report. All tumor stage evaluations were revised according to the
2002 AJCC pathological staging criteria.
Postop-RT was scheduled within 4-8 weeks of surgery and was administered as 6 megavolt x-ray
generated by a linear accelerator. Conventional radiotherapy techniques, 2-dimensional planning or
3-dimensional conformal radiotherapy were used in early patients, while intensity-modulated radiotherapy
(IMRT) was incorporated after 2001. Conventional techniques consisted of bilateral-opposing and
lower-anterior neck portals. Neck boosts by megavolt electron were used for sparing spinal cord after 46 Gy.
Doses of 1.8-2 Gy/fraction were given in 5 fractions per week. Initial prophylactic doses of 46-50 Gy were
for all risk areas and a further boost of 60 Gy for the primary tumor bed and involved nodal areas. Elevated
doses of 66 Gy in combination with concurrent chemotherapy were used in patients with positive margins,
nodal extracapsular spreading (ECS) or pathological multiple nodal metastasis. Concurrent chemotherapy
was administered with intravenous Cisplatin 50 mg/m2 and oral 5-FU analogue 1400 mg/m2 combined with
leucovorin 60mg on a biweekly schedule during radiotherapy. Patients were closely followed for at least
three years or until death. Patient status as of the last follow-up was recorded at the last outpatient visit,
telephone interview or date of death.
Tissue processing, protein extraction and western blot analysis
For each tissue, cellular proteins were extracted and the level of GP96 protein was determined by western
blot method, similarly as previously described.
15
Briefly, total of 20 µg tissues protein were separated by 8%
SDS-polyacrylamide gel electrophoresis and transferred to a nitrocellulose membrane. The membrane was
hybridized with an anti-GP96 antibody (NeoMarkers, Fremont, CA, USA) and subsequently incubated with
secondary antibodies conjugated to horseradish peroxidase. The blots were developed using Renaissance
chemiluminescence reagent (NEN Life Science Products, MA, USA) following autoradiography. To
determine the relative expression of GP96 in tumor tissue, the band density of each tumor sample was
compared with the normal oral mucosa sample taken from the same patient after normalization to an internal
control (actin). GP96-overexpression was defined as a 1.5-fold increase in lesion tissue as compared with
the normal oral mucosa. The level of GP96-expression and its associations with clinicopathological
parameters and treatment outcomes were analyzed.
Statistical analysis
Time intervals were calculated from the end of RT to the events of interest. Locoregional control (LRC)
was defined as freedom from relapse at the primary site or neck, distant relapse for distant metastasis-free
survival (DMFS), and either one for disease-free survival (DFS). Disease-specific survival (DSS) was
defined as survival until death from the disease or treatment-related toxicities, and any other cause for
overall survival (OS). Relapse events were defined by imaging findings, clinical or pathological examination.
Commercial statistical software (SPSS 13.0; SPSS, Chicago, IL) was used for data analysis. Variables that
might affect outcomes were evaluated using the chi-squared test, independent t-test or Fisher’s exact test as
appropriate. Survival curves were calculated by the Kaplan-Meier method with a log-rank test for univariate
analysis. A stepwise Cox-regression model for multivariate analysis was used for further analysis of
potentially significant variables.
Results
Patient characteristics and treatment outcome
Our study included 79 patients, and median age was 48 years old (range 30-75). The patient
characteristics were listed in Table 1. Pre-treatment imaging was performed using MRI (n=42, 53%), CT
scan (n=32, 41%) or both (n=5, 6%). Thirteen (16.5%) patients also had F18-FDG PET scans to aid diagnosis.
Primary tumor site were buccal (n=57, 72%) and majority of patients were stage IV disease (67%). The
detailed T-N distribution is shown in Table 2.
Radical surgery followed by Postop-RT was performed in this cohort. The median nearest resection
margin was 8 mm (range: 1-15), and no patients had positive margins. Neck dissection was ipsilateral (n=67,
85%), bilateral (n=10, 13%), and none (n=1). For Postop-RT, elective neck irradiation was ipsilateral (n=58,
73%) and bilateral in remaining cases. The median time interval between operation and radiotherapy was 5.5
weeks (range: 2.7-15), and a median dose of 66 Gy (range: 56-68) in median of 7 weeks (rang: 5.8-16).
Thirty-eight (48%) patients received concurrent chemotherapy.
The median follow-up time was 4.3 years (range, 2.1-8.0). At the end of the study, 39 patients remained
alive and 40 had died. Deaths were due to locoregional disease (n=14), distant metastasis (n=14), second
primary malignancy (n=3), intercurrent disease (n=8) and traffic accident (n=1). Thirty-two patients suffered
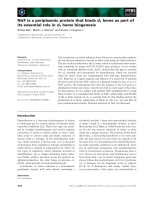
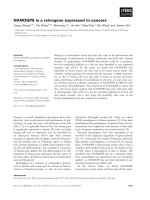
from recurrent disease and the detailed failure pattern is shown in Figure 1. A total of 20 patients (25%) had
locoregional recurrence and 15 patients (19%) had distant metastasis. All locoregional failures were infield
recurrences except for two outfield neck recurrences.
GP96 is over-expressed in oral cavity cancers and predicts poorer treatment outcome
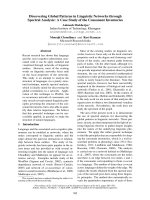
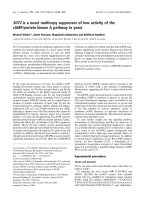
Using the criterion of a 1.5-fold differential expression in tumor tissue compared to the normal
counterpart, there were 9 out of 79 patients (11.4%) whose tumor had GP96 under-expression ( 1.5-fold),
11 patients (19.0%) equal expression (between 0.67- to 1.5-fold), and 55 patients (69.6%) over-expression
( 1.5-fold, Figure 2). However, the treatment outcomes had no statistical difference between under- and
equal-expressed patients. Therefore, we categorized GP96 under- and equal-expression into the same group
for analysis. The associations between GP96 over-expression and clinicopathological factors are
summarized in Table 1. Significant correlations were found between GP96-overexpression and nodal stage
(p= 0.020) or tumor depth (p=0.045). Other associations were not observed.
The three-year overall LRC, DMFS, DFS, DSS and OS were 69%, 78.6%, 57.5%, 63.3% and 56.6%,
respectively. The treatment prognosis evaluation by univariate analysis and multivariate analysis were
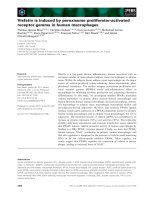
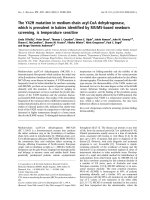
summarized in Table 3 and Table 4. In univariate analysis, patients with the status of GP96-overexpression
in tumors predicts poorer treatment outcome on 3-year LRC (p=0.008, Figure 3), DMFS (p=0.018), DFS
(p=0.001), DSS (p=0.001) and OS (p=0.003). In multivariate analysis, GP96-overexpression remained
independent significance on LRC (p=0.018), DFS (p=0.006), DSS (p=0.011), OS (p=0.012), and marginal
effect on DMFS (p=0.072).
Contribution of GP96-expression to LRC in N stage or ECS-stratified populations
According to well-known pathological risk factors, patients displaying positive margins, nodal ECS or
pN2 stage disease are at high risk in terms of selection for concurrent chemoradiotherapy [5-7,16]. Therefore,
we further examined the effect of GP96-expression in relation to these indicators. Because no case with
positive margins was available in this study, only pN2 stage disease and nodal ECS were used. In this study,
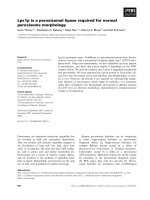
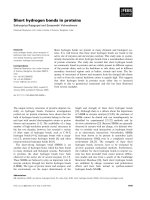
3-year LRC for nodal ECS or pN2 were 54% and 62%, respectively (Figure 4A-B). Further stratified by
GP96-expression status, distinguishable four groups were observed. In patients with nodal ECS,
GP96-overexpression still predicts poorer 3-year LRC 39% (vs. 100%) (Figure 4C) and also noted in
patients with pN2 stage (54% vs. 100%) (Figure 4D). These results suggest that GP96 overexpression in
tumor cells may be a significant predictor of poor prognosis for those patients receiving radiotherapy.
Discussion
In this study, the treatment outcomes of ORC were comparable to previously published data [5-7].
Our data indicate that nodal ECS is a predictor of treatment outcomes by univariate analysis (Table 3). This
effect was lost in the multivariate analysis of LRC, but it remained significant for other outcome (Table 4).
The impact on treatment outcome of pN2 has only marginal effect. This observation agrees with our
retrospective data indicating that concurrent chemoradiotherapy can overcome this negative effect, and
considering of GP96-expression is another important issue.
GP96, a 94-100 kDa Ca
2+
-binding protein, is the most abundant protein in the endoplasmic reticulum
(ER). It functions as a chaperone in ER, regulates mitogenesis, apoptosis, and antigenic-presenting immune
response [8-11]. Up-regulation of GP96-expression has been reported under stress conditions, including
starvation, hypoxia, heat, viral infection and neoplasia [8,9]. In the presence of stress, the final fate of cells
may depend on their ability to resist stress. GP96 regulates cell fate by maintaining the intracellular Ca
2+
balance between the cytosol, ER and mitochondria. In this study, we examined GP96-expression in
advanced ORC patients and found that GP96 is overexpressed in 70% of patients, which is consistent with
previous findings indicating that GP96 is overexpressed in several human neoplasms [12,13,17]. It
indicates that GP96 plays an important role in cancer development and continuous expression required for
regulation and stabilizing tumor growth [13]. We also found that GP96-expression was correlated with
tumor depth and N stage (Table 1). It is consistent with reports suggesting associations between elevated
GP96-expression and tumor advanced stage or invasive ability. In addition, we found that
GP96-overexpression was a strong independent prognostic factor for LRC, DFS, DSS and OS, although a
marginal effect on DMFS (Table 3). It is consistent with a previous report indicating that GP96-expression
serves as a poor prognostic factor in gastric carcinoma [13].
As mentioned above, GP96-expression was a strong predictor of LRC (p=0.008, Table 3, Figure 3) and
was the only independent predictor in the multivariate models (Table 4). We therefore hypothesize that
GP96-expression is strongly associated with tumor radioresistance. Based on these observations, we further
analyzed the effect of GP96-expression using stratification by well-established pathological risk factors such
as nodal ECS or pN2 stage; the adverse effect of GP96-expression was still distinguishable (Figure 4C-D).
We observed GP96-overexpression makes it poorer on LRC in patients with nodal ECS or pN2 stage,
suggesting that GP96 may exhibit tumor radioresistance. Interestingly, in non-GP96-overexpression group,
if patients with nodal ECS or pN2, which were high-risk patients selected for concurrent chemotherapy, it
has inversely better 3-year LRC than low-risk patients who received Postop-RT alone (Figure 4C-D). This
might be due to concurrent chemotherapy may effectively enhance tumor cell-killing in normal
GP96-expression group.
In this study, our observations were consistent with previous reports that GP96-overexpression reduced
radiosensitivity in cervical cancer and NPC cell lines [14,18]. In addition, it supports the clinical evidence
comparable with our previous work on ORC cell lines: increasing of GP96-expression was observed in
radioresistant sublines, and GP96-knockdown enhanced radiosensitivity via increasing G2/M arrest and
reactive oxygen species levels [15]. Therefore, GP96 may play roles in radioresistance which attributes to
tumor invasiveness in oral cancer patients receiving radiotherapy. GP96 may serve as a novel prognostic
marker of radiotherapy. However, further independent studies are required to validate our findings in a
larger series.
Acknowledgments
This work was supported by grants from Chang Gung Memorial Hospital CMRPG390421 and
CMRPG380051.
List of abbreviations
Oral cavity cancer (ORC), Postoperative radiotherapy (Postop-RT), Heat shock protein (Hsp),
Nasopharyngeal carcinoma (NPC), Computed tomography (CT), Magnetic resonance image (MRI),
Intensity-modulated radiotherapy (IMRT), Extracapuslar spreading (ECS), Locoregional control (LRC),
Disease-specific survival (DSS), Distant metastasis-free survival (DMFS), disease-free survival (DFS),
Overall survival (OS), Endoplasmic reticulum (ER)
Competing interests
Nothing to declare.
Authors Contributions
CYL, AJC and JTC prepared the study concept and design. CYL did the major manuscript writing. AJC
and JTC did the major revision of the manuscript. CYL, YLL and TYL made the major contribution for
tissue processing. CYL and AJC did the laboratory interpretation. CYL did the data analysis. HMW, SFH,
KHF and JTC participated in the clinical data interpretation. CYL, HMW, SFH, KHF, CTL and IHC
treated the patients and did the data collection. All authors read and approved the final manuscript
Reference List
1. Chen YJ, Chang JT, Liao CT, Wang HM, Yen TC, Chiu CC, Lu YC, Li HF, Cheng AJ: Head and
neck cancer in the betel quid chewing area: recent advances in molecular carcinogenesis. Cancer
Sci 2008, 99:1507-1514.
2. Ko YC, Huang YL, Lee CH, Chen MJ, Lin LM, Tsai CC: Betel quid chewing, cigarette smoking
and alcohol consumption related to oral cancer in Taiwan. J Oral Pathol Med 1995, 24:450-453.
3. Clinical practice guidelines in cancer of oral cavity. National Comprehensive Cancer Network 2008,
version 2. ( professionals/ physician_gls/ f_guidelines.asp)
4. Gonzalez-Garcia R, Naval-Gias L, Roman-Romero L, Sastre-Perez J, Rodriguez-Campo FJ: Local
recurrences and second primary tumors from squamous cell carcinoma of the oral cavity: a
retrospective analytic study of 500 patients. Head Neck 2009, 31:1168-1180.
5. Liao CT, Chang JT, Wang HM, Ng SH, Hsueh C, Lee LY, Lin CH, Chen IH, Huang SF, Cheng AJ et
al.: Analysis of risk factors of predictive local tumor control in oral cavity cancer. Ann Surg Oncol
2008, 15:915-922.
6. Lin CY, Lee LY, Huang SF, Kang CJ, Fan KH, Wang HM, Chen EY, Chen IH, Liao CT, Cheng AJ et
al.: Treatment outcome of combined modalities for buccal cancers: unilateral or bilateral neck
radiation? Int J Radiat Oncol Biol Phys 2008, 70:1373-1381.
7. Fan KH, Lin CY, Kang CJ, Huang SF, Wang HM, Chen EY, Chen IH, Liao CT, Cheng AJ, Chang JT:
Combined-modality treatment for advanced oral tongue squamous cell carcinoma. Int J Radiat
Oncol Biol Phys 2007, 67:453-461.
8. Ni M, Lee AS: ER chaperones in mammalian development and human diseases. FEBS Lett 2007,
581:3641-3651.
9. Calderwood SK, Khaleque MA, Sawyer DB, Ciocca DR: Heat shock proteins in cancer: chaperones
of tumorigenesis. Trends Biochem Sci 2006, 31:164-172.
10. Nicchitta CV: Biochemical, cell biological and immunological issues surrounding the endoplasmic
reticulum chaperone GRP94/gp96. Curr Opin Immunol 1998, 10:103-109.
11. Fu Y, Lee AS: Glucose regulated proteins in cancer progression, drug resistance and
immunotherapy. Cancer Biol Ther 2006, 5:741-744.
12. Wang XP, Liu GZ, Song AL, Chen RF, Li HY, Liu Y: Expression and significance of heat shock
protein 70 and glucose-regulated protein 94 in human esophageal carcinoma. World J
Gastroenterol 2005, 11:429-432.
13. Zheng HC, Takahashi H, Li XH, Hara T, Masuda S, Guan YF, Takano Y: Overexpression of GRP78
and GRP94 are markers for aggressive behavior and poor prognosis in gastric carcinomas. Hum
Pathol 2008, 39:1042-1049.
14. Chang JT, Chan SH, Lin CY, Lin TY, Wang HM, Liao CT, Wang TH, Lee LY, Cheng AJ:
Differentially expressed genes in radioresistant nasopharyngeal cancer cells: gp96 and GDF15.
Mol Cancer Ther 2007, 6:2271-2279.
15. Lin TY, Chang JT, Wang HM, Chan SH, Chiu CC, Lin CY, Fan KH, Liao CT, Chen IH, Liu TZ et al.:
Proteomics of the radioresistant phenotype in head-and-neck cancer: Gp96 as a novel prediction
marker and sensitizing target for radiotherapy. Int J Radiat Oncol Biol Phys 2010, 78:246-256.
16. Bernier J, Cooper JS, Pajak TF, van GM, Bourhis J, Forastiere A, Ozsahin EM, Jacobs JR, Jassem J,
Ang KK et al.: Defining risk levels in locally advanced head and neck cancers: a comparative
analysis of concurrent postoperative radiation plus chemotherapy trials of the EORTC (#22931)
and RTOG (# 9501). Head Neck 2005, 27:843-850.
17. Wang XP, Qiu FR, Liu GZ, Chen RF: Correlation between clinicopathology and expression of heat
shock protein 70 and glucose-regulated protein 94 in human colonic adenocarcinoma. World J
Gastroenterol 2005, 11:1056-1059.
18. Kubota H, Suzuki T, Lu J, Takahashi S, Sugita K, Sekiya S, Suzuki N: Increased expression of
GRP94 protein is associated with decreased sensitivity to X-rays in cervical cancer cell lines. Int J
Radiat Biol 2005, 81:701-709.
Figure Legends
Figure 1. Treatment failure pattern
Figure 2. GP96 is highly expressed in advanced oral cancer tissues. Four pairs of normal (N) and tumor (T)
tissues from oral cancer patients were examined. Protein expression was determined by western blot analysis.
Actin protein expression served as an internal control.
Figure 3. GP96-overexpression is a poorer prognostic factor on locoregional control (LRC), as shown by
the survival curves calculated by the Kaplan-Meier method. GP96(+): GP96 overexpression, as the protein
level is 1.5-fold higher in the tumor tissue compared to the normal counterpart; GP96(-): GP96
non-overexpression, as the protein level is comparable or lower (≦ 1.5-fold) compared to the normal
counterpart.
Figure 4. Contribution of GP96-expression on locoregional control (LRC) in nodal ECS (A) or pN2 (B)
stage-stratified patients, and provides additional information when stratified by risk of ECS (C) or N stage
(D). All the survival curves were calculated by the Kaplan-Meier method. ECS(+): positive for nodal ECS;
ECS(-): negative for nodal ECS; N0-1: N0-1 stage; N2: N2 stage; GP96(+): GP96 overexpression, as the
protein level is 1.5-fold higher in the tumor tissue compared to the normal counterpart; GP96(-): GP96
non-overexpression, as the protein level is comparable or lower (≦ 1.5-fold) 1.5-fold) compared to the
normal counterpart.
Table 1. Association between GP96 overexpression and clinicopathological parameters
Total patients GP96 over-expression
No Yes
No. % No. % No. % P
Gender
Male
Female
77
2
97.5
2.5
23
1
30
50
54
1
70
50
0.518*
Age (years)
48
> 48
44
39
51
49
11
13
27.5
33
29
26
72.5
67
0.573
Smoking
No
Yes
14
65
18
82
4
20
29
31
10
45
71
69
0.573*
Drinking
No
Yes
19
60
24
76
4
20
21
33
15
40
79
67
0.237
Betel-quid chewing
No
Yes
14
65
18
82
5
19
36
29
9
46
64
71
0.427*
Stage
I-II
III-IV
13
66
16.5
83.5
5
19
38.5
29
8
47
61.5
71
0.349*
T stage
T1-2
T3-4
36
43
46
54
12
12
33
28
24
31
67
72
0.390
Nodal stage
N0-1
N2
44
35
56
44
18
6
41
17
26
29
59
83
0.020
Nodal ECS
No
Yes
45
34
57
43
16
8
33
23.5
29
26
67
76.5
0.183
Differentiation
Well
Moderate
Poor
24
47
8
30
60
10
9
13
2
37.5
28
25
15
34
6
62.5
72
75
0.654
Depth (millimeters)
10
> 10
30
49
38
62
13
11
43
22
17
38
57
78
0.045
Skin invasion
No
Yes
72
7
91
9
22
2
31
29
50
5
69
71
0.641*
Bone invasion
No
Yes
56
23
71
29
18
6
32
26
38
17
68
74
0.402
Perineural invasion
No
Yes
Missing
53
24
2
67
30
3
15
8
28
33
38
16
72
67
0.424
Blood Vessel invasion
No
Yes
Missing
72
5
2
91
6
3
22
1
31
20
50
4
69
80
0.528*
Lymphatic vessel invasion
No
Yes
Missing
65
12
2
82
15
3
22
1
34
8
43
11
66
92
0.069*
Margin status (millimeters)
5
< 5
66
13
83.5
16.5
20
4
30
31
46
9
70
69
0.605*
* Fisher’s exact test
Abbreviations: ECS = extracapsular spreading
Table 2. Distribution of pathological T and N stage.
Pathological N stage
Pathological T stage N0 N1 N2 Total
T1 0 2 2 4 (5)
T2 13 6 13 32 (40.5)
T3 3 2 8 13 (16.5)
T4 12 6 12 30 (38)
Total 28 (36) 16 (20) 35 (44) 79 (100)
Values in parentheses are percentages
Table 3. Univariate analysis of 3-year survival.
LRC (%) p DMFS
(%)
p DFS (%) p DSS
(%)
p OS (%) p
Stage I-II
III-IV
81.8
66.4
0.245 84.6
77.5
0.548 69.2
55.1
0.282 76.9
60.4
0.208 76.9
54.2
0.033
T stage T1-2
T3-4
77.5
61.6
0.145 81.9
75.6
0.458 66.3
49.6
0.139 71.3
55.9
0.144 66.7
50.4
0.021
N stage N0-1
N2-3
74.1
62.2
0.196 87.5
66.8
0.023 66.7
45.8
0.024 75.8
46.6
0.007 72.3
40.0
0.002
Depth (millimeters)
10
> 10
61.2
74.8
0.367 90.0
71.7
0.118 55.1
58.8
0.938 67.9
60.3
0.694 62.4
55.1
0.417
Differentiation Well
Moderate
Poor
72.0
67.1
75.0
0.818 86.6
82.5
37.5
0.003 66.0
56.6
37.5
0.264 70.2
64.1
37.5
0.203 66.7
56.8
37.5
0.580
Nodal ECS No
Yes
78.1
53.8
0.049 87.9
63.7
0.019 70.7
38.3
0.005 79.5
39.4
0.001 75.6
34.3
0.001
Skin invasion No
Yes
71.6
41.7
0.153 81.3
51.4
0.076 60.5
28.6
0.071 67.0
28.6
0.033 60.8
28.6
0.204
Bone invasion No
Yes
71.6
62.7
0.407 74.5
90.7
0.226 57.7
56.9
0.871 64.2
60.2
0.940 58.9
54.8
0.251
Perineural invasion No
Yes
68.1
71.9
0.717 81.3
69.2
0.295 58.6
51.9
0.349 67.8
50.0
0.170 62.0
45.8
0.318
Blood vessel invasion No
Yes
67.5
80.0
0.729 78.0
75.0
0.999 56.0
60.0
0.891 62.4
60.0
0.909 56.6
60.0
0.741
Lymphatic vessel invasion No
Yes
67.6
75.8
0.845 81.9
55.6
0.014 58.1
46.3
0.218 65.1
45.8
0.106 59.6
41.7
0.117
Margin status (millimeters) 5
< 5
67.1
80.8
0.406 77.3
84.6
0.737 55.4
68.4
0.517 59.2
83.3
0.152 54.1
65.9
0.157
Concurrent chemotherapy No 70.8 0.613 89.3 0.014 65.2 0.071 72.6 0.506 70.6 0.022
Yes 67.8 66.0 48.9 52.4 44.3
GP96 overexpression No
Yes
90.2
58.7
0.008 95.8
69.5
0.018 86.5
44.7
0.001 95.7
49.0
0.001 87.5
44.9
0.003
Abbreviation: LRC = locoregional control; DMFS = distant metastasis-free survival; DFS = disease-free survival; DSS = disease-specific survival; OS= overall-survival;
ECS=extra-capsular spreading.
18
Table 4. Multivariate analysis of significant risk factors for survival.
P Hazard % 95 CI
LRC
GP96 over-expression 0.018 5.808 1.345-25.093
DMFS
GP96 over-expression 0.072 6.504 0.848-49.871
Skin invasion 0.020 4.973 1.289-19.190
Differentiation 0.015 3.975 1.309-12.065
Concurrent chemotherapy 0.052 3.276 0.992-10.821
DFS
GP96 over-expression 0.006 5.326 1.614-17.580
Nodal ECS 0.019 2.337 1.148-4.758
DSS
GP96 over-expression 0.011 6.532 1.530-27.890
Nodal ECS 0.014 2.698 1.225-5.942
Skin invasion 0.040 2.806 1.046-7.526
OS
GP96 over-expression 0.012 3.355 1.302-8.648
Nodal ECS 0.005 2.533 1.332-4.819
Abbreviation: LRC = locoregional control; DMFS = distant metastasis-free survival; DFS = disease-free
survival; DSS = disease-specific survival; OS= overall-survival; ECS=extra-capsular spreading.
Figure 1
Figure 2
Figure 3
(A) (B)
(C) (D)
Figure 4