Báo cáo khoa học: " Developing and evaluating stereotactic lung RT trials: what we should know about the influence of inhomogeneity corrections on dose" doc
Bạn đang xem bản rút gọn của tài liệu. Xem và tải ngay bản đầy đủ của tài liệu tại đây (409.96 KB, 8 trang )
BioMed Central
Page 1 of 8
(page number not for citation purposes)
Radiation Oncology
Open Access
Research
Developing and evaluating stereotactic lung RT trials: what we
should know about the influence of inhomogeneity corrections on
dose
Danny Schuring* and Coen W Hurkmans
Address: Catharina-hospital, Department of radiotherapy, Michelangelolaan 2, P.O box 1350, 5602 ZA, Eindhoven, The Netherlands
Email: Danny Schuring* - ; Coen W Hurkmans -
* Corresponding author
Abstract
Purpose: To investigate the influence of inhomogeneity corrections on stereotactic treatment
plans for non-small cell lung cancer and determine the dose delivered to the PTV and OARs.
Materials and methods: For 26 patients with stage-I NSCLC treatment plans were optimized
with unit density (UD), an equivalent pathlength algorithm (EPL), and a collapsed-cone (CC)
algorithm, prescribing 60 Gy to the PTV. After optimization the first two plans were recalculated
with the more accurate CC algorithm. Dose parameters were compared for the three different
optimized plans. Dose to the target and OARs was evaluated for the recalculated plans and
compared with the planned values.
Results: For the CC algorithm dose constraints for the ratio of the 50% isodose volume and the
PTV, and the V
20 Gy
are harder to fulfill. After recalculation of the UD and EPL plans large variations
in the dose to the PTV were observed. For the unit density plans, the dose to the PTV varied from
42.1 to 63.4 Gy for individual patients. The EPL plans all overestimated the PTV dose (average 48.0
Gy). For the lungs, the recalculated V
20 Gy
was highly correlated to the planned value, and was 12%
higher for the UD plans (R
2
= 0.99), and 15% lower for the EPL plans (R
2
= 0.96).
Conclusion: Inhomogeneity corrections have a large influence on the dose delivered to the PTV
and OARs for SBRT of lung tumors. A simple rescaling of the dose to the PTV is not possible,
implicating that accurate dose calculations are necessary for these treatment plans in order to
prevent large discrepancies between planned and actually delivered doses to individual patients.
Introduction
Treatment outcome of conventional radiotherapy for
early-stage lung cancer has been rather poor, while possi-
bilities for dose escalation are limited. In recent years sev-
eral studies have shown promising results using
stereotactic body radiotherapy (SBRT) for lung tumors,
with local control rates at 3 years up to 90% [1-3].
A wide variety of treatment planning algorithms is used
for SBRT. As a result, large differences exist in the way that
inhomogeneities in the target volume are handled in the
planning phase. In two important SBRT of lung cancer tri-
als, on which many current clinical implementations of
SBRT are based, different algorithms were used; the RTOG
0236 phase-II trial planning was performed without using
Published: 28 July 2008
Radiation Oncology 2008, 3:21 doi:10.1186/1748-717X-3-21
Received: 29 April 2008
Accepted: 28 July 2008
This article is available from: />© 2008 Schuring and Hurkmans; licensee BioMed Central Ltd.
This is an Open Access article distributed under the terms of the Creative Commons Attribution License ( />),
which permits unrestricted use, distribution, and reproduction in any medium, provided the original work is properly cited.
Radiation Oncology 2008, 3:21 />Page 2 of 8
(page number not for citation purposes)
inhomogeneity corrections assuming the patient has unit
density [4], while in the Japanese JCOG 0403 trial a wide
variety of inhomogeneity correction algorithms were
allowed [5].
Planning algorithms can roughly be separated in (a) ones
which do not take into account changes in lateral electron
transport (pencil beam-like algorithms) and (b) ones that
do take into account these changes (convolution-superpo-
sition type algorithms) [6]. In the type-a algorithms the
effects of inhomogeneities are accounted for by applying
a correction based on equivalent pathlength (EPL), like
the Batho or ETAR correction. In the type-b algorithms
changes in the lateral transport are modeled in an approx-
imate way, and several studies have shown these algo-
rithms to be more accurate for dose calculations in regions
with inhomogeneities [7,5,8]. In particular, the collapsed-
cone convolution-superposition algorithm in most cases
shows satisfactory agreement with Monte Carlo simula-
tions in the case of inhomogeneous targets [9,10]. The
Monte Carlo algorithms can be seen as the current gold
standard for these types of dose calculations.
Several authors have studied the influence of inhomoge-
neity corrections on dose distributions specifically for
stereotactic treatments of lung cancer [7,11-14]. Com-
pared to conventional radiotherapy larger deviations can
be expected due to the small field sizes used for treating
these tumors. Most studies concentrated on creating a
treatment plan using a type-a pencil beam algorithm, and
recalculating the plans with a type-b algorithm or using
Monte Carlo simulations, mostly for a small number of
patients with relatively large tumors or on a phantom. All
these studies have shown a significant overestimation of
the target dose when using pencil-beam calculations.
In this study, the influence of inhomogeneity corrections
on the dose distributions was investigated for a large
group of patients with small stage I lung cancer tumors.
These results are e.g., important for the correct interpreta-
tion of previous clinical trials and for the definition of
planning criteria for new clinical trials of this treatment,
and are being used for designing a Dutch multicenter ran-
domized phase-III trial comparing SBRT with surgery for
stage-I NSCLC (ROSEL trial).
Materials and methods
Respiration-correlated CT and target delineation
All patients in this study received a respiration-correlated
4D-CT using a Philips Brilliance Big Bore CT prior to treat-
ment. The 4D-CT was reconstructed in ten equally spaced
time bins using phase binning. From these phases, a max-
imum intensity projection (MIP) was reconstructed. The
datasets were then imported in the Pinnacle
3
treatment
planning system (Philips Medical Systems, Wisconsin).
Using the MIP dataset, an experienced radiation oncolo-
gist delineated the internal target volume (ITV). The GTV
was delineated on the CT dataset of the maximum inhale
phase; tumor mobility was determined by translating the
delineated GTV from this phase to the maximum exhale
phase. Organs at risk were delineated on an average-den-
sity CT reconstruction. As dictated by the RTOG 0236 pro-
tocol, no ITV to CTV margin was applied [4]. The PTV was
created by expanding the ITV with a 3 mm margin to
account for setup uncertainties in accordance with the
protocol used in by Lagerwaard et al [3].
Patient characteristics
Twentysix consecutive patients with non-small cell lung
cancer (NSCLC) were included. All patients had solitary
stage-I tumors, were medically inoperable and were
treated at our institute with SBRT. A summary of the volu-
metric and motion characteristics of these tumors is
shown in Table 1. The median, 25%, 50%, 75% and
100% percentile values for the PTV were 29.4, 15.8, 29.4,
40.2, and 107.6 cm
3
, respectively.
Treatment planning
The treatment plans consisted of 9 equally spaced copla-
nar 6 MV beams. Beams consisting of 2 segments were not
allowed to enter through the esophagus, heart, spinal cord
or contralateral lung. The plans were inversely optimized
using the direct aperture optimization module of the
Pinnacle
3
treatment planning system. Dose calculations
were performed on an average-density CT using a 3 × 3 ×
3 cm dose calculation grid size.
Plans were optimized until 95% of the PTV received the
prescription dose of 60 Gy in 3 fractions (according to
RTOG 0236), and more than 99% of the PTV received
90% of the prescribed dose (54 Gy). No limitations to the
maximum dose were applied within the PTV as highly
inhomogeneous dose distributions are commonly
accepted in stereotactic treatments. Objectives were added
to ensure that the prescription isodose closely conforms to
the PTV and the dose to healthy lung tissue was mini-
mized. The goal was to keep the fraction of healthy lung
receiving more than 20 Gy (V
20 Gy
) below 10%. For the V
20
Gy
, both lungs minus the ITV were delineated, in accord-
ance with the RTOG protocol. Maximum dose to the spi-
nal cord was limited to 18 Gy, to the esophagus to 27 Gy,
and to the heart to 30 Gy. To prevent the generation of
very small segments the minimum beam segment area
was set to 4 cm
2
, but generally the segment area was sig-
nificantly larger. The minimum number of monitor units
per segment was limited to 50 MU to ensure that the deliv-
ery time at least covers one breathing cycle. All plans con-
sisted of 9 beams with in total generally 18 segments and
in a few cases 17 segments.
Radiation Oncology 2008, 3:21 />Page 3 of 8
(page number not for citation purposes)
Three different plans were created. The first treatment plan
was optimized using full inhomogeneity corrections using
the CC algorithm. A second plan was created assuming all
tissues within the body to have unit density (UD), in
accordance with the RTOG 0236 protocol. The third plan
was optimized while only accounting for the decreased
attenuation of the primary photons, thus resembling an
equivalent pathlength (EPL) correction that is incorpo-
rated in less advanced dose calculation algorithms. These
plans will be referred to as the CC, UD and EPL plans
respectively. For all patients, these three plans were opti-
mized until all planning criteria were met. A small renor-
malization was applied to all plans to ensure that they had
exactly identical PTV coverage (60 Gy to 95% of the PTV).
Next, the UD and EPL plans were copied and recalculated
without re-optimization using the collapsed-cone algo-
rithm.
For each plan the maximum, minimum and mean dose to
the PTV was determined, as well as the dose received by
95% (D
95
) and 99% (D
99
) of the PTV, and the isocenter
dose. Conformality of the PTV coverage was evaluated by
the ratio of the volume of the prescription isodose (60 Gy)
and the PTV (V
100%
/V
PTV
). For evaluation of the low dose
spillage, the ratio of the 50% isodose volume (30 Gy) and
the PTV was calculated (V
50%
/V
PTV
). The influence on lung
dose was studied by scoring the lung volume receiving 20
Gy, 10 Gy (V
10 Gy
) and the mean lung dose (MLD). For all
the other organs at risk, no further analysis was done as
these received doses far below the tolerance dose by
choosing appropriate beam arrangements. All differences
in dosimetric parameters were tested using a paired-sam-
ple t-test.
Results
Planned dose distributions
For all three calculation algorithms, clinically acceptable
treatment plans could be obtained for all patients (Table
2). The dose received by 99% of the PTV volume is slightly
lower for the CC plans (58.5 Gy) compared to the UD
(58.8 Gy) and EPL plans (58.8 Gy). Figure 1 shows a box-
and-whisker plot of the ratio of the volume of the pre-
scription isodose and the PTV, which is a measure for the
conformity of a plan. The conformity for the UD and EPL
plans was slightly better compared to the CC plans,
although this difference was only statistically significant
for the CC and EPL plans. The RTOG criterion (V
100%
/V
PTV
< 1.2) could however be met by all treatment plans except
for 3 patients with very small tumors having a minor vio-
lation (V
100%
/V
PTV
< 1.4).
The maximum dose for the CC plans is considerably
higher than for the other two (Figure 2). Dose homogene-
ity in the target area was less for the CC plans, as the effects
of tissue inhomogeneities were better accounted for. The
broadening of the dose distribution is reflected in the
ratio of the volume of the 50% isodose and the PTV (V
50%
/
V
PTV
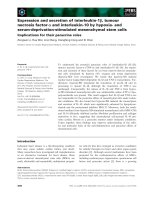
) which is plotted as a function of the PTV in Figure 3.
For the UD and EPL plans, significantly lower ratios were
attainable (a mean value of 6.3 for both plans versus 8.4
for the CC plans). Figure 3 also shows that low-dose con-
formity decreased with decreasing PTV volume, especially
for the CC plans.
Regarding the dose to the healthy lung tissue, the V
20 Gy
for
the CC plans was on average 15% and 21% higher as the
Table 2: Mean values and the range of dosimetric data for the different treatment plans as planned and recalculated using
CC UD EPL
Planned Planned p-value Recalculated p-value Planned p-value recalculated p-value
D
95
[Gy] 60.0 60.0 - 56.9 [42.1–63.4] 0.007 60.0 - 48.0 [34.6–56.1] < 0.001
D
99
[Gy] 58.5 [57.6–59.5] 58.8 [57.8–59.8] < 0.001 54.5 [39.6–62.0] < 0.001 58.8 [58.1–59.7] < 0.001 45.9 [32.6–53.7] < 0.001
D
isoc
[Gy] 74.3 [66.0–84.1] 66.6 [62.5–71.3] < 0.001 72.7 [59.3–79.6] 0.19 67.1 [63.2–72.2] < 0.001 61.7 [47.9–70.1] < 0.001
D
mean
[Gy] 66.9 [64.1–71.0] 64.1 [61.6–66.6] < 0.001 65.0 [49.1–71.0] 0.11 64.3 [61.8–66.4] < 0.001 55.2 [39.7–62.1] < 0.001
D
max
[Gy] 75.6 [67.8–87.4] 68.1 [63.0–73.3] < 0.001 73.8 [61.3–81.7] 0.17 68.5 [63.8–76.5] < 0.001 62.9 [48.0–74.2] < 0.001
V
100%
/V
PTV
1.13 [0.98–1.38] 1.09 [0.98–1.25] 0.14 0.98 [0.01–1.45] 0.08 1.09 [1.03–1.22] 0.026 0.27 [0.00–0.71] < 0.001
V
50%
/V
PTV
8.4 [4.5–18.2] 6.3 [4.4–12.6] < 0.001 6.6 [4.9–12.2] 0.006 6.3 [4.1–12.0] < 0.001 4.8 [3.1–6.5] < 0.001
V
20 Gy
[%] 6.6 [2.9–16.7] 5.6 [2.2–14.2] < 0.001 6.0 [2.3–15.5] 0.017 5.2 [2.1–12.3] < 0.001 4.1 [1.5–10.9] < 0.001
V
10 Gy
[%] 13.7 [7.3–35.8] 12.1 [5.9–29.9] < 0.001 13.1 [6.1–33.5] 0.038 12.0 [5.5–29.5] < 0.001 10.9 [4.6–27.3] < 0.001
MLD [cGy] 456 [257–941] 396 [203–828] < 0.001 439 [223–905] 0.18 394 [205–738] < 0.001 355 [183–683] < 0.001
full inhomogeneity corrections, and the p-values for the paired-sample t-test comparing the UD and EPL calculated and recalculated plans to the CC
plan.
Table 1: Patient characteristics of the group of 26 patients used
in this study.
Characteristics Mean value (range)
GTV (cm
3
) 13.9 [0.7–50.4]
ITV (cm
3
) 19.3 [1.4–64.1]
PTV (cm
3
) 37.3 [5.5–107.6]
V
ITV
/V
GTV
1.6 [1.0–2.7]
Peak-to-peak amplitude (cm) 0.8 [0.0–3.0]
Lung volume (cm
3
) 4942 [2720–8786]
Radiation Oncology 2008, 3:21 />Page 4 of 8
(page number not for citation purposes)
planned UD and EPL values, respectively (Table 2). For
the mean lung dose, the UD and EPL plans both achieved
a 13% lower value compared to the CC plan.
Dose to target and critical organs after recalculation
The influence of recalculating the UD and EPL plans with
the CC algorithm on the dose distribution for an individ-
ual patient is illustrated in Figure 4. The shape of the dose
distribution changed significantly, leading to unwanted
high dose regions, possibly endangering critical structures
like the ribs or hilar vessels.
The dose covering 95% of the PTV for the recalculated
plans as a function of the PTV is plotted in Figure 5. The
EPL plans consistently overestimate the dose to the PTV,
resulting in an average D
95
of 48 Gy, 20% lower than the
prescribed value. For one patient, a dose of 35 Gy was
even observed, 43% lower than planned. The overestima-
tion of the dose increased with decreasing PTV size,
although large variations are observed between individual
patients. For the UD calculations the recalculated plans on
average had a slightly lower D
95
of 57 Gy, with values
ranging between 63 and 42 Gy for individual patients. No
correlation was found with PTV size. For the other dosi-
metric parameters (D
99
, D
isoc
, D
mean
) similar results are
found as for D
95
(Table 2). For the maximum dose, larger
values were found for the recalculated plans (Figure 6).
Changes in PTV coverage were also reflected in V
100%
/V
PTV
(Figure 7), with a significant decrease of this ratio for the
EPL plans and also a small though not statistically signif-
icant decrease for the UD plans. Again, large variations
between patients were especially visible for the UD plans,
with ratios ranging from 0.01 to 1.45.
For the recalculated UD plans, the mean V
20 Gy
was signif-
icantly different from the CC plans (6.0 versus 6.6%), and
large variations per patient existed. For the EPL plans the
mean V
20 Gy
was significantly lower, with a mean value of
4.1%. The recalculated V
20 Gy
is plotted against the
planned V
20 Gy
for the UD and EPL plans in Figure 8. These
plots were fitted using linear regression, the resulting fit
parameters can be found in table 3. A strong dependency
existed between planned and recalculated values (R
2
=
0.99 and 0.96 for UD and EPL plans, respectively)
Ratio of the volume of the 50% isodose and the PTV as a function of PTV for the three plans before recalculationFigure 3
Ratio of the volume of the 50% isodose and the PTV
as a function of PTV for the three plans before recal-
culation.
0 20 40 60 80 100 120
0
5
10
15
20
CC plan
UD plan
EPL plan
50% PTV
PTV [cm
3
]
Box-and-whisker plot of the conformity index for the opti-mized plan using full CC calculation, with unit density (UD) and with an equivalent pathlength (EPL) correctionFigure 1
Box-and-whisker plot of the conformity index for the
optimized plan using full CC calculation, with unit
density (UD) and with an equivalent pathlength
(EPL) correction.
CC plan UD plan EPL plan
0.9
1.0
1.1
1.2
1.3
1.4
1.5
100% PTV
Box-and-whisker plot of the maximum dose for the opti-mized plans before recalculationFigure 2
Box-and-whisker plot of the maximum dose for the
optimized plans before recalculation.
CC plan UD plan EPL plan
40
50
60
70
80
90
max
Radiation Oncology 2008, 3:21 />Page 5 of 8
(page number not for citation purposes)
although a reasonable amount of scatter is visible. For the
V
10 Gy
and mean lung dose even stronger correlations were
found between planned and recalculated values (Table 3).
The recalculated V
10 Gy
was about 8% higher for the UD
plans, and 8% lower for the EPL plans, for the MLD an
11% increase and 10% decrease was found, respectively.
Discussion
In this study it was demonstrated that the use of different
inhomogeneity corrections during the planning of stereo-
tactic lung RT treatments has a large impact on the dose
distribution to the target area and healthy lung tissue. The
separation into two types of algorithms (a and b) as men-
tioned in the introduction is of course a simplification of
the differences that exist between the various clinically
implemented algorithms. The comparison between the
EPL and CC algorithms presented here can be seen as a
good quantitative analysis of the differences that can be
found between type a and b algorithms. However, slightly
different results are expected if two other (implementa-
tions of) type a and b algorithms would have been used.
The dose criteria as prescribed in the RTOG 0236 trial [4]
have been based on calculations assuming unit density of
the patient. For the algorithms accounting for the effect of
the increased lateral range of the electrons and scattered
photons, these criteria are often harder to fulfill as the
penumbras tend to be broadened.
Dose coverage of the recalculated plans varied widely
among different patients. The dose to 95% of the PTV for
the plans optimized with unit density ranged from 30%
lower to slightly higher than planned for individual
patients. A simple rescaling of the planned dose to the
actual dose given to the patient is thus not possible, mak-
ing a recalculation of the plan with accurate dose calcula-
tions necessary.
Box-and-whisker plot of the maximum dose after recalcula-tion of the unit density and EPL planFigure 6
Box-and-whisker plot of the maximum dose after
recalculation of the unit density and EPL plan. The
results from the CC plan are plotted for comparison.
CC plan UD plan EPL plan
40
50
60
70
80
90
max
Example of the planned and recalculated dose distribution for the UD (top) and EPL (bottom) calculation for a single patientFigure 4
Example of the planned and recalculated dose distri-
bution for the UD (top) and EPL (bottom) calcula-
tion for a single patient. Note the much higher dose to
the hilar structure in the recalculated UD plan and the much
lower dose coverage in the recalculated EPL plan.
Dose to 95% of the PTV as a function of the PTV as deter-mined using the CC calculationFigure 5
Dose to 95% of the PTV as a function of the PTV as
determined using the CC calculation.
0 20406080100120
0
10
20
30
40
50
60
70
CC plan
UD plan
EPL plan
95
PTV [cm
3
]
Radiation Oncology 2008, 3:21 />Page 6 of 8
(page number not for citation purposes)
The overestimation of the dose using the EPL algorithm
seen in all patients varies with increases tumorsize, lung
density and location. This type of algorithm is still widely
used in clinical practice, and has also been used by Lager-
waard et al. who recently presented clinical results of more
than 200 patients with NSCLC [3]. The possible overesti-
mation of the dose given to the tumor should be consid-
ered when interpreting the results from this clinical study.
In a study by Haedinger et al.[12] the stereotactic treat-
ments from 33 lung cancer patients planned with a pencil
beam algorithm were recalculated using a CC algorithm.
These authors found a smaller overestimation of the dose
given to the target using a pencil beam algorithm. This
might in part be explained by the planning itself, as the
PTV coverage in their work was often higher than the 95%
used in this study. Another important difference is the
PTV sizes considered in their study, with a median value
of 122 cc compared to 29 cc in our study, which is more
representative for patients suitable for this treatment. As a
result smaller fieldsizes were used in our study, resulting
in a larger overestimation of the dose.
As the UD and EPL calculations do not account for the
increased lateral electron range, recalculation of the plans
results in an increase of the low-dose region (V
20 Gy
, V
10 Gy
)
in the lungs. On the other hand the algorithms often
underestimate the required number of MUs due to lateral
electron disequilibrium. As a result, the plans optimized
with unit density calculations tend to underestimate the
dose to the healthy lung (V
20 Gy
, V
10 Gy
and MLD), and the
EPL plans overestimate it. In accordance with De Jaeger et
al. [15] a correlation was found between planned and
recalculated values for the lung dose. As this study deals
with much smaller target volumes compared to the ones
used by De Jaeger, lateral electron disequilibrium is more
dominant, resulting in different correlations than the
ones found by these authors. In contrast, Chang et al did
not find a difference between V20 Gy values calculated for
heterogeneity corrected and UD plans [16]. However, they
predominately used simple anteroposterior/posterior-
anterior fields and irradiated much larger lung volumes,
as can be derived from their high V20 values in combina-
tion with their dose prescriptions. This again might
explain the difference found between our results, using
stereotactic radiotherapy to treat relatively small target
volumes and the results derived by Chang et al. With yet
another beam set-up, namely for breast irradiation, Brink
Table 3: Correlation between planned and recalculated values for the lung volume receiving 20 Gy, 10 Gy and the mean lung dose.
Unit density EPL
Parameter Correlation R
2
-value Correlation R
2
-value
V
20 Gy
1.12·V
20 Gy, planned
- 0.24 0.994 0.85·V
20 Gy, planned
- 0.35 0.957
V
10 Gy
1.08·V
10 Gy, planned
- 0.05 0.996 0.92·V
10 Gy, planned
- 0.07 0.979
MLD 1.11·MLD
planned
- 0.998 0.90·MLD
planned
0.999
Box-and-whisker plot of the conformity index for the UD and EPL plans after recalculation with full inhomogeneity cor-rectionsFigure 7
Box-and-whisker plot of the conformity index for the
UD and EPL plans after recalculation with full inho-
mogeneity corrections. The results from the collapsed-
cone calculation are plotted for comparison.
CC plan UD plan EPL plan
0.0
0.3
0.6
0.9
1.2
1.5
100% PTV
Recalculated lung volume receiving 20 Gy or more versus planned value for the unit density and EPL plansFigure 8
Recalculated lung volume receiving 20 Gy or more
versus planned value for the unit density and EPL
plans.
0 2 4 6 8 10 12 14 16
0
2
4
6
8
10
12
14
16
UD plan
EPL plan
20Gy
V
20Gy
(planned) [%]
y = 1.12*x - 0.24, R
2
= 0.99
y = 0.85*x - 0.35, R
2
= 0.96
Radiation Oncology 2008, 3:21 />Page 7 of 8
(page number not for citation purposes)
et al. also found significant differences between algo-
rithms in deriving optimal radiation pneumonitis NTCP
values [17]. Thus, it might be concluded that differences
between algorithms in calculating lung dose do exist. The
extent of the deviation depends on the algorithms and
irradiation techniques investigated.
Although Monte Carlo simulations are considered to be
the gold standard in the presence of inhomogeneities, the
collapsed cone algorithm has proven to be reasonably
accurate. Krieger and Sauer did find up to 10% difference
between CC and Monte-carlo calculations. However,
these deviations were found using a slab geometry phan-
tom and single beam set-up which does not resemble a
clinical set-up very well. Furthermore, the authors indicate
that part of these errors might be explained by an incorrect
choice of the CC parameters [9]. In most situations, accu-
racy in the order of 2 to 5% is obtainable, meaning that
inaccuracies in the CC dose calculations are much smaller
than the differences observed in this study, and can be
considered as a reasonably accurate representation of the
actual dose given to the patient [18,17,10].
Maybe even more important, the collapsed cone algo-
rithms have now become widely available in clinical prac-
tice, while the use of Monte Carlo treatment planning is
still very limited. Thus, the CC results presented here can
be used to generate optimization criteria in clinical prac-
tice, while this would be less straightforward for results
based on Monte-Carlo calculations.
Conclusion
The implications of the results in this study are twofold. In
the first place, planning dose criteria are often easier
achieved with plans created using simple dose calculation
algorithms, which should be considered in study designs
involving multiple institutions using different planning
systems. Secondly, the actually delivered dose to the
tumor can significantly deviate from the planned value
when not using appropriate inhomogeneity corrections.
As large variations exist in the actual dose per individual
patient, clinical studies evaluating the effectiveness of this
treatment should rely on the most accurate dose calcula-
tion which is clinically available at the time, or at least ret-
rospectively re-evaluate the actual dose given to the target.
Fortunately, the dose to the healthy lung tissue calculated
with a simple algorithm can retrospectively easily be recal-
culated using the correlation parameters derived in this
study. Before clinical introduction, the fractionation
scheme and dose optimization procedure should be very
well tailored to the calculation algorithm and TPS one
uses clinically.
Authors' contributions
DS was responsible for study design, carried out treatment
planning, analysis of data and results, and writing and
editing the manuscript, CWH worked on study design,
analysis of data and results, and writing and editing the
manuscript. All authors have read and approved the final
manuscript.
Acknowledgements
The authors would like to thank Marjan Admiraal and Gert Meijer for fruit-
ful discussions. Philips Medical Systems is gratefully acknowledged for pro-
viding some of the 4D-CT capabilities within the context of a research
agreement. Part of this work has been presented at the annual ESTRO
meeting in 2007.
References
1. Onishi H, Shirato H, Nagata Y, Hiraoka M, Fujino M, Gomi K, Niibe
Y, Karasawa K, Hayakawa K, Takai Y, Kimura T, Takeda A, Ouchi A,
Hareyama M, Kokubo M, Hara R, Itami J, Yamada K, Araki T: Hypof-
ractionated stereotactic radiotherapy (HypoFXSRT) for
stage I non-small cell lung cancer: updated results of 257
patients in a Japanese multi-institutional study. J Thorac Oncol
2007, 2:S94-100.
2. Timmerman R, Papiez L, McGarry , Likes L, DesRosiers C, Frost S,
Williams M: Extracranial stereotactic radioablation - results of
a phase I study in medically inoperable stage I non-small cell
lung cancer. Chest 2003, 124:1946-1955.
3. Lagerwaard FJ, Haasbeek CJA, Smit EF, Slotman BJ, Senan S: Out-
comes of risk-adapted fractionated stereotactic radiother-
apy for stage I non-small-cell lung cancer. Int J Radiat Oncol Biol
Phys 2008, 70:685-692 [ />S0360301607044689].
4. Timmerman RD, Michalski J, Galvin J, Fowler JF, Choy H, gore E, john-
stone D: RTOG 0236: A phase II trial of stereotactic body
radiation therapy (SBRT) in the treatment of patients with
medically inoperable stage I/II non-small cell lung cancer.
RTOG; 2006.
5. Nishio T, Kunieda E, Shirato H, Ishikura S, Onishi H, Tateoka K,
Hiraoka M, Narita Y, Ikeda M, Goka T: Dosimetric verification in
participating institutions in a stereotactic body radiotherapy
trial for stage I non-small cell lung cancer: Japan clinical
oncology group trial (JCOG0403). Phys Med Biol 2006,
51:5409-5417.
6. Knöös T, Wieslander E, Cozzi L, Brink C, Fogliata A, Albers D, Nys-
tröm H, Lassen S: Comparison of dose calculation algorithms
for treatment planning in external photon beam therapy for
clinical situations. Phys Med Biol 2006, 51:5785-5807.
7. Lax I, Panettieri V, Wennberg B, Amor DM, Naslund I, Baumann P,
Gagliardi G: Dose distributions in SBRT of lung tumors: Com-
parison between two different treatment planning algo-
rithms and Monte-Carlo simulation including breathing
motions. Acta Oncol 2006, 45:978-988.
8. Jones AO, Das IJ: Comparison of inhomogeneity correction
algorithms in small photon fields. Med Phys 2005, 32:766-776.
9. Krieger T, Sauer OA: Monte Carlo- versus pencil-beam-/col-
lapsed-cone-dose calculation in a heterogeneous multi-layer
phantom. Phys Med Biol 2005, 50:859-868.
10. Fogliata A, Nicolini G, Vanetti E, Clivio A, Winkler P, Cozzi L: The
impact of photon dose calculation algorithms on expected
dose distributions in lungs under different respiratory
phases. Phys Med Biol 2008, 53:2375-2390.
11. Ding GX, Duggan DM, Lu B, Hallahan DE, Cmelak A, Malcolm A,
Newton J, Deeley M, Coffey CW: Impact of inhomogeneity cor-
rections on dose coverage in the treatment of lung cancer
using stereotactic body radiation therapy. Med Phys 2007,
34:2985-2994.
12. Haedinger U, Krieger T, Flentje M, Wulf J: Influence of calculation
model on dose distribution in stereotactic radiotherapy for
pulmonary targets. Int J Radiat Oncol Biol Phys 2005, 61:239-249.
13. Panettieri V, Wennberg B, Gagliardi G, Duch MA, Ginjaume M, Lax I:
SBRT of lung tumours: Monte Carlo simulation with PENE-
LOPE of dose distributions including respiratory motion and
comparison with different treatment planning systems. Phys
Med Biol 2007, 52:4265-4281.
14. Hansen AT, Petersen JB, Hoyer M, Christensen JJ: Comparison of
two dose calculation methods applied to extracranial stere-
Publish with BioMed Central and every
scientist can read your work free of charge
"BioMed Central will be the most significant development for
disseminating the results of biomedical research in our lifetime."
Sir Paul Nurse, Cancer Research UK
Your research papers will be:
available free of charge to the entire biomedical community
peer reviewed and published immediately upon acceptance
cited in PubMed and archived on PubMed Central
yours — you keep the copyright
Submit your manuscript here:
/>BioMedcentral
Radiation Oncology 2008, 3:21 />Page 8 of 8
(page number not for citation purposes)
otactic radiotherapy treatment planning. Radiother Oncol 2005,
77:96-98.
15. de Jaeger K, Hoogeman MS, Engelsman M, Seppenwoolde Y, Damen
EFM, Mijnheer BJ, Boersma LJ, Lebesque JV: Incorporating an
improved dose-calculation algorithm in conformal radio-
therapy of lung cancer: re-evaluation of dose in normal lung
tissue. Radiother Oncol 2003, 69:1-10.
16. Chang DT, Olivier KR, Morris CG, Liu C, Dempsey JF, Benda RK,
Palta JR: The impact of heterogeneity correction on dosimet-
ric parameters that predict for radiation pneumonitis. Int J
Radiat Oncol Biol Phys 2006, 65:125-131.
17. Brink C, Berg M, Nielsen M: Sensitivity of NTCP parameter val-
ues against a change of dose calculation algorithm. Med Phys
2007, 34:3579-3586.
18. Vanderstraeten B, Reynaert N, Paelinck L, Madani I, de Wagter C, de
Gersem W, de Neve W, Thierens H: Accuracy of patient dose
calculation for lung IMRT: A comparison of Monte Carlo,
convolution/superposition, and pencil beam computations.
Med Phys 2006, 33:3149-3158.