Báo cáo khoa học: " Remarks on reporting and recording consistent with the ICRU Reference Dose" potx
Bạn đang xem bản rút gọn của tài liệu. Xem và tải ngay bản đầy đủ của tài liệu tại đây (298.15 KB, 13 trang )
BioMed Central
Page 1 of 13
(page number not for citation purposes)
Radiation Oncology
Open Access
Research
Remarks on reporting and recording consistent with the ICRU
Reference Dose
Klaus Bratengeier*, Markus Oechsner, Mark Gainey and Michael Flentje
Address: Klinik und Poliklinik für Strahlentherapie, University of Würzburg Josef-Schneider-Str. 11, 97080 Würzburg, Germany
Email: Klaus Bratengeier* - ; Markus Oechsner - ;
Mark Gainey - ; Michael Flentje -
* Corresponding author
Abstract
Background: ICRU 50/62 provides a framework to facilitate the reporting of external beam
radiotherapy treatments from different institutions. A predominant role is played by points that
represent "the PTV dose". However, for new techniques like Intensity Modulated Radiotherapy
(IMRT) - especially step and shoot IMRT - it is difficult to define a point whose dose can be called
"characteristic" of the PTV dose distribution. Therefore different volume based methods of
reporting of the prescribed dose are in use worldwide. Several of them were compared regarding
their usability for IMRT and compatibility with the ICRU Reference Point dose for conformal
radiotherapy (CRT) in this study.
Methods: The dose distributions of 45 arbitrarily chosen volumes treated by CRT plans and 57
volumes treated by IMRT plans were used for comparison. Some of the IMRT methods distinguish
the planning target volume (PTV) and its central part PTV
x
(PTV minus a margin region of × mm).
The reporting of dose prescriptions based on mean and median doses together with the dose to
95% of the considered volume (D
95
) were compared with each other and in respect of a
prescription report with the aid of one or several possible ICRU Reference Points. The correlation
between all methods was determined using the standard deviation of the ratio of all possible pairs
of prescription reports. In addition the effects of boluses and the characteristics of simultaneous
integrated boosts (SIB) were examined.
Results: Two types of methods result in a high degree of consistency with the hitherto valid ICRU
dose reporting concept: the median dose of the PTV and the mean dose to the central part of the
PTV (PTV
x
). The latter is similar to the CTV, if no nested PTVs are used and no patient model
surfaces are involved. A reporting of dose prescription using the CTV mean dose tends to
overestimate the plateau doses of the lower dose plateaus of SIB plans. PTV
x
provides the
possibility to approach biological effects using the standard deviation of the dose within this volume.
Conclusion: The authors advocate reporting the PTV median dose or preferably the mean dose
of the central dose plateau PTV
x
as a potential replacement or successor of the ICRU Reference
Dose - both usable for CRT and IMRT.
Published: 14 October 2009
Radiation Oncology 2009, 4:44 doi:10.1186/1748-717X-4-44
Received: 22 July 2009
Accepted: 14 October 2009
This article is available from: />© 2009 Bratengeier et al; licensee BioMed Central Ltd.
This is an Open Access article distributed under the terms of the Creative Commons Attribution License ( />),
which permits unrestricted use, distribution, and reproduction in any medium, provided the original work is properly cited.
Radiation Oncology 2009, 4:44 />Page 2 of 13
(page number not for citation purposes)
Background
ICRU 50 and ICRU 62 provide a framework which struc-
tures the reporting of external beam radiotherapy treat-
ments from different institutions [1,2]. These reports refer
to conventional conformal radiation techniques (CRT).
Within that framework, the definition of points that rep-
resent "the PTV dose", "prescription dose" or "intended
dose" plays a predominant role.
Since then, new techniques like Intensity modulated radi-
otherapy (IMRT) have been introduced. Early IMRT could
only create more inhomogeneous dose distributions, as it
was shown by Bratengeier et al. for head and neck studies
[3]. Even if today IMRT can be planned more homogene-
ously, the positioning of a point whose dose can be called
"characteristic" of the planning target volume (PTV) is
regarded as difficult, if not ambiguous. Therefore the def-
inition of the ICRU Reference Point has become problem-
atic. Previous work like that of Kukolowicz et al. has to be
revised for application to IMRT [4]. As a result of the loss
of significance of the ICRU Reference Point, a plurality of
volume based dose concepts are currently contending,
such as the mean dose to the PTV (PTV D
mean
) and the
clinical target volume CTV (CTV D
mean
), the dose to 95%
of the PTV (PTV D
95
) and others [5-7]. The IMRT Collab-
orative Working Group recommended the reporting of
"Prescribed (intended) dose, as well as the point or vol-
ume to which it is prescribed; Dose that covers 95%
(D95) of the PTV and CTV. Dose that covers 100%
(D100) of the PTV and CTV (i.e., the minimal dose).
Mean and maximal doses within the PTV and CTV. Per-
centage of the PTV and CTV that received the prescribed
dose (V100) " [8]. A recent ASTRO recommendation
added some further details to be recorded - i.e. D
mean
, D
0
,
D
95
, D
100
, V
100
in PTV and CTV additional to the "pre-
scribed dose" [9].
Often the PTV D
95
is used as prescribed dose because it is
supposed to be a dose prescription regarding biological
aspects [7]. This is popular in studies of the Radiation
Therapy Oncology Group
®
(RTOG
®
), i.e. the protocols
0022, 0522, 0615, 0619. This procedure differs from the
ICRU Reference Dose concept and the correlation of these
two concepts is unclear.
For that reason, the authors examined different volume
based definitions. In particular, their consistency with the
currently valid "ICRU Reference Dose" (ICRU RD, the
dose at the ICRU Reference Point) is investigated. In par-
ticular the ratio of the dose defined by several possible
ICRU Reference Points and the dose defined by the differ-
ent reporting procedures is investigated for the same plan.
Moreover, the correlation of the pairwise application is
explored by calculating the standard deviation of these
ratios for all plans and target volumes. Definitions are
applied to classical (forward planning) CRT plans and to
IMRT-plans. Additionally, simultaneous integrated boost
(SIB) IMRT cases were considered, in which nested dose
plateaus are formed [10]. To describe the dose to a plateau
and to exclude effects of a dose gradient at the border of
each volume, the authors preferred to define volumes that
are distant to each other. This condition cannot be ful-
filled by the clinical target volume (CTV) in the cases of
SIB.
Methods
In this retrospective study, treatment planning was per-
formed on a Philips Pinnacle3™ version 8.0 m planning
system (Philips Radiation Oncology Systems, Fitchburg,
Wi, USA). Siemens Primus™ (Siemens Healthcare, Erlan-
gen, Germany) and Elekta Synergy™ (with BeamModula-
tor™; Elekta AB, Stockholm, Sweden) linacs were
commissioned with 10 mm or 4 mm leaf width (in the
isocentre), respectively. The CT slice distance was 3 or 5
mm. A dose grid size of between 2 and 4 mm was chosen.
The step and shoot IMRT plans are optimised by the Ray-
search™ direct machine parameter optimisation (DMPO)
module, a direct aperture optimisation (DAO) method
[11]. Not more than 50 segments per plan were used.
IMRT plans were irradiated with 7, or (mostly) 9 equidis-
tant beams or 10 non-equidistant fields (breast cases)
[12]. The dose distribution was calculated using a col-
lapsed cone algorithm.
The patient data were randomly selected from the normal
clinical routine. 70 patients with different tumour locali-
sations and a total of 102 treatment plans were examined.
12 plans resulted from technique changes; 24 plan vari-
ants resulted from the application or removal of a bolus.
For CRT 38 patients with several localizations were cho-
sen (i.e. 10 head and neck cases, 9 tumours of the abdo-
men, 7 breast patients with 2 plan each, 4 metastases). 37
patient models with 57 target volumes were used for IMRT
techniques (i.e. 19 head and neck patients, 10 breast
patients). 6 MV photons were applied for breast, head and
neck tumours, 10 MV or 18 MV for the tumours of the
abdomen.
Volume definitions and methods of dose prescription and
reporting
All volumes came from clinical practice and were ran-
domly selected. Only one planning target volume was
changed for the sake of this study. In addition to the clin-
ical target volume (CTV) and the planning target volume
PTV we defined a "PTV
x
" in which the volume is shrunk by
an amount × mm, and maintains a distance of × mm
towards air. It should be noted that for SIB the nested
PTVs abut each other. PTV
x
then excludes the high dose
area just as the low dose areas of the PTV. This volume is
designated as the "central target volume". It is used to
describe the plateau dose. It comprises, depending on the
choice of x, approximately the clinical target volume
Radiation Oncology 2009, 4:44 />Page 3 of 13
(page number not for citation purposes)
(CTV) in the non-SIB cases. Contrary to the CTV it is
designed to contain all the points that eventually would
be allowed to be chosen as ICRU dose prescription points;
the points from the CTV or PTV from the dose gradient
area towards an inner PTV would not comply with that
condition. PTV shells that are generated using a margin of
less than 2× around an inner target volume would not
form a dose plateau and PTV
x
is not defined for the outer
PTV ring. This situation will be addressed in the discus-
sion section. For this planning study x = 5 mm was
selected, a distance that is frequently chosen to avoid sur-
face effects [13]. In all conventional cases and 22 IMRT-
cases only one PTV exists. In 15 IMRT-cases 35 nested tar-
get volumes were selected and simultaneously irradiated
(SIB) [10]. The target volumes are fundamentally non-
overlapping. Therefore, for SIB they abut one another. The
extension of the volumes is presented in Table 1.
For breast cases, IMRT was only used to replace CRT if the
PTV was extremely curved and standard fields included
large lung areas, or if the volumes included mammaria
interna lymph nodes. The mean volume for IMRT breast
cases was therefore larger than for CRT.
In this study the arithmetic mean and median averages of
the dose distribution in the PTV and PTV
5
were evaluated.
In addition D
95
in PTV and PTV
5
were determined. Their
relationships were calculated for a plurality of ICRU Ref-
erence Points selected according to ICRU criteria. For the
conventional plans 236 points were used which were
acceptable ICRU reference points, for the IMRT plans 340
points. The ICRU Reference Point criteria are: "(1) the
dose to the point should be clinically relevant; (2) the
point should be easy to define in a clear and unambigu-
ous way; (3) the point should be selected so that the dose
can be accurately determined; (4) the point should be in
a region where there is no steep dose gradient." [2]. The
commission added: "These recommendations will be ful-
filled if the ICRU reference point is located: - always at the
centre (or in a central part) of the PTV, "
Table 1: Overview
Non-breast Breast with bolus Breast without bolus
CRT IMRT CRT IMRT CRT IMRT
Single PTV SIB
Central
PTV
SIB
Circumferential
PTV
n3147 12 15 20 14 10 14 10
Vol [cm
3
]PTV837
546
430
471
918
671
124
76
367
212
1240
467
1576
1100
1240
467
1576
1100
PTV
5
512
383
202
311
522
471
42
37
127
96
797
349
1042
823
797
349
1042
823
σ
D
/D
mean
[%]
PTV 4.4
2.0
3.9
1.8
4.0
1.5
2.2
0.7
5.0
1.7
3.9
0.9
4.5
1.1
7.0
0.9
9.0
1.3
PTV
5
2.3
0.7
2.1
0.7
2.1
0.7
1.6
0.6
2.5
0.6
2.9
0.6
2.8
0.7
2.7
0.6
3.1
0.7
D
min
/D
mean
[%]
PTV 48.4
33.7
51.2
35.0
31.1
37.3
81.9
16.7
40.2
28.7
23.7
24.0
41.4
21.7
0
0
2.5
4.2
PTV
5
85.8
10.7
88.3
17.6
85.2
21.6
95.4
1.7
84.7
20.6
92.0
2.3
85.7
7.6
86.6
2.3
81.0
4.9
D
max
/D
mean
[%]
PTV 109.6
4.5
111.9
6.8
109.4
3.2
106.9
2.6
117.0
7.0
111.7
3.0
114.3
3.3
112.3
3.0
116.7
3.0
PTV
5
108.3
4.3
108.4
4.5
107.4
2.7
104.9
2.1
111.8
4.5
110.3
2.6
112.4
3.5
109.6
2.6
112.4
3.4
n: Number of volumes with related plans. Mean values of Volumes (Vol). Standard deviations of the dose distributions σ
D
, dose minima and maxima
(D
min
, D
max
), divided by the mean doses (D
mean
) within PTVs and PTV shrunk by 5 mm (PTV
5
) for several groups of plans (CRT: Conformal
radiotherapy, IMRT: Intensity modulated radiotherapy; SIB: Simultaneous Integrated Boost). The upper value in each cell is the mean value; the
lower value is the corresponding standard deviation
Radiation Oncology 2009, 4:44 />Page 4 of 13
(page number not for citation purposes)
In almost all cases, four such points are positioned in the
central part of each target volume. If possible, one of these
points was placed in the centre in the central plane of the
PTV. For IMRT plans with single PTVs, additionally the
isocentre was chosen as fifth point. The other points were
arbitrarily placed in areas which seemed homogeneous.
The minimum distance between the points was 1 cm, 0.5
cm for SIB PTVs. The dose to the isocentre and the mean
dose of the other four possible ICRU Reference Points
were compared.
Furthermore the standard deviations of the doses in the
PTV and PTV
5
were determined. Keeping in mind that D
0
(= maximum dose) and D
100
(= minimum dose) can be
defective, these values are provided as additional informa-
tion.
Subgroups of patients are created to allow a cross-check of
the data.
Effects of SIB and surface effects
The characteristics of the 15 head and neck SIB plans were
evaluated. These cases were sorted according to their
topology: The central PTV and the (one or two) circumfer-
ential PTVs.
Surface effects at the patient model surface can drastically
change even for a slight change of the outline. The behav-
iour of the different prescription and reporting methods
in such situations was investigated by quantifying the
effect of the removal of the bolus for configurations which
were initially planned and optimized with bolus. In clini-
cal practice, a bolus can be removed or added according to
the skin reaction. The prescription must not change in an
other way as the dose to the central points in the PTV (just
as for ICRU Reference Points). The breast patients were
especially evaluated: Their PTV is near to the patient out-
line. Thus they are particularly suited to examine surface
effects. On the one hand the dose prescription reporting
using the PTV and the PTV
x
were compared. On the other
hand the influence of using a bolus of 5 mm thickness
covering the whole breast was tested both for CRT and
IMRT. The bolus was generated by the planning system
not considering loose contact to the skin as often can be
observed in clinical practice. Hence, in the breast group
two extremes are compared, because in clinical practice
neither such a perfect bolus is available nor would the
cases with skin involvement be irradiated without a bolus.
Results
Plan quality parameters
The relative standard deviation of the doses in the PTV
(PTV
5
, respectively) was 4.4% (2.3%) for the CRT non-
breast plans, 7.0% (2.7%) for the breast plans without
bolus and 3.9% (2.9%) for the same plans with a bolus
over the whole breast (see also Table 1). The influence of
the surface on the PTV standard deviation can clearly be
seen, whereas the standard deviation of PTV
5
is not
affected. For IMRT, the relative standard deviation of the
dose in the PTV (PTV
5
) was 3.9% (2.1%) for the non-
breast plans, 9.0% (3.1%) for the breast plans without
bolus and 4.5% (2.8%) for the same plans with bolus
(Table 1). This result is similar to that for the CRT-plans,
indicating that for step and shoot IMRT using DMPO sim-
ilar dose homogeneity could be achieved as for the CRT
plans, although the PTV shape was more complex. A
detailed view of the IMRT results shows differences for the
inner PTV (σ
D
= 2.2% (1.6%)) and the annular PTV shells
(σ
D
= 5.0% (2.5%)). For the latter, the standard deviation
and hence dose homogeneity suffers especially in the PTV
from the additional dose gradient towards the inner target
volumes. These findings were similar, if CTV was used
instead of PTV
x
for nested volumes: the standard deviation
increased by a factor of 1.5, (for 3 of 26 volumes by more
than a factor of 2; details see below).
The minimum doses for CRT were around 31% (86%) in
relation to the prescription dose, for IMRT 44% (86%)
with large standard deviations of 33% (10%) and 34%
(16%), respectively. (not shown in the tables). However,
these results can largely be influenced by PTV delineation,
surface effects, grid size and dose calculation algorithm.
The isocentres in the single PTV IMRT cases were used to
control the adequate setting of the arbitrary chosen ICRU
reference points. The mean value of their doses differed by
a factor of 0.9995 and the standard deviations were 2.2%
and 2.4%, respectively. This indicates a reasonable ICRU
Reference Point positioning in this work.
Comparison of prescription and reporting methods
Table 2 correlates some volume based prescription and
reporting methods and a selection of allowed ICRU Refer-
ence Points with an ICRU Reference Dose (RD) for non-
breast plans. The first row of each cell is the ratio of the
method of a column and to that of a row, averaged over
all cases. In the second row the respective standard devia-
tion of this average process is presented which indicates
the dispersion of the data. Ratios of the reported dose for
an identical dose distribution can be compared using the
upper and the lower part of the table for CRT and IMRT,
respectively. ICRU RD (case-mean) is the dose to the
mean value of all chosen examples of an ICRU Reference
Point of each case, finally averaged over all cases. In the
right column, ICRU RD, the average of all normalized
ICRU Dose Points of all cases is presented to show the sta-
tistical dispersion if different single points are used to rep-
resent a dose distribution.
The standard deviation of the ratio ICRU RD/ICRU RD
(case-mean) - last row, right column - is a measure of the
statistical dispersion of the dose at the chosen ICRU Ref-
Radiation Oncology 2009, 4:44 />Page 5 of 13
(page number not for citation purposes)
erence Points within a volume, a measure of the correla-
tion among the chosen points. This value should be
improved upon by any method which competes with the
point based methods. Standard deviations of 1.3% and
2.3% for the ICRU RD point to point correlations are
found for all CRT plans and all IMRT plans, respectively
(not shown in the tables). They should also be considered
as benchmarks for the correlation of the ICRU RD with
any other reporting method: the standard deviations over
all plans were 1.5% and 1.4% for PTV
5
D
mean
, 1.6% and
1.8% for PTV D
median
, 1.9% and 2.6% for PTV D
mean
, 1.7%
and 2.2% for PTV
5
D
95
, 4.3% and 5.9% for PTV D
95
(CRT
and IMRT, respectively). For the first three reporting meth-
ods, the average quotient with the reporting using the
ICRU Reference Point was biased by less than 0.6% (when
using all CRT and IMRT plans), whereas the quotient for
PTV
5
D
95
was 96% and for PTV D
95
92%. The D
95
values
should be compared with an independent evaluation in
the author's clinic over 350 patients: there a value of
94.3% for a mixture of both PTV groups was achieved.
A cross-check of dose reporting concepts for the breast
cases (with bolus; Table 3) and for non-breast, single PTV
IMRT (Table 4) reveals almost the same results. Only the
dose was slightly more homogeneous for single PTV IMRT
(Table 1). Consequently, the correlation of one ICRU Ref-
erence Point with the mean value of all possible ICRU Ref-
erence Points expressed by the standard deviation was
Table 2: Correlation of prescriptions (non-breast cases)
denominator\numerator PTV
D
Mean
PTV
5
D
Mean
PTV
D
95
PTV
5
D
95
ICRU
RD
(Case-Mean)
ICRU
RD
[%] [%] [%] [%] [%] [%]
CRT
n = 35
PTV D
Median
99.5
0.4
100.4
0.6
92.4
2.9
96.6
1.0
99.9
1.4
99.9
1.8
PTV D
Mean
100.9
0.7
92.8
2.9
97.1
1.2
100.5
1.7
100.5
2.0
PTV
5
D
Mean
92.0
3.1
96.2
1.0
99.5
1.5
99.5
1.8
PTV D
95
104.7
3.1
108.3
4.0
108.0
4.2
PTV
5
D
95
103.5
1.8
103.4
2.1
ICRU RD (Case Mean) 100.0
1.1
IMRT
n = 47
PTV D
Median
100.0
0.8
100.5
1.0
94.7
2.3
97.2
1.5
100.3
1.7
100.3
2.7
PTV D
Mean
100.5
1.5
94.7
2.4
97.3
1.9
100.3
2.1
100.4
3.0
PTV
5
D
Mean
94.3
2.2
96.8
1.1
99.7
1.3
99.7
2.4
PTV D
95
102.6
2.0
107.0
2.8
107.0
3.5
PTV
5
D
95
103.0
1.8
103.0
2.7
ICRU RD (Case Mean) 100.0
2.1
Correlation of several prescription and reporting methods. All methods report for the same dose distribution per study. Non-breast cases. The
upper value in each cell is the mean value; the lower value is the corresponding standard deviation. ICRU RD: ICRU Reference Dose; PTV
5
: PTV
shrunk by 5 mm; Case mean: Mean value of four (IMRT with a single PTV: five) points suitable for dose description according to ICRU 50/62
Radiation Oncology 2009, 4:44 />Page 6 of 13
(page number not for citation purposes)
2.0% for non breast IMRT in a single PTV (not shown in
the tables) compared with 2.6% for breast IMRT (Table 3).
For non-breast plans the reporting using PTV D
median
, PTV
D
mean
and PTV
5
D
mean
led to comparable results with
respect to the mean of the ICRU Reference Doses. The
larger standard deviations for the ICRU RD reflect the fluc-
tuation due to the choice of the position of the ICRU Ref-
erence Point. The results for CRT and IMRT are quite
similar.
D
min
was not presented in the tables because the standard
deviation of the correlation to other methods was always
above 10% for D
min
of PTV
5
and even exceeded 30% for
D
min
of PTV.
Detailed data for subgroups of non-breast IMRT are
shown in Table 4. Here 12 patients with a single PTV are
differentiated from patients with SIB. For the latter, the 15
central volumes and the 20 circumferential volumes were
distinguished. Only volumes with distances of at least 5
mm to the patient model outline or plans with boluses
were considered.
For SIB IMRT, the dose ratio (PTV
5
mean dose) of the
outer to the adjacent inner volume was 0.89 (0.82 up to
0.93) for the cases with 2 volumes, 0.87 (0.78 up to 0.92)
for cases with 3 nested volumes (outer volume pair) and
0.96 (0.94 0.99) (inner volume pair). Comparing the
standard deviations of PTV
5
and CTV for the related outer
volumes, the standard deviation of the dose distributions
increased for the CTV by a factor of 1.49, 1.86 and 1.08,
respectively. The mean dose to the CTV increased with
respect of the mean dose to the PTV
5
was by a factor of
1.018, 1.019 and 1.005, respectively. Selecting the volume
pairs with PTV
5
mean dose differences of more than 9%
(10% up to 22%) between inner and outer PTV, led to
CTV/PTV
5
dose ratios of 1.029; the ratio of the CTV/PTV
5
standard deviations was 2.11 (1.68 to 2.89), respectively.
Table 3 presents the planning results of the breast cases
(CRT: 14 cases; IMRT: 10 cases). The upper part comprises
the cases with 5 mm boluses, whereas the lower part rep-
resents the same cases without a bolus. This table demon-
strates the effect of the extended near-surface areas as
typical for breast patients (the PTV is delineated approach-
ing the patient outline). Similar results were achieved if
the bolus for five non-breast cases was removed (not
shown here, see Fig. 1).
Discussion
Comparison with other published results
Das et al. compared the IMRT practice of five institutions
with differing planning systems [5]. 803 brain, head and
neck and prostate cancer patient plans were evaluated,
with patient group characteristics similar to the non-
breast patient group of this work. The prescription dose
had been correlated with D
min
, D
max
, D
median
and the dose
to the isocentre. Except the median dose all parameters
showed only weak correlation to the prescription dose.
These results agree with the results of this work. In Das'
work, the standard deviation of the ratio of prescription
dose and median dose as a measure of the correlation can
be estimated to be between 2% and 3%. In this work, the
standard deviation of the ratio ICRU RD (single point)
and D
median
was 1.8% for CRT and 2.7% for IMRT plans of
the non-breast cases (Table 2). The latter value was mainly
influenced by SIB cases with onion-skin-like (nested)
PTVs (3.4%). Otherwise the standard deviation was 2.4%
(single PTV) and 1.6% (central PTV in a SIB constellation
- see Table 4). Thus, the results are similar.
Yaparpalvi et al. examined the IMRT plans of 117 patients,
some of them with 3 different IMRT plans [7]. They com-
pared three prescription and reporting methods: the site
specific RTOG guideline, ICRU RD and D
mean
. Their
results showed a strong correlation of D
mean
and ICRU RD
with an estimated
σ
D
of roughly 2% (from Yaparpalvi Fig.
1) and a much weaker correlation of both with the D
95
,
D
97
, D
98
-prescriptions of several RTOG protocols. The
ratio of prescription dose due to the RTOG guidelines and
the ICRU RD was between 103.6% (RTOG 0418, D
97
) and
105.1% (RTOG 0022, D
95
); the latter should be compared
with the non-breast cases of this work (107.0% for all
non-breast IMRT cases; 107.0% and 106.9% for single
and circumferential volumes, 104.0% for the central vol-
ume of a SIB). They also concluded that the D
median
in the
PTV would be a better representation of the ICRU RD than
the D
mean
agrees with the results of this work.
Several meeting contributions have addressed future
ICRU recommendations on dose prescription, recording
and reporting [14,15]: Single point prescription and
reporting will be given up in favour of volume based
methods. It was announced that the median dose would
play a prominent role. This is supported by this work,
although PTV
x
could be a concept of more biological rele-
vance, in combination with the related standard deviation
in this volume (see below).
The use of PTV D
95
The use of D
95
as a substitute or successor for the ICRU RD
would lead to a conversion factor of typical 1.08 ± 0.04
between PTV D
95
and ICRU RD (non-breast plans, Table
2). Such a factor ought to be considered, if the prescrip-
tion specification is changed. i.e. using PTV D
95
instead of
PTV D
mean
without adequate correction of the prescribed
dose would lead to a dose escalation. However, because of
the weakness of the correlation - expressed by the stand-
ard deviation of 2.8 to 4% (see Fig. 2) - such a transforma-
Radiation Oncology 2009, 4:44 />Page 7 of 13
(page number not for citation purposes)
Table 3: Correlation of prescriptions (breast cases surface effects)
denominator\numerator PTV
D
Mean
PTV
5
D
Mean
PTV
D
95
PTV
5
D
95
ICRU
RD
(Case Mean)
ICRU
RD
[%] [%] [%] [%] [%] [%]
with bolus CRT
n = 14
PTV D
Median
99.9
0.3
100.0
0.4
94.1
1.5
95.5
1.4
98.5
1.5
98.5
1.9
PTV D
Mean
100.1
0.3
94.1
1.3
95.6
1.3
98.6
1.4
98.6
1.8
PTV
5
D
Mean
94.1
1.3
95.5
1.1
98.5
1.3
98.5
1.8
PTV D
95
101.6
1.2
104.7
1.8
104.8
2.2
PTV
5
D
95
103.1
1.6
103.2
2.0
ICRU RD (Case Mean) 100.0
1.3
IMRT
n = 10
PTV D
Median
99.5
0.3
100.9
0.3
92.1
2.2
96.4
1.0
100.7
1.1
100.7
2.8
PTV D
Mean
101.4
0.5
92.5
2.0
96.9
1.1
101.2
1.0
101.2
2.2
PTV
5
D
Mean
91.3
2.3
95.6
1.1
99.9
1.0
99.9
2.7
PTV D
95
104.7
2.2
109.5
2.6
109.5
3.6
PTV
5
D
95
104.5
1.7
104.5
3.1
ICRU RD (Case Mean) 100.0
2.5
without bolus CRT
n = 14
PTV D
Median
98.8
0.3
100.6
0.4
88.0
1.5
96.4
1.4
99.3
1.5
99.3
1.9
PTV D
Mean
101.8
0.3
89.0
1.3
97.5
1.3
100.5
1.4
100.4
1.8
PTV
5
D
Mean
87.5
1.3
95.8
1.1
98.7
1.3
98.7
1.8
PTV D
95
109.7
1.2
113.0
1.8
112.7
2.2
PTV
5
D
95
103.0
1.6
103.1
2.0
ICRU RD (Case Mean) 100.0
1.3
Radiation Oncology 2009, 4:44 />Page 8 of 13
(page number not for citation purposes)
tion cannot be recommended in general. D
95
is always
only weakly correlated to the ICRU RD for both, PTV
5
and
particularly for PTV - in contrast to other methods (see Fig.
2b). Even compared with the single point - ICRU RD
Point correlation (with its standard deviation of 2% -
2.5% for IMRT plans) it is more loosely correlated with
former ICRU RD. The conversion of a D
95
prescription
would also be greatly affected by surface effects, as can be
seen for the CRT and IMRT breast cases (varying from 1.04
to 1.25 in Table 3 and similar results for the outer SIB vol-
ume in Table 4).
To compare IMRT results with earlier CRT results and to
assure continuity with respect to former dose prescription,
another substitute for ICRU RD must be provided. PTV
D
95
and PTV D
min
(or D
01
) may be reported as addi-
tional information to describe the homogeneity of the
dose in the PTV. It should be noted that neither the dose
below the D
95
is restricted to the peripheral PTV areas nor
is the depth of a drastic dose reduction below the D
95
restricted by using this prescription and reporting
method. Therefore, usage of D
95
alone, can neither guar-
antee a certain lower limit for a tumour control probabil-
ity nor "an expected clinical outcome of the treatment"
[1]. Dose prescription and description of the plan quality
cannot be achieved with a single parameter. An ASTRO/
AAPM working group recommends three DVH-points to
describe biologically relevant PTV-data of a dose distribu-
tion [16]. Two of the points form the lower and upper
dose limits, the third point should provide the dose "that
covers the target" [16]. However, also mean and median
doses in the PTV or PTV
x
seem to be appropriate candi-
dates to describe the "typical" dose, some of them much
more closely correlated to the ICRU RD, thereby making
CRT and IMRT plans more comparable.
Moreover, for the breast cases (largest standard deviation
relative to the ICRU RD; Table 3) and for some SIB in the
circumferential PTV (not shown in detail), the D
95
pre-
scription depends largely on surface effects (i.e. changes of
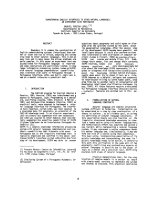
more than 5% for an irradiation with or without a bolus).
The exemplary DVH of a patient with three concentric
head and neck target volumes in Fig. 1 depicts the same
problem. Application of a 5 mm bolus changes the course
of the PTV curve drastically at the low dose limb of the
DVH. Obviously, minor changes in the placement of the
bolus would influence a prescription based on D
95
of the
PTV, although only the peripheral PTV areas are affected.
Similarly, D
95
depends clearly on further parameters. Cen-
tral volumes in our clinical practice tend to have much
lower D
95
to ICRU RD ratios (1.040%, see Table 4) in con-
trast to 107.0% and 106.9% for single or circumferential
PTVs. A prescription and reporting based on central areas
(CTV, PTV
x
) would be much more insensitive with respect
to effects of surface and volume delineation variations.
This article is not intended to determine whether a
D
95
(PTV) or a D
mean
(PTV
x
) prescription would be the bet-
ter method to prescribe tumour control. Both require
more information about the low dose parts in relevant
areas that limit the tumour control probability (TCP) and
hot spots that increase the probability of irreversible dam-
age to healthy tissue. The D
mean
(PTV
x
) approach implies
additional information on the local behaviour of the dose
distribution that is lost in the D
95
concept: as can be seen
below, D
mean
(PTV
x
) together with additional information
IMRT
n = 10
PTV D
Median
97.7
0.7
101.4
1.0
81.5
3.2
96.3
1.4
102.1
1.0
102.1
2.6
PTV D
Mean
103.8
1.4
83.5
2.9
98.6
1.9
104.6
1.5
104.6
2.9
PTV
5
D
Mean
80.4
3.8
95.0
1.0
100.7
0.8
100.7
2.5
PTV D
95
118.3
6.4
125.5
6.1
125.5
6.6
PTV
5
D
95
106.1
1.5
106.1
3.0
ICRU RD (Case Mean) 100.0
2.4
Correlation of several prescription and reporting methods. All methods report for the same dose distribution per study. Breast cases with and
without bolus (upper and lower part, respectively). The upper value in each cell is the mean value; the lower value is the corresponding standard
deviation. ICRU RD: ICRU Reference Dose; PTV
5
: PTV shrunk by 5 mm; Case mean: Mean value of four (IMRT with a single PTV: five) points
suitable for dose description according to ICRU 50/62
Table 3: Correlation of prescriptions (breast cases surface effects) (Continued)
Radiation Oncology 2009, 4:44 />Page 9 of 13
(page number not for citation purposes)
like the standard deviation of the dose distribution allows
linkage to a more biologically based evaluation (see last
section).
Dose fluctuations in the target
The fluctuations of the ICRU RD increase for IMRT as pre-
dicted by several authors [7]: the standard deviation for
the ICRU RD is slightly larger for IMRT plans than for the
CRT techniques, and all correlations of other methods are
weaker for IMRT than for CRT (the standard deviation of
the quotient of the reported results is larger). However, it
should be noted, that the standard deviations of the mean
doses in the PTV and the PTV
x
(σ
D
/D
mean
in Table 1) are
comparable for single PTV IMRT and CRT plans. This
means that the fluctuations of the dose in PTV or PTV
5
as
a whole are comparable for CRT and this special type of
IMRT (IMRT based on the DMPO optimization). Con-
versely, the standard deviations of the ICRU RD from sev-
eral chosen points tend to be smaller for CRT plans than
for IMRT plans ("PTV D
mean
" and "PTV
5
D
mean
" in Table 2,
3 and 4, last column "ICRU RD"). Perhaps this can be
interpreted as if dose fluctuations of classical CRT plans
Table 4: Correlation of prescriptions (non-breast IMRT subgroups - topological aspects)
denominator\numerator PTV
D
Mean
PTV
5
D
Mean
PTV
D
95
ICRU
RD
(Case-Mean)
ICRU
RD
[%] [%] [%] [%] [%]
Single PTV
n = 12
PTV D
Median
99.5
0.3
100.7
0.4
94.1
1.9
100.6
1.3
100.6
2.4
PTV D
Mean
101.2
0.6
94.6
1.8
101.1
1.4
101.1
2.5
PTV
5
D
Mean
93.4
2.1
99.9
1.3
99.9
2.4
PTV D
95
107.0
2.8
107.0
3.5
Central PTV
n = 15
PTV D
Median
100.0
0.3
101.0
0.8
96.5
0.7
100.4
0.8
100.4
1.6
PTV D
Mean
100.9
0.8
96.5
0.8
100.4
0.9
100.4
1.6
PTV
5
D
Mean
95.6
1.3
99.4
0.8
99.4
1.6
PTV D
95
104.0
1.4
104.0
2.0
Circumferential PTV
n = 20
PTV D
Median
99.9
1.3
100.0
1.2
93.6
2.4
100.0
2.2
100.0
3.4
PTV D
Mean
99.8
2.0
93.4
2.7
99.8
2.9
99.8
3.9
PTV
5
D
Mean
93.8
2.4
99.7
1.6
99.7
2.9
PTV D
95
106.9
4.2
106.9
5.0
Correlation of several prescription and reporting methods for subgroups of IMRT plans (non-breast cases) without surface effects (with bolus and
PTV-distance to patient outline > 5 mm). All methods report for the same dose distribution per study. The upper value in each cell is the mean
value; the lower value is the corresponding standard deviation. ICRU RD: ICRU Reference Dose; PTV
5
: PTV shrunk by 5 mm; Case mean: Mean
value of four (IMRT with a single PTV: five) points suitable for dose description according to ICRU 50/62. Central and circumferential volumes
together form the volumes of SIB (2 or 3 nested volumes)
Radiation Oncology 2009, 4:44 />Page 10 of 13
(page number not for citation purposes)
were less concentrated in the areas that were typically cho-
sen for ICRU Reference Points. This underlines the
requirement of a volume integrating prescription and
reporting method for IMRT, even for rather homogeneous
IMRT plan types as used in this work.
It should be noted that the homogeneity of IMRT plans
has continuously increased in the past few years. For head
and neck as well as related cases an extensive exploration
of data from the first IMRT decade had been performed
[3]. Published DVHs (between 1990 and 1998) for realis-
tic cases including scatter and absorption σ
D
was 3.3% up
to 11% of a target with more than 5 mm to the patient
outline, the related mean value of comparable non-IMRT
rotational techniques was 3.1%, classical opposed fields
with electrons reached 6% which should be compared to
a mean of 2.2% for σ
D
of the dose in PTV
5
which are
reached for DMPO in head and neck cases in this work.
Sliding window or volumetric arc techniques should be
able to create even more homogeneous dose distribu-
tions. These results also encourage the use of "non-D
95
"
plans, but prescription and reporting methods with a con-
version factor around 1.00 in relation to the hitherto valid
ICRU RD, if CRT and IMRT plans should be compared.
SIB and surface effects of the PTV and CTV mean dose
The mean dose to the CTV for the outer SIB volumes over-
estimated the plateau dose by 2% (in some cases almost
4%). For these outer PTVs of SIB, the dose gradient
towards the inner PTVs influences the mean dose of the
outer PTV. It raises the mean dose in the CTV, pretending
a higher dose as actually reached in the dose plateau,
whereas the dose overkill near the inner gradient probably
cannot compensate a potential underdosage at the pla-
teau.
This effect depends clearly on the dose difference of inner
and outer volumes and could be relevant for dose differ-
ences of 10% and more; the overestimation of the plateau
dose could exceed 3% if the CTV mean dose would be
used.
For PTV D
mean
an underdose to the peripheral areas and an
overdose to the inner areas could compensate each other.
But this effect depends on the geometry of each individual
case, as can be deduced from the higher standard devia-
tions of PTV D
mean
(Table 4, circumferential volumes),
indicating overestimations and underestimations that
compensate each other averaging PTV D
mean
over all
patients. PTV
x
avoids both problems.
SIB with nested volumes with a thickness of less than or
equal 2× form no dose plateau in the outer PTV (such vol-
umes were not addressed within this work). These SIB
cases cannot be described by a concept equivalent to ICRU
points, because no point can be found which would be
representative for this volume. Such volumes are mostly
described by their minimal dose or concepts like D
99
, D
98
etcetera.
Adding a bolus to a breast plan changes the PTV mean
dose with respect to the ICRU reference dose by 2%. This
is due to surface effects that should actually not influence
the prescription, which should be based on the dose
within the central dose plateau with the highest accumu-
lation of tumour cells. Furthermore, dose calculation
algorithms tend to create erroneous results at the patient
surface. Obviously a dose of 0% as can be seen in table 1
for CRT breast cases is absurd. This topic will not be
addressed here in detail, but clearly such areas should be
omitted when important values as the prescription dose
are to be determined. Similar changes of the PTV mean
dose can be expected due to delineation effects of the PTV
shape [17,18]. The same observation can be made in the
example from Fig. 1: mean values of the central plateau of
each target (PTV
5
) are not affected by using a bolus or not
(right side), whereas manifestly the mean dose of the PTV
itself significantly changes.
In non-SIB cases PTV
x
could resemble CTV, which then
could be alternatively used for prescription and reporting.
However, CTVs with points near the surface should be
chosen with caution. As can be seen in the case of the tis-
sue of the mammary gland for slender patients, CTV
sometimes approaches the outline more closely than 5
mm. The choice of 5 mm is due to the fact that these 5 mm
often are used in daily practice (i.e. Fogliata 2005) [13].
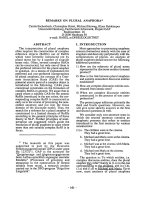
Example of a head and neck IMRT case (not used for quanti-tative evaluation) with three adjacent, nested targets, par-tially abutting the patient outlineFigure 1
Example of a head and neck IMRT case (not used for
quantitative evaluation) with three adjacent, nested
targets, partially abutting the patient outline. DVH for
irradiation with 6 MV photons and bolus (thickness 5 mm):
dashed line. Without bolus: solid line. Left diagram: Three
nested, adjacent, non-overlapping PTV. Right diagram: Three
nested PTV
5
(PTV shrunk by 5 mm). From left to right: Outer
(circumferential) to inner (central) PTV.
0 1 0 2 0 3 0 4 0 5 0 6 0 7 0 8 0 5 0 6 0 7 0 8 0
1 0 0
9 0
8 0
7 0
6 0
5 0
4 0
3 0
2 0
1 0
0
P T V P T V
5
d o s e [ G y ]
v o l u m e [ % ]
Radiation Oncology 2009, 4:44 />Page 11 of 13
(page number not for citation purposes)
In summary, only median dose in the PTV and the mean
dose to the PTV
x
remain in contention to be the worthy
successor of the ICRU RD. Both were mutually strongly
correlated (standard deviation of the quotient of about
1%) and could be converted using a factor of 1.00.
Additional advantages and disadvantages of the mean
dose in PTV
x
The definition of PTV
x
includes the set of all points which
can be chosen as ICRU Reference Points as a subset. Per-
haps, PTV
x
could even be interpreted as the set of all
points that could possibly be chosen as ICRU Reference
Points. Therefore, the close correlation to the special
choice of ICRU Reference Points in this work is not sur-
prising. The x = 5 mm margin ensures that all points are
within a dose plateau and not near to the steep dose gra-
dient at the borders of the PTV. In several cases, PTV
5
includes about 58% (32% to 73%) of the PTV volume for
the CRT and 41% (7% to 77%) for the IMRT cases. Fur-
thermore, all the excluded voxels are supposed to have a
lower tumour cell density than the centre of the PTV,
which includes the CTV. Due to the mean value theorem
for integration, the mean value of PTV
x
can be represented
by one or more points within the plateau PTV
x
of the PTV.
This is not necessarily so for a D
95
prescription - not even
in the majority of cases. If a prescription point ought to be
defined, it should be placed at the border of the PTV near
to the steep dose gradients. (Only for IMRT plans with
dose gaps in the centre of the PTV- that is for bad plans - a
reference dose point representing the prescription dose
could be placed somewhere in the central PTV area.)
In contrast to the prescription and reporting based on the
median dose which is regarded as a relevant method, the
mean value of PTV
x
could be a base for later biological
interpretations with diverse biological models [5,14].
Brahme demonstrated that the pair of mean value and
standard deviation σ
D
of the dose in a volume with con-
stant tumour cell density provides the possibility of the
subsequent approximate recalculation of tumour control
probabilities or equivalent doses with arbitrary biological
models [19]. (PTV
x
is a better approximation of such a vol-
ume than PTV with its much smaller tumour cell densities
in the periphery.) Bleher et al. calculated a σ
D
correction
of the tumour control probability for a known "homoge-
neous dose" probability curve TCP(D) [20]:
TCP D TCP D k D
eff D
( ) ()exp( () )=⋅−⋅
s
2
(1a)
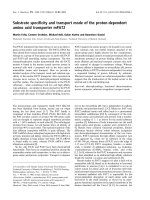
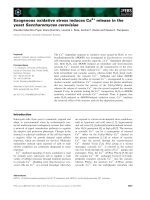
Correlation of several prescription and reporting methods (all related to ICRU RD, the mean value of 4 or 5 points fulfilling the ICRU 52/60 Reference Dose criteria) with the ratio of the prescriptions PTV
5
D
mean
/ICRU RD (PTV
5
D
mean
: mean dose for the central part of the PTV)Figure 2
Correlation of several prescription and reporting methods (all related to ICRU RD, the mean value of 4 or 5
points fulfilling the ICRU 52/60 Reference Dose criteria) with the ratio of the prescriptions PTV
5
D
mean
/ICRU
RD (PTV
5
D
mean
: mean dose for the central part of the PTV). Results for all plans of the study. All methods report for
the same dose distribution per study. Circles: All IMRT plans and related volumes. Triangles: All CRT plans used in this study.
left: PTV
5
D
mean
vs. PTV D
95
(dose to 95% of the PTV). middle: PTV
5
D
mean
vs. PTV D
median
. (median dose for the PTV) right:
PTV
5
D
mean
vs. PTV D
mean
(mean dose of the PTV).
C R T
I M R T
0 . 9 5 1 . 0 51 . 0 0 0 . 9 5 1 . 0 51 . 0 00 . 9 5 1 . 0 51 . 0 0
1 . 0 0
0 . 9 5
0 . 9 0
0 . 8 5
1 . 0 5
0 . 8 0
0 . 7 5
P T V
5
D
m e a n
/ I C R U R D
P T V D
9 5
/ I C R U R D
P T V D
m e a n
/ I C R U R D
P T V D
m e d i a n
/ I C R U R D
P T V
5
D
m e a n
/ I C R U R D
P T V
5
D
m e a n
/ I C R U R D
Radiation Oncology 2009, 4:44 />Page 12 of 13
(page number not for citation purposes)
The first non-trivial non-zero term of a Taylor-series
around D = D
mean
(PTV
x
) with
The definition of PTV
x
additionally allows the evaluation
of D
min
of the dose in the central PTV area - PTV
x
- and the
standard deviation
σ
D
of the dose therein. Both are useful
to control the dose homogeneity in the most important
part of the PTV. For the whole PTV, potential dose inho-
mogeneities in the centre are covered by the dominating
dose inhomogeneities at the periphery, which is caused by
uncertainties of the PTV definition or uncertainties in the
dose calculation (dose grid, surface effects). Therefore,
D
min
and σ
D
of the PTV are less meaningful than D
min
and
σ
D
of the CTV or PTV
x
. Such information - PTV
x
D
min
and
σ
D
- is routinely used in our clinic for automatic control of
these aspects of plan quality. In our institution, σ
D
< 3.3%
is striven for to avoid relevant TCP-reductions due to
inhomogeneity. For
γ
= 3 (the steepness of TCP-curve) and
σ
D
< 3.5% Brahme estimated a decrease of 5% for the TCP.
An additional advantage of the mean dose in the PTV
x
is
the additivity of mean doses in contrast to median doses
or D
95
, albeit the biologically equivalent doses cannot
simply be summed up.
Some limitations of the D
mean
(PTV
x
) concept should not
be concealed. For example for stereotactic treatments,
dose inhomogeneity may be intended. This inhomogene-
ity is not arbitrary. The hot spots for small volumes are
preferably in the central CTV. Commonly minimal doses
(D
100-y
with small y) in the CTV and PTV together with
maximum doses (D
z
with small z) are reported. All these
prescription values are relevant. Nevertheless even in the
case of stereotactic irradiations, a wider plateau with steep
gradient near the PTV edge and a sharply peaked dose dis-
tribution with less steep gradient could be delivered with
the same specific data as stated above, although the
former dose distribution would obviously provide the
better TCP. The additional use of D
mean
(PTV
x
) would
reveal the differences of both plans.
As a further disadvantage it should be noted that PTV
x
is
currently not in usage (as long as it is not chosen identical
with the CTV). Additionally the choice of x (x = 5 mm in
this work) is arbitrary.
If the usage of PTV
x
is considered to be too arbitrary, a
"modified CTV" could be used as a compromise: A CTV
reduced by margins to other CTVs in the vicinity.
Conclusion
"The dose to the patient", formerly represented by the
ICRU Reference Point, continues to play a prominent role
in daily practice (i.e. the doctor's letter). In contrast the
intended additional values in ICRU 62 [2], the expanded
framework of these recommendations, sometimes tend to
be in the background - all the more reason that a careful
and coherent definition of this dose term is performed.
As successor for the ICRU Reference Point, equally usable
for IMRT and CRT, the authors recommend the median
dose to the PTV or - preferably - the mean dose to the
PTV
x
, the central plateau. Both are "near" to the physical
dose distribution and provide a consistent extension of
the ICRU Reference Dose (strong correlation and conver-
sion factor ≈ 1.00). Mean doses to CTV and PTV do not to
such an extent. Usage of PTV
x
D
mean
adds the possibility of
using of the standard deviation in the PTV
x
for later evalu-
ation of tumour control probabilities. Moreover it pro-
vides further parameters, which control the homogeneity
of the target (like standard deviation and minimal dose to
the central plateau).
Competing interests
The authors declare that they have no competing interests.
Authors' contributions
KB was responsible for the primary concept and the
design of the study; he compiled the results and drafted
the manuscript; MO evaluated most of the results; MG
critically accompanied the study and revised the manu-
script; MF was responsible for the patients, reviewed
patient data and revised the manuscript. All authors read
and approved the final manuscript.
Acknowledgements
This work was in part supported by the German Research Foundation
(Deutsche Forschungsgemeinschaft - DFG Project Code DFG BR 3460/2).
This work was in part used for oral presentation at the 11th World Con-
gress on Medical Physics and Biomedical Engineering, Munich 2009.
References
1. ICRU: Prescribing, recording, and reporting photon beam
therapy. In ICRU report Volume 50. Bethesda: International Commis-
sion on Radiation Units and Measurements; 1993.
2. ICRU: Prescribing, recording, and reporting photon beam
therapy (supplement to ICRU report 50). In ICRU Report Vol-
ume 62. Bethesda: International Commission on Radiation Units and
Measurements; 1999.
3. Bratengeier K, Pfreundner L, Flentje M: Radiation techniques for
head and neck tumors. Radiotherapy and Oncology 2000,
56:209-220.
4. Kukolowicz PF, Mijnheer BJ: Comparison between dose values
specified at the ICRU reference point and the mean dose to
the planning target volume. Radiother Oncol 1997, 42:271-277.
5. Das IJ, Cheng CW, Chopra KL, Mitra RK, Srivastava SP, Glatstein E:
Intensity-modulated radiation therapy dose prescription,
recording, and delivery: patterns of variability among institu-
kD
TCP D TCP D TCP D
TCP D
D
()
’( ) ( ) ’’( )
()
.=
−⋅
⎡
⎣
⎢
⎢
⎤
⎦
⎥
⎥
2
2
(1b)
Publish with BioMed Central and every
scientist can read your work free of charge
"BioMed Central will be the most significant development for
disseminating the results of biomedical research in our lifetime."
Sir Paul Nurse, Cancer Research UK
Your research papers will be:
available free of charge to the entire biomedical community
peer reviewed and published immediately upon acceptance
cited in PubMed and archived on PubMed Central
yours — you keep the copyright
Submit your manuscript here:
/>BioMedcentral
Radiation Oncology 2009, 4:44 />Page 13 of 13
(page number not for citation purposes)
tions and treatment planning systems. J Natl Cancer Inst 2008,
100:300-307.
6. Willins J, Kachnic L: Clinically relevant standards for intensity-
modulated radiation therapy dose prescription. J Natl Cancer
Inst 2008, 100:288-290.
7. Yaparpalvi R, Hong L, Mah D, Shen J, Mutyala S, Spierer M, Garg M,
Guha C, Kalnicki S: ICRU reference dose in an era of intensity-
modulated radiation therapy clinical trials: correlation with
planning target volume mean dose and suitability for inten-
sity-modulated radiation therapy dose prescription. Radiother
Oncol 2008, 89:347-352.
8. Purdy JA: Intensity-modulated radiotherapy: current status
and issues of interest. Int J Radiat Oncol Biol Phys 2001, 51:880-914.
9. Holmes T, Das R, Low D, Yin FF, Balter J, Palta J, Eifel P: American
Society of Radiation Oncology recommendations for docu-
menting intensity-modulated radiation therapy treatments.
Int J Radiat Oncol Biol Phys 2009, 74:1311-1318.
10. Mohan R, Wu Q, Manning M, Schmidt-Ullrich R: Radiobiological
considerations in the design of fractionation strategies for
intensity-modulated radiation therapy of head and neck can-
cers. Int J Radiat Oncol Biol Phys 2000, 46:619-630.
11. Earl MA, Shepard DM, Naqvi S, Li XA, Yu CX: Inverse planning for
intensity-modulated arc therapy using direct aperture opti-
mization. Phys Med Biol 2003, 48:1075-1089.
12. Bratengeier K, Meyer J, Flentje M: Pre-segmented 2-Step IMRT
with subsequent direct machine parameter optimisation - a
planning study. Radiat Oncol 2008, 3:38.
13. Fogliata A, Nicolini G, Alber M, Asell M, Dobler B, El-Haddad M, Har-
demark B, Jelen U, Kania A, Larsson M, Lohr F, Munger T, Negri E,
Rodrigues C, Cozzi L: IMRT for breast. a planning study. Radi-
other Oncol 2005, 76:300-310.
14. Grégoire V, Mackie TR: ICRU committee on volume and dose
specification for prescribing, recording and reporting special
techniques in external photon beam therapy: conformal and
IMRT. Radiotherapy and Oncology 2005, 76:
S71.
15. Wambersie A, DeLuca P, Gahbauer R, Whitmore G: Recent devel-
opments of the ICRU Program in Radiation Therapy: "Pre-
scribing, Recording and Reporting Modern Treatment
Modalities: IMRT, Cervix Brachytherapy, Proton- and Ion-
Beam Treatment. Radiotherapy and Oncology 2006, 81:S117-S118.
16. Galvin JM, Ezzell G, Eisbrauch A, Yu C, Butler B, Xiao Y, Rosen I,
Rosenman J, Sharpe M, Xing L, Xia P, Lomax T, Low DA, Palta J:
Implementing IMRT in clinical practice: a joint document of
the American Society for Therapeutic Radiology and Oncol-
ogy and the American Association of Physicists in Medicine.
Int J Radiat Oncol Biol Phys 2004, 58:1616-1634.
17. Ketting CH, Austin-Seymour M, Kalet I, Unger J, Hummel S, Jacky J:
Consistency of three-dimensional planning target volumes
across physicians and institutions. Int J Radiat Oncol Biol Phys
1997, 37:445-453.
18. Lawton CA, Michalski J, El-Naqa I, Kuban D, Lee WR, Rosenthal SA,
Zietman A, Sandler H, Shipley W, Ritter M, Valicenti R, Catton C,
Roach M 3rd, Pisansky TM, Seider M: Variation in the Definition
of Clinical Target Volumes for Pelvic Nodal Conformal Radi-
ation Therapy for Prostate Cancer. Int J Radiat Oncol Biol Phys
2008, 72:377-382.
19. Brahme A: Dosimetric precision requirements in radiation
therapy. Acta Radiol Oncol 1984, 23:379-391.
20. Bleher M, Bratengeier K, Richter J: Assessment of radiotherapy
plans: dose-volume histograms, integral effects and tumor
control. Strahlenther Onkol 1991, 167:220-226.