Báo cáo y học: " Forced mobilization accelerates pathogenesis: characterization of a preclinical surgical model of osteoarthriti" docx
Bạn đang xem bản rút gọn của tài liệu. Xem và tải ngay bản đầy đủ của tài liệu tại đây (5.02 MB, 15 trang )
Open Access
Available online />Page 1 of 15
(page number not for citation purposes)
Vol 9 No 1
Research article
Forced mobilization accelerates pathogenesis: characterization
of a preclinical surgical model of osteoarthritis
C Thomas G Appleton
1,2
, David D McErlain
3,4
, Vasek Pitelka
1,2
, Neil Schwartz
5
,
Suzanne M Bernier
1,6
, James L Henry
5
, David W Holdsworth
3,4,7
and Frank Beier
1,2
1
CIHR Group in Skeletal Development & Remodeling, Schulich School of Medicine & Dentistry, The University of Western Ontario, London, Ontario,
N6A 5C1, Canada
2
Department of Physiology & Pharmacology, Schulich School of Medicine & Dentistry, The University of Western Ontario, London, Ontario, N6A 5C1,
Canada
3
Imaging Research Laboratories, Robarts Research Institute, London, Ontario, N6A 5C1, Canada
4
Department of Medical Biophysics, Schulich School of Medicine & Dentistry, The University of Western Ontario, London, Ontario, N6A 5C1, Canada
5
Micheal G DeGroote Institute for Pain Research & Care, McMaster University, Hamilton, Ontario, L8S 4L8, Canada
6
Department of Anatomy & Cell Biology, Schulich School of Medicine & Dentistry, The University of Western Ontario, London, Ontario, N6A 5C1,
Canada
7
Department of Diagnostic Radiology & Nuclear Medicine, Schulich School of Medicine & Dentistry, The University of Western Ontario, London,
Ontario, N6A 5C1, Canada
Corresponding author: Frank Beier,
Received: 6 Dec 2006 Revisions requested: 9 Jan 2007 Revisions received: 17 Jan 2007 Accepted: 6 Feb 2007 Published: 6 Feb 2007
Arthritis Research & Therapy 2007, 9:R13 (doi:10.1186/ar2120)
This article is online at: />© 2007 Appleton et al.; licensee BioMed Central Ltd.
This is an open access article distributed under the terms of the Creative Commons Attribution License ( />),
which permits unrestricted use, distribution, and reproduction in any medium, provided the original work is properly cited.
Abstract
Preclinical osteoarthritis (OA) models are often employed in
studies investigating disease-modifying OA drugs (DMOADs).
In this study we present a comprehensive, longitudinal
evaluation of OA pathogenesis in a rat model of OA, including
histologic and biochemical analyses of articular cartilage
degradation and assessment of subchondral bone sclerosis.
Male Sprague-Dawley rats underwent joint destabilization
surgery by anterior cruciate ligament transection and partial
medial meniscectomy. The contralateral joint was evaluated as a
secondary treatment, and sham surgery was performed in a
separate group of animals (controls). Furthermore, the effects of
walking on a rotating cylinder (to force mobilization of the joint)
on OA pathogenesis were assessed. Destabilization-induced
OA was investigated at several time points up to 20 weeks after
surgery using Osteoarthritis Research Society International
histopathology scores, in vivo micro-computed tomography
(CT) volumetric bone mineral density analysis, and biochemical
analysis of type II collagen breakdown using the CTX II
biomarker. Expression of hypertrophic chondrocyte markers was
also assessed in articular cartilage. Cartilage degradation,
subchondral changes, and subchondral bone loss were
observed as early as 2 weeks after surgery, with considerable
correlation to that seen in human OA. We found excellent
correlation between histologic changes and micro-CT analysis
of underlying bone, which reflected properties of human OA,
and identified additional molecular changes that enhance our
understanding of OA pathogenesis. Interestingly, forced
mobilization exercise accelerated OA progression. Minor OA
activity was also observed in the contralateral joint, including
proteoglycan loss. Finally, we observed increased chondrocyte
hypertrophy during pathogenesis. We conclude that forced
mobilization accelerates OA damage in the destabilized joint.
This surgical model of OA with forced mobilization is suitable for
longitudinal preclinical studies, and it is well adapted for
investigation of both early and late stages of OA. The time
course of OA progression can be modulated through the use of
forced mobilization.
Introduction
Osteoarthritis (OA) is a complex degenerative disease [1-3]
that causes structural changes to articular cartilage and
subchondral bone of synovial joints [4-7]. An understanding of
ACL-T = anterior cruciate ligament transection; CT = computed tomography; DMOAD = disease-modifying osteoarthritis drug; FM = forced mobi-
lized; MFC = medial femoral compartment; MMP = matrix metalloproteinase; MTP = medial tibial plateau; NM = nonmobilized; OA = osteoarthritis;
OARSI = Osteoarthritis Research Society International; PM = partial medial meniscectomy; ROI = region of interest; vBMD = volumetric bone mineral
density.
Arthritis Research & Therapy Vol 9 No 1 Appleton et al.
Page 2 of 15
(page number not for citation purposes)
OA etiopathology, however, has proven to be elusive [2]. Cou-
pled with the fact that OA affects nearly 70% of all people at
some point in their lives, OA has major economic and social
impacts on patients and health care systems [8-10]. Conse-
quently, there is a pressing need to develop disease-modifying
OA drugs (DMOADs).
Before a DMOAD can reach clinical trials, it must first be suc-
cessful in preclinical trials. This requires animal models of OA
in which specific aspects of drug efficacy in articular cartilage,
subchondral bone and other affected tissues may be exam-
ined, as may potential side effects in other organs [11]. Large
animals such as dogs or sheep are sometimes preferred for
these purposes because they provide sufficient amounts of tis-
sue for analysis [12]. However, large animal studies incur high
costs (for instance, housing), which make them impractical for
large-scale screens of multiple compounds. In contrast, small
animals (such as rodents) are more cost-effective than large
ones, and they are well suited to longitudinal preclinical OA
studies. Among these, rats and mice are particularly promising
because of advanced annotation of their genomes and the
remarkable genetic, anatomic, and physiologic similarities
between humans and rodents [13].
Rodent models of OA were first developed in the late 1970s
in mice and rats [14-17]. Initially, experiments employed mod-
els in which OA was induced in the temporomandibular joint
[18-20], but subsequently these models were developed to
involve other synovial joints, including the knee [14]. Either a
chemical method (intra-articular injection of, for instance,
papain [21] or sodium iodoacetate [22]) or a surgical method
(structural alteration to the tendons, muscle, or ligaments [23-
25]) was used. A review by Shwartz [26], published in 1987,
summarizes these early developments. Other models devel-
oped since then rely on genetic predisposition or engineering
to stimulate OA pathology. However, a long time may be
required for OA to develop in genetic models, and there is
often considerable variability between animals (for example, in
the temporal dynamics of OA progression). Disease progres-
sion in surgical models is faster and more consistent. Moreo-
ver, these models reflect post-traumatic (secondary) OA,
because they rely on changes in weight bearing and unnatural
joint articulation for OA etiopathology [27,28].
It is advantageous to develop surgical models in rats or mice
because genetic studies are possible in these animals [29-
31]. Rat models are of interest because their larger size (com-
pared with mice) provides more tissue for biochemical and
gene expression analysis, and permits cross-disciplinary stud-
ies (for example, genomics, cell biology, electrophysiology,
and in vivo small animal imaging) [32]. Models developed in
the rat include anterior cruciate ligament transection (ACL-T)
[33-35] and partial meniscectomy (PM) [36,37], or a combina-
tion of both [38]. Only a few groups have characterized
aspects of rat OA model pathology. For example, Hayami and
coworkers [31] recently assessed the combination of ACL-T
with PM. However, comprehensive longitudinal characteriza-
tion of OA progression, from early to late stages (evaluating
articular and subchondral lesions, volumetric bone mineral
density [vBMD], and biochemical markers of cartilage break-
down), has not been performed. Furthermore, although spe-
cific exercise protocols [35,39] are believed to alter OA
pathogenesis, longitudinal evaluation of forced mobilization
(FM) has never been investigated.
Recent advances in in vivo small animal imaging have allowed
us to quantify changes in subchondral bone over time [32]
(McErlain and coworkers, unpublished data). We have shown
that this model develops OA-like changes in subchondral
bone microarchitecture. However, detailed characterization of
disease progression at multiple levels is required before this
model may be utilized in preclinical DMOAD studies. We also
hypothesized that FM in this model would cause late-stage OA
to develop more quickly, thus accelerating studies targeting
late-stage OA. Here, we report a comprehensive evaluation of
our preclinical surgical model of OA and the effects of FM on
pathogenesis. We used quantitative methods to assess both
cartilage [40-42] and subchondral bone [34,43-45] pathology
in early-stage [31,46] and late-stage [47,48] OA. We antici-
pate that this study will facilitate preclinical trials evaluating
DMOAD efficacy and will be of benefit to those evaluating the
outcomes of subsequent clinical studies.
Materials and methods
Surgical rat model of osteoarthritis
Surgery was performed only on the right knee of weight-
matched male Sprague-Dawley rats (Charles River Laborato-
ries, St. Constant, Quebec, Canada) in the study. Animals
were allowed to reach a body weight of 300 to 325 g before
surgery. Anesthetic (50% ketamine [100 mg/ml], 25% xyla-
zine [20 mg/ml], 10% acepromazine [10 mg/ml], and 15%
saline [0.9% solution]) and Trisbrissen antibiotic (Schering
Canada, Inc., Pointe Claire, Quebec, Canada) were both
administered at a dose of 100 μl per 100 g body weight.
Table 1
Summary of surgical and mobilization treatment groups
Surgical treatment group Number of animals per time point
Nonmobilization groups
Sham 4
Contralateral 4
Ipsilateral 4
Forced mobilization
Sham 4
Contralateral 4
Ipsilateral 4
Available online />Page 3 of 15
(page number not for citation purposes)
The surgical protocol was carried out as follows. Ninety-six
animals were equally divided into one of two treatment groups
(Table 1): sham (control) and OA group. The OA treatment
group underwent open surgery involving anterior cruciate liga-
ment transection (ACL-T) and partial medial meniscectomy
(PM) via an incision on the medial aspect of the joint capsule,
anterior to the medial collateral ligament. Following surgery,
the incision was closed in two layers. The joint capsule was
sutured independently from peripheral tissues using dissolva-
ble 5-0 Vicryl sutures, and the skin closed by interrupted
sutures using 5-0 braided silk (Ethicon, Johnson & Johnson
Medical Products, Markham, Ontario, Canada). This treatment
was used to induce OA pathogenesis, and the operated joint
hereafter is referred to as the 'ipsilateral' treatment. Con-
versely, the left (nonoperated) knee joint is referred to as the
'contralateral' treatment. The second group of rats underwent
a sham operation in which a similar incision in the joint capsule
was made but ACL-T and PM were not performed. Only the
right knees of sham animals were used as controls for disease
progression.
After surgery, all animals were administered antibiotics and
analgesics in accordance with standard operating protocols
established by the Animal Care and Use Committee at the Uni-
versity of Western Ontario. Four animals were used per time
point in each treatment group. These animals first underwent
micro-computed tomography (CT) analysis and were then
killed at 2, 4, 8, 12, 16, or 20 weeks after surgery. Knee joint
tissues were processed for histologic evaluation. Preliminary
micro-CT scans and histology were done on a group of 300 to
325 g animals before surgery. It was found that the 2-week
sham vBMD and histology were similar to those at the presur-
gical time point (data not shown). Animal experiments were
approved by the Animal Care and Use Committee at the Uni-
versity of Western Ontario. All animals used in the study
remained healthy throughout the experiments. None of the ani-
mals exhibited any overt change in feeding behavior or activity
as a result of their surgery. Weight gain over the 5-month time
course was similar in both groups (P = 0.058). The mean body
weights (± standard error) of the nonmobilized group and FM
group were 618.8 ± 13.54 g and 655.3 ± 7.825 g,
respectively.
Forced mobilization protocol
Twenty-four of the animals from both treatment groups (48 ani-
mals) underwent FM, beginning 5 days before surgery to train
the animals. The remaining 24 sham and 24 OA animals did
not undergo FM and are referred to as 'nonmobilized' (NM).
Table 1 summarizes the surgical and mobilization treatments.
Forced mobilization was used to force weight bearing, flexion,
and extension of the knee joint for a given period of time. For
FM experiments, a rotating cylinder apparatus [49,50] was
constructed consisting of a motor-driven rotating cylinder (8
cm diameter) covered with cotton mesh (for grip), which was
divided into lanes and suspended 1 m above the ground (Fig-
ure 1a). The cylinder rotated toward the animals at a rate of 4
rpm. This device forced the animals to flex and extend both
hind-limb knee joints maximally as they walked on the cylinder
(Figure 1b). Each animal completed a 30 min session of FM on
Mondays, Wednesdays, and Fridays each week.
Micro-CT analysis
Micro-CT scanning
In vivo micro-CT using a General Electric Health Care eXplore
Locus scanner (GE Health Care Life Sciences, Baie d'Urfe,
QC, Canada) was carried out at each time point on every ani-
mal, before they were killed and tissues underwent histologic
processing. Animals were anesthetized as described above
and placed in the scanner in a supine position. An epoxy-
based cylinder (1 mm diameter) attached to the limb to be
scanned was used for calibration (SB3; Gamex RMI, Middle-
ton, WI, USA). The X-ray tube has a tungsten target with a
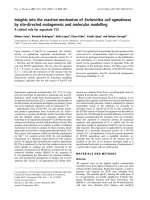
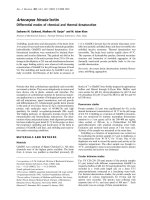
Figure 1
Forced mobilization apparatus and macroscopic analysis of joint degradationForced mobilization apparatus and macroscopic analysis of joint degra-
dation. (a) Following sham (control) or OA surgery, FM animals under-
went forced mobilization. Animals walked on a rotating cylinder for 30
min, three times per week. (b) FM forces the maximal extension and
flexion of the knee joint (white arrow). To assess macroscopic changes
to the articular surface, knee joints were dissected 4 weeks after sur-
gery and photographed. Representative images from sham (c) tibias
and (d) femurs, and ipsilateral (e) tibias and (f) femurs are shown. Sur-
face abrasions (black arrow) and fibrotic tissue (arrow head) were
observed in ipsilateral surfaces, compared with the smooth, glassy
appearance in shams. Scale bar applies to panels c-f. FM, forced mobi-
lization; OA, osteoarthritis.
Arthritis Research & Therapy Vol 9 No 1 Appleton et al.
Page 4 of 15
(page number not for citation purposes)
nominal spot size of 50 μm and 1.8 mm A1-equivalent
filtration. We obtained X-ray acquisition images at 1° incre-
ments over 210°, from a summation of five X-ray projections
(400 ms/exposure) with 80 kVp and 450 μA exposure param-
eters. Each acquired image was subsequently corrected using
a bright-field and dark-field image. Data reconstruction with a
modified Feldkamp conebeam algorithm [51] resulted in three-
dimensional micro-CT images with an isotropic voxel spacing
of 46 μm × 46 μm × 46 μm. Total micro-CT volume was cali-
brated in Hounsfield units, and the total scan time for both hind
limbs was approximately 17 min.
Data analysis with MicroView software
General Electric Health Care MicroView software was used to
analyze the multiplanar reformatted images in axial, coronal,
and sagittal planes. Each scan was monitored quantitatively
for changes in vBMD and qualitatively for the presence of oste-
ophytes, subchondral cysts, and heterotopic ossification.
Using our previously developed spatial sampling method
(McErlain and coworkers, unpublished data), we divided the
joint into two medial compartments: the medial femoral com-
partment (MFC) and medial tibial plateau (MTP). The vBMD for
each compartment was calculated as follows. Each compart-
ment was analyzed using anterior, central, and posterior
regions of interest (ROIs) allowing averaging of three sampling
areas per joint compartment [52]. A primary 'Y' axis was
assigned based on the anterior and posterior margins of each
compartment, and a secondary 'X' axis was assigned based on
the medial and lateral margins of each compartment. A 2 × 4
grid divided the primary 'Y' axis into four quarters and the sec-
ondary 'X' axis into halves. The central ROI was assigned to
the intersection between Y2 and X2. The anterior and poste-
rior ROIs were adjusted to accommodate the natural curvature
of the bones by ensuring that the medial and lateral borders of
each ROI did not extend beyond the bone-tissue interface. The
patellofemoral and tibial tuberosity regions were avoided. The
Z position (depth of the ROI) was set as the minimum distance
between the subchondral and epiphyseal plates and varied
between tibia and femur. ROIs with a diameter of 0.75 mm
were sampled at a depth of 0.85 mm in each tibial compart-
ment and a depth of 1.5 mm in each femoral compartment.
Processing of histologic samples
Four animals from both treatment groups of NM and FM ani-
mals (16 animals) were anesthetized as above before tran-
scardial perfusion first with saline and then 4% with
paraformaldehyde at each time point. The hind limbs were dis-
sected ex vivo above and below the knee joint and placed in a
0.4 M EDTA, 0.3 N NaOH, and 1.5% glycerol (pH 7.3) solu-
tion, which was changed every 3 days, for 4 to 5 weeks of
decalcification (end-point determined by physical assess-
ment). All processing and sectioning of the knee joints was
carried out at the Robarts Research Institute Molecular Pathol-
ogy Laboratory (London, Ontario, Canada). Each joint was
embedded in paraffin wax and sectioned in the sagittal plane
starting from the medial margin of the joint. Serial sections with
a thickness of 6 μm were taken, beginning with the 30th sec-
tion from the medial joint edge. Every fifth section from this
starting point was kept until 40 slides were obtained. Of these,
every fifth slide was selected for staining with 0.1% safranin-
O, 0.02% fast green, and Harris' haematoxylin counterstain-
ing. The site of the partial meniscectomy (the medial joint com-
partment) was selected for analysis in these studies. A total of
eight stained sections per sample, spanning 1.2 mm of each
medial compartment, was used for histologic scoring.
Scoring of histological samples
The Osteoarthritis Research Society International (OARSI)
scoring method [42] was used to assess and compare the
progression of OA in all samples. The grade and stage of both
the tibia and femur were assessed independently in at least
five stained slides from each sample by a blinded observer.
OA score was calculated by multiplication of the grade and
stage values for each slide. A minimum score of 0 indicates no
OA activity and a maximum score of 24 indicates the highest
degree of OA activity in more than 50% of the section, where
OA activity is defined by the presence of OA-like features
including surface discontinuity, loss of proteoglycans, among
other features. The score for each medial compartment joint
surface was assigned by determining the average score of all
slides assessed from that sample. Four replicates per time
point, per treatment, per joint surface (tibial and femoral joint
surfaces were assessed independently) were used to calcu-
late the overall score means.
Assessment of collagen breakdown by CTX II urinalysis
An independent group of animals was used to assess type II
collagen breakdown by quantifying CTX II fragments in urine
[53]. Twenty animals underwent either sham or ACL-T/PMM
(OA) surgery as described above and five animals from each
surgical treatment were randomly assigned to either NM or FM
groups. Morning spot urine samples were obtained from sham
NM, sham FM, OA NM, and OA FM individuals at presurgical,
2, 4, 8, 12, and 16 week time points for repeated measure-
ment of urine CTX II. Urine was sampled on FM treatment
days, just before FM treatment. A Urine Pre-Clinical Carti-
Laps
®
enzyme-linked immunosorbent assay (Nordic Bio-
sciences, Herlev, Denmark) was used to measure the levels of
CTX II in urine over time, in accordance with the manufac-
turer's protocol. Standards and samples were assayed in
duplicate on 96-well plates. Absorbance was measured at
450 nm, with 600 nm as a reference wavelength, to quantify
CTX II in the samples. Nonlinear regression analysis of log-
transformed concentration values was used to construct a
standard curve with standard absorbance readings. Averaged
absorbance readings were then used to interpolate CTX II lev-
els in urine samples using the standard curve. To correct for
variations in urine concentration between animals, CTX II con-
centration was normalized to creatinine in each sample. Creat-
inine concentration was determined using a Creatinine Assay
Available online />Page 5 of 15
(page number not for citation purposes)
Kit (Oxford Biomedical Research, Inc., Oxford, MI, USA)
based on the Jaffe reaction [54,55], in accordance with the
manufacturer's protocol. Standard and sample creatinine con-
centrations were determined in 96-well plates from 450 nm
absorbance readings. Averaged absorbance readings were
used to interpolate creatinine concentration in each urine sam-
ple from a standard curve. Corrected CTX II values are
expressed in micrograms of CTX II per millimoles of creatinine.
Immunohistochemistry
Additional 6 μm sections from the medial compartment of
each joint were used for immunohistochemical analyses in FM
joints up to 20 weeks. Primary antibodies against matrix met-
alloprotein (MMP)-13 (Cedarlane Labs, Hornby, Ontario, Can-
ada), alkaline phosphatase (Abcam, Cambride, MA, USA), or
type X collagen (Sigma, Oakville, Ontario, Canada), followed
by secondary antibodies conjugated to horseradish peroxi-
dase, were used to detect the expression of each protein
within the articular knee cartilage and growth plates (positive
control) of ipsilateral, contralateral, and sham knees at each
time point after surgery. Colourimetric detection with DAB
substrate (Dako USA, Carpinteria, CA, USA) was carried out
for equal time periods in sections probed with the same anti-
body, and Harris' hematoxylin was used as a nuclear counter-
stain. Detection of each protein was carried out on sections
from at least three different animals per treatment group.
Slides incubated without primary antibody were used as neg-
ative controls.
Statistical analyses
The statistical analysis program Graph Pad Prism 4.0 (Graph
Pad Software Inc., San Diego, CA, USA) was used for all sta-
tistical tests. Statistical tests on OARSI histologic grading and
staging scores, vBMD values, and CTX II level datasets were
performed with two-way analyses of variance to determine
whether the effect of surgical group or time point was signifi-
cant. In addition, one-way analysis of variance using Tukey's
post hoc tests was used to compare means between all surgi-
cal groups at each time point and between all time points for
each group. All values are expressed as the mean ± standard
error. P < 0.05 was considered statistically significant.
Results
Longitudinal study of histological changes in articular
joint degradation
We examined operated knee joints macroscopically, 4 weeks
after surgery. A healthy articular surface was observed in all
sham animals, whereas in model animals ipsilateral joint sur-
faces were abraded and contained fibrotic tissue (Figure 1c–
f). Contralateral surfaces appeared similar to those in sham
knee joints (not shown). This confirmed that ACL-T and PM
surgery induced OA-like degradation of the articular surface.
We then carried out histologic analysis of sham, contralateral,
and ipsilateral joints at several time points up to 20 weeks after
surgery (Figure 2). Healthy articular cartilage has a smooth,
uninterrupted surface and an even distribution of chondro-
cytes often arranged in columns [56]. The extracellular matrix
has a rich distribution of proteoglycans and glycosaminogly-
cans [57]. Sham joints exhibited a healthy appearance
throughout the duration of the study (Figures 2 and 3a).
OARSI histopathology scoring confirmed these observations.
Near-zero OARSI scores indicated that OA activity did not
occur at any point up to 20 weeks in either joint surface (tibial
or femoral) of NM and FM sham animals (Figure 4a,c).
A small degree of degradation (such as proteoglycan loss)
was detected in FM and NM contralateral joint surfaces at 12
and 20 weeks, respectively (Figure 2). These changes, how-
ever, did not worsen over time, and inter-animal variations were
minor. The OARSI scores of contralateral joints confirmed no
progression of degradation in either joint surface, with or with-
out FM. For example, there was a significantly higher NM con-
tralateral femur score, compared with NM sham femurs, at 2
and 12 weeks but not 20 weeks (statistics not shown). Finally,
no significant differences between NM and FM contralateral
scores were observed for either tibial or femoral surfaces (Fig-
ure 4b,d). These results indicate that the contralateral joint
develops minor but nonadvancing morphologic OA character-
istics up to 5 months after surgery.
Degradation in ipsilateral joints, conversely, was severe for
both joint surfaces. NM animals exhibited surface discontinuity
of both joint surfaces by 2 weeks, which extended across less
than half of the articular surface (Figure 2a). Similar degrada-
tion was also observed at the 4-week time point in NM animals
(Figure 2a). In FM animals, however, early degradation was
greater. Surface discontinuity was present over most of the
articular surface at 2 weeks, including shallow vertical fissures
through the cartilage superficial zone at many points across
the surface (Figure 2b) and delamination of the superficial
zone (for example, see Figure 3b) was restricted to small focal
regions. An even greater extent of degradation was seen in FM
animals than in NM animals after 4 weeks (Figure 2). For exam-
ple, there was an increase in vertical fissure formation and
depth into the mid-zone (for eample, see Figure 3c), and
chondrocyte clusters appeared in the mid-zone (for example,
see Figure 3d). Similar changes did not occur in NM joint sur-
faces until 8 weeks (Figure 2a).
Proteoglycan loss occurred early in both NM and FM ipsilat-
eral joint cartilage (Figure 2). Interestingly, loss of proteogly-
cans in a particular region correlated with the presence of
more advanced lesions in that region than peripherally. Over
the whole time course, however, proteoglycan loss was not
progressive. For example, proteoglycan staining was consist-
ently stronger at 16-week to 20-week time points in FM ipsilat-
eral joints than at early to moderate stages (8 to 12 weeks),
particularly in regions where repair tissue was present (Figure
2b).
Arthritis Research & Therapy Vol 9 No 1 Appleton et al.
Page 6 of 15
(page number not for citation purposes)
Our qualitative observations were reflected in ipsilateral joint
OARSI scores (Figure 4b,d). First, significantly higher scores
were observed in both NM and FM tibial and femoral ipsilateral
joint surfaces at all time points, with the exception of NM
ipsilateral surfaces at 2 weeks (similar to NM contralateral
score), as compared with all contralateral and sham scores
(statistics not shown). Next, significantly higher scores in both
FM ipsilateral joint surfaces were observed at 2 and 4 weeks
compared with NM animals (Figure 4b,d). OA activity in NM
and FM animals converged by 8 weeks and continued to
increase at similar rates in both NM and FM groups up to 16
weeks. Between 8 and 16 weeks, surface discontinuity, verti-
cal fissures (Figure 3c), proteoglycan loss (loss of staining;
Figure 3c), and chondrocyte clusters (Figure 3d) were seen in
both joint surfaces (Figure 2). However, by 20 weeks in FM
joint surfaces there was far greater deformation of the cartilage
surface (Figure 2b) than in the NM group (Figure 2a), which
mainly exhibited denudation (Figure 3e). This included evi-
dence of subchondral bone repair (Figure 3e), sclerotic
subchondral bone (Figure 2b), fibrocartilage-like tissue within
the cartilage surface (Figure 3f), and osteophyte formation at
the joint margins. Significantly higher OARSI scores (P =
0.029) were observed in FM ipsilateral tibial surfaces (22.375
± 0.718) than in NM ipsilateral tibias (18.425 ± 0.394) at 20
weeks (Figure 4b). Taken together, these results indicate that
destabilization surgery induces OA activity as early as 2 weeks
after surgery, and is accelerated by FM during early OA devel-
opment. Later, FM results in quantifiably greater joint deforma-
tion, particularly in tibial joint surfaces.
Longitudinal analysis of subchondral bone
We also investigated changes in vBMD and subchondral bone
morphology in our model. Micro-CT analysis demonstrated
that sham and contralateral joints maintained normal subchon-
dral trabecular architecture throughout the duration of the
study, regardless of mobilization group (Figure 5). vBMD
increased in the MFC and MTP of NM and FM sham and con-
tralateral joints over the 20 weeks (Figure 6). No significant
effect of FM on sham or contralateral vBMD was observed
(Figure 6).
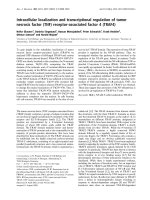
Figure 2
Histologic analysis over time reveals patterns of articular degradationHistologic analysis over time reveals patterns of articular degradation. Sagittal sections from sham (control), and contralateral and ipsilateral OA
treatments, in (a) nonmobilized (NM) and (b) forced mobilization (FM) groups of animals were analyzed over a 20-week time course. Sections were
stained with safranin-O (red stain) for articular cartilage matrix proteoglycans, fast green (green stain) for bone and fibrous tissue, and hematoxylin for
nuclei (blue). In the upper row of each panel, representative images of sham and contralateral joints are shown at 2, 12, and 20 weeks after surgery.
The lower row shows representative sections of ipsilateral joints at all time points assessed. Each image is presented with the femoral joint surface
in the upper portion. Examples of morphologically normal articular surface (ac), surface discontinuity (arrow), vertical fissures (arrow head), delamina-
tion (del), chondrocyte clusters (cc), denudation (dn), sclerotic bone (sb), fibrocartilage-like tissue (fc), and subchondral plate failure (pf) are indi-
cated. All images are shown at the same magnification, indicated by the scale bars.
Available online />Page 7 of 15
(page number not for citation purposes)
However, subchondral bone of the ipsilateral joints demon-
strated dramatic changes. Morphologic evaluation showed
that FM ipsilateral joints developed more severe subchondral
spaces (sometimes referred to as 'cysts') by 20 weeks, and
loss of subchondral trabecular architecture due to sclerosis
occurred earlier in FM joints (12 weeks) than in NM joints (20
weeks; Figure 5). Subchondral plate failure was also more
severe in FM joints (Figure 5b). Because the micro-CT slices
at 20 weeks were aligned with the corresponding histologic
sections, FM ipsilateral joint subchondral plate failure can also
be seen in histologic sections at 20 weeks (Figure 2b).
Interestingly, although FM affected morphology, it had no sig-
nificant effect on the vBMD of the MTP and MFC of ipsilateral
joints (Figure 6). However, the vBMD profiles of the ipsilateral
MFC and MTP were slightly different. Whereas the vBMD of
the ipsilateral MFC was reduced at 2 weeks compared with
contralateral and sham MFCs (Figure 6d), the vBMD of the
ipsilateral MTP was not reduced until 12 weeks (Figure 6b).
By the end of the 20-week time course, MTP and MFC vBMD
had recovered to sham levels, despite architectural changes.
Although these results indicate that FM modifies subchondral
bone morphology differently than does NM, subchondral
vBMD is not further affected by FM.
Qualitative assessment of the three-dimensional micro-CT
scans confirmed that NM and FM contralateral subchondral
trabecular architecture, subchondral plates, and joint margins
were similar to sham controls (three-dimensional analysis not
shown). In the coronal and sagittal planes of NM ipsilateral
joints, however, severe bone loss was evident in large spaces
beneath the subchondral plates. Nonetheless, NM ipsilateral
subchondral plates largely remained intact at 20 weeks. In
contrast, FM ipsilateral subchondral plates deteriorated dra-
matically, and trabecular bone was almost completely disinte-
grated by 20 weeks. To demonstrate this, three-dimensional
surface rendering of the subchondral plate indicated that FM
joint surface topography was considerably heaved and sunken
(Figure 7b), whereas NM joint surfaces remained relatively
even (Figure 7a). FM also caused striking changes at the joint
margins. Osteophytes were prominent along medial and lat-
eral joint margins of FM ipsilateral joints after 20 weeks (Figure
7d), whereas very little osteophyte development was evident
in NM joints (Figure 7c). Overall, FM caused more severe deg-
radation, and stimulated the formation of features consistent
with those observed in human OA (for instance, osteophytes
and subchondral spaces).
Assessment of type II collagen breakdown
Type II collagen is the major structural component of articular
cartilage [58]. When type II collagen is broken down, collagen
fragments (CTX II) are released into the circulation and
excreted in urine [59]. Accordingly, greater rates of cartilage
breakdown cause higher levels of CTX II in urine. We investi-
gated urine CTX II levels in this model to determine which
stage(s) exhibited increased cartilage catabolism, and
whether FM affected this rate. Overall, creatinine-corrected
CTX II levels decreased in all sham and operated (OA) ani-
mals, with and without FM exercise, over time (Figure 8). This
was most likely due to slowing growth rates of the animals
(resulting in slower matrix turnover) over time. In contrast, a
dramatic increase in CTX II levels occurred in FM OA animals
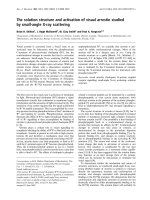
Figure 3
High magnification images of sagittal sections of articular cartilage, stained with safranin-O and fast-green, reveal detailed cartilage histologyHigh magnification images of sagittal sections of articular cartilage,
stained with safranin-O and fast-green, reveal detailed cartilage histol-
ogy. (a) Healthy-appearing sham cartilage has intact superficial, mid,
and deep zones (from top to bottom of image) that stain deeply with
safranin-O (red) for glycosaminoglycans. The chondrocytes are
arranged in columns. (b) Two week FM ipsilateral cartilage demon-
strates delamination (del) of the superficial zone. (c) Four week FM ipsi-
lateral cartilage shows the development of vertical fissures (vf) into the
mid-zone, and loss of glycosaminoglycans (pale green stain in mid-zone
is red in panel a). (d) Matrix erosion of the superficial and mid-zones is
evident by 8 weeks in FM ipsilateral cartilage, as well as the formation
of chondrocyte clusters (cc). (e) By 16 weeks, NM ipsilateral cartilage
shows almost complete denudation (dn) of the articular cartilage, and
evidence of bone repair appears beneath the subchondral plate (br). (f)
Fibrocartilage-like tissue (fc) is evident in the articular cartilage of 20-
week FM ipsilateral joints, which is indicative of abnormal repair proc-
esses. All images are shown at the same magnification, indicated by
the scale bar. FM, forced mobilization; NM, nonmobilized.
Arthritis Research & Therapy Vol 9 No 1 Appleton et al.
Page 8 of 15
(page number not for citation purposes)
at 4 weeks. This coincided with both the early increase in artic-
ular cartilage degradation in the histologic samples and the
significantly higher OARSI scores at 4 weeks in FM ipsilateral
joints. Moreover, the use of FM in OA animals increased type
II collagen breakdown at earlier stages. The effects of FM on
type II collagen turnover, together with the histologic findings,
highlight the involvement of cartilage matrix breakdown during
the early stages of OA development.
Chondrocyte hypertrophy in cartilage degradation
Because our histologic analyses of FM ipsilateral articular car-
tilage revealed the presence of mid-zone chondrocytes with a
hypertrophic appearance, we assessed the expression of
several hypertrophic marker proteins in the articular cartilage
of FM animals. Immunohistochemistry was used to assess the
spatial and temporal expression of MMP-13, alkaline phos-
phatase, and type X collagen over time (Figure 9). These
proteins were not expressed at any time point in FM sham
articular cartilage. MMP-13 expression was observed at 4
weeks in ipsilateral samples, and was expressed earlier than
alkaline phosphatase and type X collagen (Figure 9a). MMP-
13 continued to be expressed at high levels (compared with
sham) until 20 weeks. Some MMP-13 staining was also
observed in contralateral cartilage. Alkaline phosphatase
expression was increased in ipsilateral chondrocytes by 8
weeks, increased dramatically at 12 weeks, and diminished
thereafter (Figure 9b). No alkaline phosphatase staining was
observed in contralateral samples. Type X collagen was
expressed in ipsilateral cartilage as early as 8 weeks and con-
tinued to be expressed through to 20 weeks (Figure 9c). Con-
tralateral samples also exhibited type X collagen staining but
only at 20 weeks. Growth plate analysis confirmed expression
of all three proteins in hypertrophic chondrocytes and was
used as a positive control for each marker. In addition, the
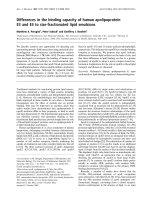
Figure 4
OARSI histopathology grading and staging scoresOARSI histopathology grading and staging scores. OARSI histopathology grading and staging scores were determined in sham (control), and con-
tralateral and ipsilateral treatments of both NM and FM groups of animals over 20 weeks. Tibial joint surfaces from (a) sham and (b) contralateral and
ipsilateral treatments were assessed independently of femoral (c) sham and (d) contralateral and ipsilateral joint surfaces. Mean OARSI scores ±
standard error are shown. Significantly higher scores were observed in NM contralateral femurs than NM sham femurs at 2 and 12 weeks (statistics
not shown). Both ipsilateral surfaces had significantly higher OARSI scores than shams at all time points, except NM ipsilateral surfaces at 2 weeks
(statistics not shown). Statistical analysis is done for each individual time point to indicate significantly different means among each of the four con-
tralateral and ipsilateral treatments. Similar means at each time point are indicated by the same letter (a, b, and c), whereas significantly different
means at each time point are indicated by different letters (P < 0.05; n = 4). FM, forced mobilization; NM, nonmobilized; OARSI, Osteoarthritis
Research Society International.
Available online />Page 9 of 15
(page number not for citation purposes)
morphologic appearance of chondrocytes in ipsilateral carti-
lage suggested larger cells, with larger lacunae, than that of
chondrocytes in sham cartilage. These results indicate that
articular chondrocytes in FM cartilage undergo hypertrophic-
like differentiation. Contralateral chondrocytes also appeared
to be affected, albeit to a lesser extent.
Discussion
Development of preclinical OA models is crucial to the study
of OA pathophysiology and evaluation of DMOAD efficacy.
However, models must be extensively characterized to ensure
that appropriate conclusions are drawn from the studies that
use them. In this study we characterized a surgical rodent
model of OA, in which ACL-T and PM lead to joint destabiliza-
tion, and thus OA pathology. Notably, this model more closely
reflects secondary forms of OA, which arise from trauma or
other disorders [60]. Nonetheless, it may also have application
in primary OA studies. We evaluated OA activity through his-
tomorphometric analysis using the quantitative OARSI scoring
method [42], quantitative analysis of bone mineral density
[61,62], and biochemical analysis of cartilage breakdown
[40,41]. Furthermore, we are the first to evaluate the effects of
FM on pathogenesis in a rat model of OA, and we assessed
chondrocyte hypertrophy in OA pathogenesis. To date, a com-
prehensive, longitudinal evaluation of a preclinical surgical
rodent model of OA, as shown here, has not been reported.
Our histologic results indicate that in this model, articular car-
tilage degradation consistently begins as early as 2 weeks
after surgery and is worse with FM. Early in pathogenesis, the
profile of cartilage degradation initially reflects the edema and
delamination of the superficial layer, and development of fis-
sures into the mid-zone that are commonly observed during
early stages of human OA [60]. At later time points the model
also exhibits features characteristics of late-stage human OA
including denudation, and osteophytes and fibrocartilage-like
tissue are present at the denuded surface when FM is applied
[60,63]. Interestingly, although proteoglycan loss occurred at
earlier stages in regions with more severe lesions, proteogly-
can loss was not progressive over the time course. In fact, pro-
teoglycan staining was more intense near the end of the time
course, particularly in repair tissues, which is probably due to
a compensatory anabolic repair response. Accordingly,
quantitative analyses that include proteoglycan loss in addition
to other features of degradation are necessary to achieve a
comprehensive understanding of disease progression.
In addition, early loss of subchondral bone density and trabec-
ular architecture were also present and are reminiscent of
human OA [10]. Ultimately, these properties are likely to per-
sist to end-stage OA, where joint failure occurs and invasive
arthroplastic intervention is required. Longitudinal analysis
allows evaluation of both the early and late stages of OA devel-
opment. This is highly effective in rodent models in particular,
because the time course to overt pathology is relatively short,
and a larger number of animals can be managed. As previously
shown, longitudinal three-dimensional vBMD analysis in rab-
bits [52] and OARSI scores in rodents [42] are precise tools
for assessing OA development in animal models. Overall, our
findings correspond with current assessments of OA in
humans, and the model produces significant, predictable, and
reproducible results. Therefore, we conclude that the ACL-T/
Figure 5
Micro-CT analysis of subchondral changes over the time courseMicro-CT analysis of subchondral changes over the time course. Knee
joints from (a) NM and (b) FM groups of animals were assessed by
micro-CT for morphologic changes in subchondral bone in contralateral
and ipsilateral joints, compared with sham controls at 2, 12, and 20
weeks. Each sagittal slice at 12 and 20 weeks is shown at the same
distance into the medial joint compartment (from the medial margin) as
the corresponding histologic section in Figure 2. Subchondral trabecu-
lar architecture was maintained in both sham and contralateral joints,
regardless of mobilization group. Note the more extensive subchondral
spaces in FM compared with NM ipsilateral joints (white arrows). Scle-
rotic bone (S) appeared earlier in FM (12 weeks) than in NM ipsilateral
joints (20 weeks). Collapse of the subchondral plate was evident in 20
week FM joints (arrowhead). All images are shown at the same magnifi-
cation, indicated by the scale bars. CT, computed tomography; FM,
forced mobilization; NM, nonmobilized.
Arthritis Research & Therapy Vol 9 No 1 Appleton et al.
Page 10 of 15
(page number not for citation purposes)
PM model of OA with FM is appropriate for use in preclinical
studies of OA, providing a means to study the onset, develop-
ment, and characteristics of lesions that appear to be similar
to those in human OA. However, although this model mimics
certain aspects of human OA, extrapolation of joint lesions to
human OA should be considered with caution, as with any ani-
mal model.
There is often disagreement as to whether sham surgery is the
most appropriate control in surgical models of OA [28,64].
Accordingly, in addition to the ipsilateral knee, we investigated
OA activity in the contralateral joint. Histology and OARSI
scores revealed minor OA activity in contralateral articular car-
tilage, including significantly higher scores in contralateral
joints at 2 and 12 weeks, compared with shams. We also saw
induction of type X collagen and MMP-13 expression in con-
tralateral cartilage late in the 5-month time course. Evidence of
contralateral OA activity, however, did not worsen over the
time course. Nonetheless, these findings indicate that the sur-
gically unaltered contralateral joint is affected to a minor extent
by OA induction in the model. The effects may be due to alter-
ations in weight-bearing during rest or activity [65] or to sys-
temic factors (for example, circulating inflammatory factors
[66,67]) yet to be identified in this model [68]. Interestingly,
subchondral bone and vBMD profiles were not altered in con-
tralateral joints (compared with sham joints), perhaps protect-
ing them from OA advancement. Furthermore, we recently
demonstrated that contralateral chondrocyte gene expression
profiles are altered, relative to shams, emphasizing the impor-
tance of sham controls in gene expression studies [69]. By
extension, the contralateral joint may be susceptible to devel-
oping OA caused by changes in gait or systemic effects.
Accordingly, we conclude that a sham operation in independ-
ent animals is the most appropriate control in genetic and bio-
chemical studies [70,71]. However, in studies focused on
subchondral bone (for example, micro-CT studies) the contral-
ateral joint is a sufficient control, because we did not observe
any contralateral changes in subchondral architecture or
Figure 6
Volumetric bone mineral density analysis over the time courseVolumetric bone mineral density analysis over the time course. Micro-CT scans were used to assess vBMD over the 20-week time course. vBMD
was compared between NM and FM groups in (a,b) the MTP and (c,d) MFC of sham, and contralateral and ipsilateral treatments. Mean vBMD val-
ues ± standard error are shown. No significant effect of FM on vBMD was observed in sham, contralateral, or ipsilateral treatments (compared with
NM counterparts). Contralateral vBMD means were not significantly different from sham vBMD means at any time point (statistics not indicated).
Statistical analysis is done for each individual time point to indicate significantly different means among the four contralateral and ipsilateral treat-
ments. Only at the time points where significantly different means were identified are similar means encircled, whereas significantly different means
are indicated by different circles labeled a or b (P < 0.05; n = 4). CT, computed tomography; FM, forced mobilization; MFC, medial femoral compart-
ment; MTP, medial tibial plateau; NM, nonmobilized; vBMD, volumetric bone mineral density.
Available online />Page 11 of 15
(page number not for citation purposes)
vBMD over 5 months (compared with shams), and is
advantageous for controlling inter-animal variables such as
age and weight.
It is thought that OA may arise from abnormal articulations and
repetitive joint loading. Accordingly, we explored the effects of
FM (inducing repetitive joint loading and maximal flexion and
extension of the knee joint) on OA development in the ACL-T/
PM model. Because NM animals in this study could voluntarily
remain stationary, it was hypothesized that such a paradigm of
FM would accelerate pathogenesis. Indeed, this was the case.
FM animals had increased cartilage degradation at 2 weeks
after surgery, higher OARSI scores, articular surface deforma-
tion and subchondral plate failure, and earlier subchondral
bone sclerosis than did NM animals. Similar to human OA, FM
also induced abnormal repair processes, including fibrocarti-
lage-like tissue and osteophytes, which were not present in
NM animals. This was probably due to subchondral plate fail-
ure caused by FM, allowing infiltration of bone marrow stromal
cells and activation of repair processes such as that seen fol-
lowing osteochondral fracture [72]. Furthermore, biochemical
analysis of type II collagen breakdown indicated that cartilage
degradation is elevated in FM animals at 4 weeks. Together,
these data indicate that FM in this model effectively
accelerates both the onset and progression of OA pathogen-
esis, resulting in a disease state that is reminiscent of human
OA.
The clinical implications of FM are unclear. FM exercise, as
applied in this study, involves walking slowly on a rotating
drum for 30 min, three times per week, and thus is not vigorous
exercise. Rather, FM forces maximal joint flexion and extension
and causes repetitive increased load bearing that is not nec-
essarily exhaustive but is deleterious when applied to the
destabilized joint. Importantly, however, FM exercise had no
deleterious effects on nondestabilized joints. Although we
know from this and many other previous studies that joint
destabilization in animal models leads to OA pathogenesis, we
conclude here that FM accelerates OA pathogenesis, and that
repetitive load bearing exercise is deleterious to the destabi-
lized joint, at least in this OA model. A question faced by many
patients who suffer OA is whether they should exercise. Exer-
cise is often recommended for patients with hip or knee OA
[73], and the American College of Rheumatology recom-
mends aerobic exercise for patients with knee and hip OA
[74]. However, fear that exercise is damaging their joints
causes some patients with OA not to exercise [75]. The ther-
apeutic importance of exercise is therefore a complex issue.
Figure 7
Reconstruction of micro-CT volumes reveals subchondral plate degen-eration and osteophytesReconstruction of micro-CT volumes reveals subchondral plate degen-
eration and osteophytes. Qualitative assessment of (a,b) subchondral
plate integrity and (c,d) femoral osteophyte formation is shown. Recon-
struction of the three-dimensional micro-CT volumes and surface ren-
dering was used to assess the integrity of the subchondral plate in (a)
NM and (b) FM ipsilateral joints at 20 weeks. Dorsal views of the recon-
structed knee joints are shown. In panel a the tibial subchondral plate
of NM joints exhibited minor plate breakdown (arrowhead) in the medial
plateau, whereas in panel b FM plates were completely compromised
by erosion and pitting (arrowheads). Coronal sections of (c) NM and
(d) FM ipsilateral joints at 20 weeks reveal the presence of osteophytes
(arrows). FM joints exhibit many well developed osteophytes on both
medial (left) and lateral (right) joint margins, whereas NM joints show
only slight medial osteophyte development (containing little mineral
content). The magnification of each image is the same, indicated by the
scale bars. CT, computed tomography; FM, forced mobilization; NM,
nonmobilized.
Figure 8
Biochemical analysis of CTX II levels as an indicator of cartilage turnoverBiochemical analysis of CTX II levels as an indicator of cartilage turno-
ver. Quantitative biochemical analysis of cartilage breakdown (type II
collagen fragments) was performed on urine samples using the CTX II
Pre-Clinical CartiLaps
®
enzyme-linked immunosorbent assay. Ten ani-
mals underwent sham surgery (control) and 10 underwent OA surgery.
Five animals from each group were randomly selected for FM studies,
and the remaining five for NM studies. Spot urine was collected presur-
gically and at 2, 4, 8, 12, and 16 weeks after surgery. Samples were
assayed for CTX II concentration and normalized to urine creatinine
concentration. Mean CTX II concentrations corrected to creatinine ±
standard error are shown. Statistical analysis was performed to test for
significant differences between groups, at each time point. Only signifi-
cantly different means are indicated by 'a' and 'b' (P < 0.05; n = 5). FM,
forced mobilization; NM, nonmobilized; OA, osteoarthritis.
Arthritis Research & Therapy Vol 9 No 1 Appleton et al.
Page 12 of 15
(page number not for citation purposes)
One point of departure may be in the form of exercise. Indeed,
many studies have demonstrated the beneficial effects of light
to moderate exercise in animal models of OA and patients
[35,76-78], whereas more strenuous exercise and repetitive
load bearing has a deleterious effect, at least in experimental
animals [39]. We must stress that our study does not suggest
that nonrepetitive load bearing forms of exercise accelerate
pathogenesis, nor that they are detrimental. However, our
study does indicate that both the type and timing of exercise
after a joint injury should be considered with care, in addition
to the stability of the joint in question.
Several studies have proposed that recapitulation of hyper-
trophic chondrocyte differentiation is involved in cartilage deg-
radation in OA [79,80]. We investigated this hypothesis in our
OA model by analyzing the expression of hypertrophic
chondrocyte markers, including MMP-13, alkaline phos-
phatase, and type X collagen. We demonstrated that all three
Figure 9
Immunostaining for markers of chondrocyte hypertrophyImmunostaining for markers of chondrocyte hypertrophy. Immunostaining for markers of chondrocyte hypertrophy was performed in articular carti-
lage sections from FM animals. Sections were probed with (a) anti-MMP-13, (b) anti-alkaline phosphatase, or (c) anti-type X collagen primary anti-
bodies, followed by secondary antibodies conjugated to horseradish peroxidase. Colourimetric detection of each protein (brown precipitate) was
carried out for equal time periods for all sections probed with the same primary antibody. Nuclei are counterstained with hematoxylin (blue). In the
top row of each panel, representative sections from all time points following surgery in ipsilateral knee joints are shown. In the bottom row of each
panel, representative sections from sham and contralateral knee joints at 8 and 20 weeks after surgery are shown. As a positive control, sections
containing the growth plate are shown in each panel to demonstrate the expression of each protein in hypertrophic chondrocytes. Articular chondro-
cytes with a hypertrophic-like morphology are also indicated (arrows). Experiments for each protein were carried out on sections from at least three
different animals with reproducible results. All images are shown at the same magnification, as indicated by the scale bars. FM, forced mobilization;
MMP, matrix metalloproteinase.
Available online />Page 13 of 15
(page number not for citation purposes)
markers of chondrocyte hypertrophy are increased in FM ipsi-
lateral cartilage, supporting this hypothesis. MMP-13, when
activated, will digest the territorial matrix, and deposition of
type X collagen and secretion of factors that facilitate calcifi-
cation of the cartilage matrix (such as alkaline phosphatase)
are deleterious to articular cartilage. Furthermore, degradation
of the matrix by catabolic factors such as MMP-13 make the
cartilage susceptible to further mechanical erosion. Accord-
ingly, hypertrophic differentiation of articular chondrocytes will
facilitate degradation in OA. Moreover, we conclude that
hypertrophic-like differentiation of articular chondrocytes is
one facet of, and probably contributes to, OA pathology in this
model.
Preclinical studies are often limited by time or financial con-
straints. Consequently, accelerating pathology with FM (as
presented here), while maintaining similarity to human OA, will
maximize productivity in preclinical studies. Of course, no OA
model can reproduce human OA pathology identically [81].
For example, the NM animals used in this study did not
develop osteophytes, which are known to develop in human
knee OA [82,83]. Interestingly, the use of FM induced osteo-
phyte formation. Such limitations must be considered when
designing and drawing conclusions from a preclinical OA
model. Instead, OA models are highly useful for investigating
specific properties of OA. For example, this model accurately
mimics the articular cartilage degradation and subchondral
changes that are observed in many types of human OA, such
as post-traumatic arthritis [84]. Although we were unable to
monitor disease progression in individual animals over time
(because of sacrifice for histology), we now have a predictable
index of pathogenesis in this model. We propose that future
studies on disease progression in the joint should use the 2-
week to 8-week time points for early, and 12-week to 20-week
time points for late stages of OA, and are most relevant to
human OA when combined with FM in this model. Thus, future
studies will require only end-point histology, and disease
progression may be monitored solely with in vivo techniques
such as high resolution magnetic resonance imaging [85,86]
and micro-CT.
Conclusion
Development and comprehensive characterization of pre-clin-
ical OA models is pivotal to understanding pathology and
intervention mechanisms. Here, we report a comprehensive,
longitudinal characterization of the ACL-T/PM rat model of
OA, using multiple methodologies and measurement tools.
We found that articular cartilage degradation, subchondral
deformation, and biochemical urinalysis profiles correlate with
current understanding of OA pathology. Furthermore, we dem-
onstrated that FM is useful for accelerating OA onset and
severity. This model is not meant to replace other available
models, but it highlights the advantages of small animal stud-
ies and the variety of experimental techniques that may be
used in such investigations. For example, we recently com-
pleted a parallel study in which we evaluated genome-wide
changes in chondrocyte gene expression in degrading articu-
lar cartilage; this preclinical study would not have been possi-
ble in larger animals (which would be less relevant to humans
from a genetic standpoint) with currently available gene
expression tools [69]. We propose that the ACL-T/PM model
is suitable for preclinical studies of OA, including studies
investigating the efficacy of DMOADs.
Competing interests
The authors declare that they have no competing interests.
Authors' contributions
CTGA participated in the design of the study, carried out all
histologic, biochemical, and immunoassays, performed statis-
tical analyses, and drafted the manuscript. Coauthor DDM car-
ried out micro-CT data acquisition and analysis, and
performed statistical analysis. VP and NS were involved in
development of the OA model and editing of the manuscript.
SMB, JLH, and DWH were involved in the development of the
model, design of the study, and editing the manuscript. FB par-
ticipated in the conception, design, and coordination of the
study, and helped to draft the manuscript. All authors read and
approved the final manuscript.
Acknowledgements
The authors thank Dr Nancy Ford for technical assistance. This study
was supported by the Canadian Institutes of Health Research and the
Canadian Arthritis Network with a New Emerging Team (NET) grant
(NEO66211). FB is the recipient of the Canada Research Chair in Mus-
culoskeletal Health. CTGA was supported by an Ontario Graduate
Scholarship for Sciences and Technology.
References
1. Altman R, Asch E, Bloch D, Bole G, Borenstein D, Brandt K,
Christy W, Cooke TD, Greenwald R, Hochberg M, et al.: Develop-
ment of criteria for the classification and reporting of osteoar-
thritis. Classification of osteoarthritis of the knee. Diagnostic
and Therapeutic Criteria Committee of the American Rheuma-
tism Association. Arthritis Rheum 1986, 29:1039-1049.
2. Felson DT, Neogi T: Osteoarthritis: is it a disease of cartilage or
of bone? Arthritis Rheum 2004, 50:341-344.
3. Mandelbaum B, Waddell D: Etiology and pathophysiology of
osteoarthritis. Orthopedics 2005, 28:s207-s214.
4. Blumenkrantz G, Lindsey CT, Dunn TC, Jin H, Ries MD, Link TM,
Steinbach LS, Majumdar S: A pilot, two-year longitudinal study
of the interrelationship between trabecular bone and articular
cartilage in the osteoarthritic knee. Osteoarthritis Cartilage
2004, 12:997-1005.
5. Petersson IF, Jacobsson LT: Osteoarthritis of the peripheral
joints. Best Pract Res Clin Rheumatol 2002, 16:741-760.
6. Buckwalter JA, Martin J: Degenerative joint disease. Clin Symp
1995, 47:1-32.
7. Poole AR: An introduction to the pathophysiology of
osteoarthritis. Front Biosci 1999, 4:D662-D670.
8. Badley EM, Rasooly I, Webster GK: Relative importance of mus-
culoskeletal disorders as a cause of chronic health problems,
disability, and health care utilization: findings from the 1990
Ontario Health Survey. J Rheumatol 1994, 21:505-514.
9. Badley EM: The effect of osteoarthritis on disability and health
care use in Canada. J Rheumatol Suppl 1995, 43:19-22.
10. Felson DT, Lawrence RC, Dieppe PA, Hirsch R, Helmick CG, Jor-
dan JM, Kington RS, Lane NE, Nevitt MC, Zhang Y, et al.: Oste-
oarthritis: new insights. Part 1: the disease and its risk factors.
Ann Intern Med 2000, 133:635-646.
Arthritis Research & Therapy Vol 9 No 1 Appleton et al.
Page 14 of 15
(page number not for citation purposes)
11. Goldberg VM, Buckwalter JA: Hyaluronans in the treatment of
osteoarthritis of the knee: evidence for disease-modifying
activity. Osteoarthritis Cartilage 2005, 13:216-224.
12. Matyas JR, Atley L, Ionescu M, Eyre DR, Poole AR: Analysis of
cartilage biomarkers in the early phases of canine experimen-
tal osteoarthritis. Arthritis Rheum 2004, 50:543-552.
13. Lindblad-Toh K: Genome sequencing: three's company. Nature
2004, 428:475-476.
14. McDevitt C, Gilbertson E, Muir H: An experimental model of
osteoarthritis; early morphological and biochemical changes.
J Bone Joint Surg Br 1977, 59:24-35.
15. Schwartz ER, Greenwald RA: Experimental models of
osteoarthritis. Bull Rheum Dis 1979, 30:1030-1033.
16. Shoji H, D'Ambrosia RD, Dabezies EJ, Taddonio RF, Pendergrass
J, Gristina AG: Articular cartilage and subchondral bone
changes in an experimental osteoarthritic model. Surg Forum
1978, 29:554-556.
17. Ehrlich MG, Mankin HJ, Jones H, Grossman A, Crispen C, Ancona
D: Biochemical confirmation of an experimental osteoarthritis
model. J Bone Joint Surg Am 1975, 57:392-396.
18. Carlsson GE, Oberg T: Remodelling of the temporomandibular
joints. Oral Sci Rev 1974, 6(0):53-86.
19. Silbermann M: Experimentally induced osteoarthrosis in the
temporomandibular joint of the mouse. Acta Anat (Basel)
1976, 96:9-24.
20. Livne E, von der Mark K, Silbermann M: Morphologic and cyto-
chemical changes in maturing and osteoarthritic articular car-
tilage in the temporomandibular joint of mice. Arthritis Rheum
1985, 28:1027-1038.
21. Kopp S, Mejersjo C, Clemensson E: Induction of osteoarthrosis
in the guinea pig knee by papain. Oral Surg Oral Med Oral
Pathol 1983, 55:259-266.
22. Kalbhen DA: Chemical model of osteoarthritis: a pharmacolog-
ical evaluation. J Rheumatol
1987, 14:130-131.
23. Arsever CL, Bole GG: Experimental osteoarthritis induced by
selective myectomy and tendotomy. Arthritis Rheum 1986,
29:251-261.
24. Layton MW, Arsever C, Bole GG: Use of the guinea pig myec-
tomy osteoarthritis model in the examination of cartilage-syn-
ovium interactions. J Rheumatol 1987, 14:125-126.
25. Marshall KW, Chan AD: Arthroscopic anterior cruciate ligament
transection induces canine osteoarthritis. J Rheumatol 1996,
23:338-343.
26. Schwartz ER: Animal models: a means to study the pathogen-
esis of osteoarthritis. J Rheumatol 1987, 14 Spec No:101-103.
27. Bendele AM, White SL: Early histopathologic and ultrastruc-
tural alterations in femorotibial joints of partial medial menis-
cectomized guinea pigs. Vet Pathol 1987, 24:436-443.
28. Wei L, Hjerpe A, Brismar BH, Svensson O: Effect of load on artic-
ular cartilage matrix and the development of guinea-pig
osteoarthritis. Osteoarthritis Cartilage 2001, 9:447-453.
29. Kamekura S, Hoshi K, Shimoaka T, Chung U, Chikuda H, Yamada
T, Uchida M, Ogata N, Seichi A, Nakamura K, Kawaguchi H: Oste-
oarthritis development in novel experimental mouse models
induced by knee joint instability. Osteoarthritis Cartilage 2005,
13:632-641.
30. Janusz MJ, Bendele AM, Brown KK, Taiwo YO, Hsieh L, Heitmeyer
SA: Induction of osteoarthritis in the rat by surgical tear of the
meniscus: Inhibition of joint damage by a matrix metallopro-
teinase inhibitor. Osteoarthritis Cartilage 2002, 10:785-791.
31. Hayami T, Pickarski M, Zhuo Y, Wesolowski GA, Rodan GA,
Duong le T: Characterization of articular cartilage and
subchondral bone changes in the rat anterior cruciate liga-
ment transection and meniscectomized models of
osteoarthritis. Bone 2006, 38:234-243.
32. Henry JL: Molecular events of chronic pain: from neuron to
whole animal in an animal model of osteoarthritis. Novartis
Found Symp 2004, 260:139-145.
33. Stoop R, Buma P, van der Kraan PM, Hollander AP, Billinghurst
RC, Meijers THM, Poole AR, van den Berg WB: Type II collagen
degradation in articular cartilage fibrillation after anterior cru-
ciate ligament transection in rats.
Osteoarthritis Cartilage 2001,
9:308-315.
34. Hayami T, Pickarski M, Wesolowski GA, Mclane J, Bone A, Deste-
fano J, Rodan GA, Duong le T: The role of subchondral bone
remodeling in osteoarthritis: Reduction of cartilage degenera-
tion and prevention of osteophyte formation by alendronate in
the rat anterior cruciate ligament transection model. Arthritis
Rheum 2004, 50:1193-1206.
35. Galois L, Etienne S, Grossin L, Watrin-Pinzano A, Cournil-Henrion-
net C, Loeuille D, Netter P, Mainard D, Gillet P: Dose-response
relationship for exercise on severity of experimental osteoar-
thritis in rats: a pilot study. Osteoarthritis Cartilage 2004,
12:779-786.
36. Fernihough J, Gentry C, Malcangio M, Fox A, Rediske J, Pellas T,
Kidd B, Bevan S, Winter J: Pain related behaviour in two models
of osteoarthritis in the rat knee. Pain 2004, 112:83-93.
37. Pastoureau PC, Chomel AC, Bonnet J: Evidence of early
subchondral bone changes in the meniscectomized guinea
pig. A densitometric study using dual-energy X-ray absorpti-
ometry subregional analysis. Osteoarthritis Cartilage 1999,
7:466-473.
38. Roberts MJ, Adams SB Jr, Patel NA, Stamper DL, Westmore MS,
Martin SD, Fujimoto JG, Brezinski ME: A new approach for
assessing early osteoarthritis in the rat. Anal Bioanal Chem
2003, 377:1003-1006.
39. Pap G, Eberhardt R, Sturmer I, Machner A, Schwarzberg H,
Roessner A, Neumann W: Development of osteoarthritis in the
knee joints of Wistar rats after strenuous running exercise in a
running wheel by intracranial self-stimulation. Pathol Res Pract
1998, 194:41-47.
40. Christgau S, Garnero P, Fledelius C, Moniz C, Ensig M, Gineyts E,
Rosenquist C, Qvist P: Collagen type II C-telopeptide frag-
ments as an index of cartilage degradation. Bone 2001,
29:209-215.
41. Garnero P, Conrozier T, Christgau S, Mathieu P, Delmas PD,
Vignon E: Urinary type II collagen C-telopeptide levels are
increased in patients with rapidly destructive hip
osteoarthritis. Ann Rheum Dis 2003, 62:939-943.
42. Pritzker KP, Gay S, Jimenez SA, Ostergaard K, Pelletier JP, Revell
PA, Salter D, van den Berg WB: Osteoarthritis cartilage
histopathology: grading and staging. Osteoarthritis Cartilage
2006, 14:
13-29.
43. Morenko BJ, Bove SE, Chen L, Guzman RE, Juneau P, Bocan TM,
Peter GK, Arora R, Kilgore KS: In vivo micro computed tomog-
raphy of subchondral bone in the rat after intra-articular
administration of monosodium iodoacetate. Contemp Top Lab
Anim Sci 2004, 43:39-43.
44. Ford NL, Nikolov HN, Norley CJ, Thornton MM, Foster PJ,
Drankgova M, Holdsworth DW: Prospective respiratory-gated
micro-CT of free breathing rodents. Med Phys 2005,
32:2888-2898.
45. Ford NL, Graham KC, Groom AC, Macdonald IC, Chambers AF,
Holdsworth DW: Time-course characterization of the com-
puted tomography contrast enhancement of an iodinated
blood-pool contrast agent in mice using a volumetric flat-
panel equipped computed tomography scanner. Invest Radiol
2006, 41:384-390.
46. Boyd SK, Muller R, Matyas JR, Wohl GR, Zernicke RF: Early mor-
phometric and anisotropic change in periarticular cancellous
bone in a model of experimental knee osteoarthritis quantified
using microcomputed tomography. Clin Biomech (Bristol,
Avon) 2000, 15:624-631.
47. Iwamoto J, Takeda T, Sato Y: Effect of treadmill exercise on
bone mass in female rats. Exp Anim 2005, 54:1-6.
48. Boyd SK, Muller R, Leonard T, Herzog W: Long-term periarticu-
lar bone adaptation in a feline knee injury model for post-trau-
matic experimental osteoarthritis. Osteoarthritis Cartilage
2005, 13:235-242.
49. Rozas G, Guerra MJ, Labandeira-Garcia JL: An automated
rotarod method for quantitative drug-free evaluation of overall
motor deficits in rat models of parkinsonism. Brain Res Brain
Res Protoc 1997, 2:75-84.
50. Martins MA, de Castro Bastos L, Tonussi CR: Formalin injection
into knee joints of rats: pharmacologic characterization of a
deep somatic nociceptive model. J Pain 2006, 7:100-107.
51. Feldkamp LA, Goldstein SA, Parfitt AM, Jesion G, Kleerekoper M:
The direct examination of three-dimensional bone architec-
ture in vitro by computed tomography. J Bone Miner Res 1989,
4:3-11.
52. Batiste DL, Kirkley A, Laverty S, Thain LMF, Spouge AR, Holds-
worth DW: Ex vivo characterization of articular cartilage and
bone lesions in a rabbit ACL transection model of osteoarthri-
Available online />Page 15 of 15
(page number not for citation purposes)
tis using MRI and micro-CT. Osteoarthritis Cartilage 2004,
12:986-996.
53. Garnero P, Ayral X, Rousseau J-C, Linda SC, Sandell J, Dougados
M, Delmas PD: Uncoupling of type II collagen synthesis and
degradation predicts progression of joint damage in patients
with knee osteoarthritis. Arthritis Rheum 2002, 46:2613-2624.
54. Hervey GR: Determination of creatinine by the Jaffe reaction.
Nature 1953, 171:1125.
55. Slot C: Plasma creatinine determination. A new and specific
Jaffe reaction method. Scand J Clin Invest 1965, 17:381-387.
56. Broom ND: Further insights into the structural principles gov-
erning the function of articular cartilage. J Anat 1984,
139:275-294.
57. Oettmeier R, Abendroth K, Oettmeier S: Analyses of the tide-
mark on human femoral heads. I. Histochemical, ultrastruc-
tural and microanalytic characterization of the normal
structure of the intercartilaginous junction. Acta Morphol Hung
1989, 37:155-168.
58. Seyer JM, Vinson WC: Synthesis of type I and type II collagen
by embryonic chick cartilage. Biochem Biophys Res Commun
1974, 58:272-279.
59. Jung M, Christgau S, Lukoschek M, Henriksen D, Richter W:
Increased urinary concentration of collagen type II C-telopep-
tide fragments in patients with osteoarthritis. Pathobiology
2004, 71:70-76.
60. Aigner T, Sachse A, Gebhard PM, Roach HI: Osteoarthritis:
pathobiology – targets and ways for therapeutic intervention.
Adv Drug Delivery Rev 2007 in press.
61. Burr DB: The importance of subchondral bone in
osteoarthrosis. Curr Opin Rheumatol 1998, 10:256-262.
62. Bergink AP, Uitterlinden AG, Van Leeuwen JPTM, Hofman A, Ver-
haar JAN, Pols HAP: Bone mineral density and vertebral frac-
ture history are associated with incident and progressive
radiographic knee osteoarthritis in elderly men and women:
The Rotterdam Study. Bone 2005, 37:446-456.
63. Sarzi-Puttini P, Cimmino MA, Scarpa R, Caporali R, Parazzini F,
Zaninelli A, Atzeni F, Canesi B: Osteoarthritis: an overview of the
disease and its treatment strategies. Semin Arthritis Rheum
2005, 35(1 Suppl 1):1-10.
64. Lopez MJ, Kunz D, Vanderby R Jr, Heisey D, Bogdanske J, Markel
MD: A comparison of joint stability between anterior cruciate
intact and deficient knees: A new canine model of anterior cru-
ciate ligament disruption. J Orthop Res 2003, 21:224-230.
65. Griffin TM, Guilak F: The role of mechanical loading in the onset
and progression of osteoarthritis. Exerc Sport Sci Rev 2005,
33:195-200.
66. Cecil DL, Johnson K, Rediske J, Lotz M, Schmidt AM, Terkeltaub
R: Inflammation-induced chondrocyte hypertrophy is driven by
receptor for advanced glycation end products. J Immunol
2005, 175:8296-8302.
67. Loeuille D, Chary-Valckenaere I, Champigneulle J, Rat AC, Tous-
saint F, Pinzano-Watrin A, Goebel JC, Mainard D, Blum A, Pourel
J, et al.: Macroscopic and microscopic features of synovial
membrane inflammation in the osteoarthritic knee: correlating
magnetic resonance imaging findings with disease severity.
Arthritis Rheum 2005, 52:3492-3501.
68. Dieppe PA, Lohmander LS: Pathogenesis and management of
pain in osteoarthritis. Lancet 365:965-973.
69. Appleton CTG, Pitelka V, Henry JL, Beier F: Global analyses of
gene expression in early experimental osteoarthritis. Arthritis
Rheum in press.
70. Boileau C, Martel-Pelletier J, Brunet J, Tardif G, Schrier D, Flory C,
El-Kattan A, Boily M, Pelletier J-P: Oral treatment with PD-
0200347 an α2δ ligand, reduces the development of experi-
mental osteoarthritis by inhibiting metalloproteinases and
inducible nitric oxide synthase gene expression and synthesis
in cartilage chondrocytes. Arthritis Rheum 2005, 52:488-500.
71. Fernihough J, Gentry C, Bevan S, Winter J: Regulation of calci-
tonin gene-related peptide and TRPV1 in a rat model of
osteoarthritis. Neurosci Lett 2005, 388:75-80.
72. Buckwalter JA, Brown TD: Joint injury, repair, and remodeling:
roles in post-traumatic osteoarthritis. Clin Orthop Relat Res
2004, 423:7-16.
73. van Dijk GM, Dekker J, Veenhof C, van den Ende CH, Carpa Study
Group: Course of functional status and pain in osteoarthritis of
the hip or knee: a systematic review of the literature.
Arthritis
Rheum 2006, 55:779-785.
74. Altman RD, Hochberg M, Moskowitz R, Schnitzer T: Recommen-
dations for the medical management of osteoarthritis of the
hip and knee: 2000 update. American College of Rheumatol-
ogy Subcommittee on Osteoarthritis Guidelines. Arthritis
Rheum 2000, 43:1905-1915.
75. Hendry M, Williams NH, Markland D, Wilkinson C, Maddison P:
Why should we exercise when our knees hurt? A qualitative
study of primary care patients with osteoarthritis of the knee.
Fam Pract 2006, 23:558-567.
76. Roddy E, Zhang W, Doherty M, Dougados M: Home based exer-
cise for osteoarthritis: author's reply. Ann Rheum Dis 2005,
64:170-171.
77. Mikesky AE, Mazzuca SA, Brandt KD, Perkins SM, Damush T, Lane
KA: Effects of strength training on the incidence and progres-
sion of knee osteoarthritis. Arthritis Rheum 2006, 55:690-699.
78. American Geriatrics Society Panel on Exercise and Osteoarthritis:
Exercise prescription for older adults with osteoarthritis pain:
consensus practice recommendations. J Am Geriatr Soc 2001,
49:808-823.
79. Vornehm SI, Dudhia J, von der Mark K, Aigner T: Expression of
collagen types IX and XI and other major cartilage matrix com-
ponents by human fetal chondrocytes in vivo. Matrix Biol 1996,
15:91-98.
80. Aigner T, Dietz U, Stoss H, von der Mark K: Differential expres-
sion of collagen types I, II, III, and X in human osteophytes.
Lab Invest 1995, 73:236-243.
81. Goldring MB: The role of cytokines as inflammatory mediators
in osteoarthritis: lessons from animal models. Connect Tissue
Res 1999, 40:1-11.
82. Szebenyi B, Hollander AP, Dieppe P, Quilty B, Duddy J, Clarke S,
Kirwan JR: Associations between pain, function, and radio-
graphic features in osteoarthritis of the knee. Arthritis Rheum
2006, 54:230-235.
83. Dayal N, Chang A, Dunlop D, Hayes K, Chang R, Cahue S, Song
J, Torres L, Sharma L: The natural history of anteroposterior
laxity and its role in knee osteoarthritis progression. Arthritis
Rheum 2005, 52:2343-2349.
84. Furman BD, Olson SA, Guilak F: The development of posttrau-
matic arthritis after articular fracture. J Orthop Trauma 2006,
20:719-725.
85. Raynauld J-P, Martel-Pelletier J, Berthiaume M-J, Beaudoin G, Cho-
quette D, Haraoui B, Tannenbaum H, Meyer J, Beary J, Cline G, et
al.: Long term evaluation of disease progression through the
quantitative magnetic resonance imaging of symptomatic
knee osteoarthritis patients: correlation with clinical symp-
toms and radiographic changes. Arthritis Res Ther 2006,
8:R21.
86. Tessier JJ, Bowyer J, Brownrigg NJ, Peers IS, Westwood FR,
Waterton JC, Maciewicz RA: Characterisation of the guinea pig
model of osteoarthritis by in vivo three-dimensional magnetic
resonance imaging. Osteoarthritis Cartilage 2003, 11:845-853.