Báo cáo y học: "Spectrocolorimetric assessment of cartilage plugs after autologous osteochondral grafting: correlations between color indices and histological findings in a rabbit model" ppt
Bạn đang xem bản rút gọn của tài liệu. Xem và tải ngay bản đầy đủ của tài liệu tại đây (481.99 KB, 9 trang )
Open Access
Available online />Page 1 of 9
(page number not for citation purposes)
Vol 9 No 5
Research article
Spectrocolorimetric assessment of cartilage plugs after
autologous osteochondral grafting: correlations between color
indices and histological findings in a rabbit model
Koji Hattori
1,2
, Kota Uematsu
2
, Yohei Tanikake
2
, Takashi Habata
2
, Yasuhito Tanaka
2
,
Hiroshi Yajima
2
and Yoshinori Takakura
2
1
Department of DAIWA HOUSE Indoor Environmental Medicine, Nara Medical University, Kashihara, Nara, Japan
2
Department of Orthopaedic Surgery, Nara Medical University, Kashihara, Nara, Japan
Corresponding author: Koji Hattori,
Received: 6 Jun 2007 Revisions requested: 31 Jul 2007 Revisions received: 20 Aug 2007 Accepted: 10 Sep 2007 Published: 10 Sep 2007
Arthritis Research & Therapy 2007, 9:R88 (doi:10.1186/ar2287)
This article is online at: />© 2007 Hattori et al.; licensee BioMed Central Ltd.
This is an open access article distributed under the terms of the Creative Commons Attribution License ( />),
which permits unrestricted use, distribution, and reproduction in any medium, provided the original work is properly cited.
Abstract
We investigated the use of a commercial spectrocolorimeter
and the application of two color models (L* a* b* colorimetric
system and spectral reflectance distribution) to describe and
quantify cartilage plugs in a rabbit model of osteochondral
autografting. Osteochondral plugs were removed and then
replaced in their original positions in Japanese white rabbits. The
rabbits were sacrificed at 4 or 12 weeks after the operation and
cartilage samples were assessed using a spectrocolorimeter.
The samples were retrospectively divided into two groups on the
basis of the histological findings (group H: hyaline cartilage,
successful; group F: fibrous tissue or fibrocartilage, failure) and
investigated for possible significant differences in the
spectrocolorimetric analyses between the two groups.
Moreover, the relationships between the spectrocolorimetric
indices and the Mankin histological score were examined. In the
L* a* b* colorimetric system, the L* values were significantly
lower in group H than in group F (P = 0.02), whereas the a*
values were significantly higher in group H than in group F (P =
0.006). Regarding the spectral reflectance distribution, the
spectral reflectance percentage 470 (SRP
470
) values, as a
coincidence index for the spectral reflectance distribution (400
to 470 nm in wavelength) of the cartilage plugs with respect to
intact cartilage, were 99.8 ± 6.7% in group H and 119.8 ±
10.6% in group F, and the difference between these values was
significant (P = 0.005). Furthermore, the a* values were
significantly correlated with the histological score (P = 0.004, r
= -0.76). The SRP
470
values were also significantly correlated
with the histological score (P = 0.01, r = 0.67). Our findings
demonstrate the ability of spectrocolorimetric measurements to
predict the histological findings of cartilage plugs after
autologous osteochondral grafting. In particular, the a* values
and SRP
470
values can be used to judge the surface condition
of an osteochondral plug on the basis of objective data.
Therefore, spectrocolorimetry may contribute to orthopedics,
rheumatology and related research in arthritis, and arthroscopic
use of this method may potentially be preferable for in vivo
assessment.
Introduction
Although articular cartilage shows durability and the ability to
maintain itself, it has limited capacity for repair [1,2]. The repair
cartilage that forms as a result of articular injury has a different
structure from hyaline cartilage and exhibits inferior mechani-
cal properties and wear characteristics. Thus, once damage
has occurred, it continues to accumulate, eventually leading to
complete loss of the articular surface and exposure of the
underlying bone. These changes are almost always associated
with severely impaired joint function and clinical symptoms of
redness, swelling and pain [1,3,4]. Therefore, the poor quality
of cartilage repair tissue has led surgeons to develop proce-
dures intended to improve articular cartilage repair, thereby
improving joint function and decreasing joint pain. Several sur-
gical techniques are currently used in clinical practice, namely
debridement, microfracture, drilling, abrasion arthroplasty,
autologous osteochondral grafting (OCG) and cultured autol-
ogous chondrocyte transplantation [3-7].
MRI = magnetic resonance imaging; OCG = autologous osteochondral grafting; SRP = spectral reflectance percentage.
Arthritis Research & Therapy Vol 9 No 5 Hattori et al.
Page 2 of 9
(page number not for citation purposes)
OCG has become popular as a means for treating articular
cartilage defects [5,8]. This technique involves transplantation
of osteochondral plugs from a non-weightbearing region to the
defect lesion. OCG has several advantages over other surgi-
cal treatments for articular cartilage defects. Specifically,
OCG is currently the only technique able to fill a joint surface
defect with hyaline cartilage, is a relatively simply method com-
pared with autologous chondrocyte transplantation, shows lit-
tle immunological rejection and is disease-free. However, 5%
to 20% of the procedures fail overtly, and several authors have
noted the presence of fibrillation or fibrocartilage formation in
patients on later histological examination [8-11]. Fibrillation or
conversion to fibrocartilage is considered undesirable
because these tissues are less smooth and less stiff than nor-
mal cartilage and may tend to slough over time. However, the
fibrous overgrowth is grossly similar in appearance to normal
articular cartilage, and histological differences may not be
obvious in subsequent arthroscopic evaluation [11].
We have investigated the use of a commercial spectrocolorim-
eter and the application of two color models (L* a* b* colori-
metric system and spectral reflectance distribution) to
describe and quantify articular cartilage. Previously, we meas-
ured the colors of rabbit knee cartilage using a spectrocolor-
imeter. However, no studies have yet focused on
spectrocolorimetric and histological assessment of cartilage
plugs after OCG. The purpose of the present study was to
determine the efficacy of a spectrocolorimeter for evaluating
OCG. To this end, we quantitatively evaluated osteochondral
cartilage plugs using an experimental rabbit model.
Materials and methods
Experimental model: rabbit OCG model
The Animal Research Committee of Nara Medical University
approved this investigation. Fifteen adult Japanese white rab-
bits underwent the following surgical procedure under
anesthesia with ketamine (35 mg/kg intramuscularly) and xyla-
zine (7 mg/kg intramuscularly). The rabbits were placed in the
supine position and surgery was performed on the left knee.
After shaving and sterile prepping of the lower limb, an anter-
omedial arthrotomy was performed in the left knee. The patella
was dislocated laterally and the patellar groove was exposed.
OCG was performed in the patellar groove. A full-thickness
cylindrical osteochondral plug (5 mm in diameter, 5 mm in
depth) was harvested using an Osteochondral Autograft
Transfer System (OATS; Arthrex, Naples, FL, USA), and sub-
sequently returned to its original position, such that the articu-
lar surface of the plug was flush with the surrounding native
articular cartilage. The knee wound was irrigated with saline
solution and closed in layers with 2-0 vicryl sutures. No cast
was applied to the lower leg. The right knee was left without
treatment as a control. The rabbits were sacrificed with an
overdose of phenobarbital sodium salt at 4 or 12 weeks after
the operation.
Macroscopic evaluation and scoring
After sacrifice, each knee joint was opened and dissected free
from all the soft tissues before the tibia was removed. The car-
tilage surfaces were observed with the naked eye and photo-
graphed. Each cartilage plug was graded for its gross
appearance according to Moran and colleagues [12] (Table 1)
by one blinded observer (TH).
Spectrocolorimetric measurements
Articular cartilage evaluation was performed using a commer-
cial spectrocolorimeter (X-Rite SP64; X-Rite KK, Tokyo,
Japan) driven by a software program (Color/Reader I; Color
Techno System Corp., Tokyo, Japan). The reference illumina-
tion was D 65 (standard daylight), the geometry was d/8, the
incident light was diffuse and the observation angle was 10°,
according to the Commission Internationale d'Eclairage (CIE)
15.2 publication and International Organization for Standardi-
zation (ISO) 7724/1 recommendations. The X-Rite SP64 was
positioned with minimal pressure perpendicular to the object
and the data were reported in the L* a* b* colorimetric system
and the spectral reflectance distribution of the object's color.
The L* a* b* colorimetric system is currently the most widely
used system for color analysis and is composed of three coor-
dinates, namely color lightness and two coordinates related to
chromatic components. The L* (luminance) value measures
brightness ranging from black (0) to white (100), while the a*
value expresses the color spectrum from green (-) to red (+)
and the b* value expresses the color spectrum from blue (-) to
yellow (+). Regarding the other index of cartilage color evalu-
ation, the spectral reflectance distribution was automatically
calculated at 10 nm wavelength intervals from 400 to 700 nm.
The X-Rite SP64 had a measuring area of 4 mm in diameter.
To calibrate the instrument, a standard white plate and black
Figure 1
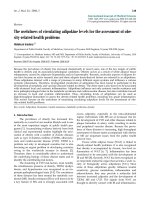
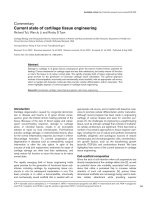
Standard L*, a* and b* values (mean ± standard deviation) and stand-ard spectral reflectance curve (thick line, mean; broken lines, ± stand-ard deviation) of Japanese white rabbit cartilage (n = 19)Standard L*, a* and b* values (mean ± standard deviation) and stand-
ard spectral reflectance curve (thick line, mean; broken lines, ± stand-
ard deviation) of Japanese white rabbit cartilage (n = 19).
Available online />Page 3 of 9
(page number not for citation purposes)
trap were used. The X-Rite SP64 was positioned with minimal
pressure perpendicular to the cartilage plug or the intact car-
tilage area as a control. Three consecutive measurements of
the L*, a* and b* values and the spectral reflectance ratio per
site were averaged for each cartilage measurement. Previ-
ously, we determined the standard L*, a* and b* values and the
standard spectral reflectance ratio of intact articular cartilage
in Japanese white rabbits (Figure 1). As a coincidence index
for the spectral reflectance distribution of the cartilage plug
after OCG with respect to intact cartilage, the spectral reflect-
ance percentage (SRP) was determined. The SRP
700
values
between 400 and 700 nm in wavelength and the SRP
470
val-
ues between 400 and 470 nm in wavelength were expressed
using the following equations:
y = f(x), y = g(x), x: wavelength, y: reflectance ratio
where f(x) is the numerical formula of the cartilage plug sample
in the spectral reflectance graph and g(x) is the numerical for-
mula of the intact cartilage sample (standard) in the spectral
reflectance graph (Figure 1).
Histological evaluation and scoring
After the spectrocolorimetric evaluation, the specimens were
fixed in 10% neutral-buffered formalin, decalcified in 0.25 mol/
l EDTA in phosphate-buffered saline, dehydrated through a
graded ethanol series and embedded in paraffin wax. Sagittal
sections (5 μm thick) were cut and then stained with hematox-
ylin and eosin, toluidine blue and Safranin-O fast green. Each
section was graded using the histological scale described by
Mankin and colleagues [13] (Table 2). Histological assess-
ments were performed by one blinded observer (YT). Cartilage
samples were divided into two groups on the basis of the his-
Table 1
Modified Moran's scoring system
Category Grade
I. Intra-articular adhesion
None 2
Minimal (fine, loose fibrous tissue) 1
Major (thick, dense fibrous tissue) 0
II. Restoration of articular surface contour
Complete 2
Partial 1
None 0
III. Erosion of cartilage
None 2
Graft only 1
Graft and adjacent normal cartilage 0
IV. Appearance of cartilage
Translucent 2
Opaque 1
Discolored or irregular 0
SRP
700
400
700
400
700
100=×
∫∫
f x dx g x dx() / () (%)
SRP
470
400
470
400
470
100=×
∫∫
f x dx g x dx() / () (%)
Table 2
Mankin's histological histochemical grading
Category Grade
I. Structure
Normal 0
Surface irregularities 1
Pannus and surface irregularities 2
Clefts to transitional zone 3
Clefts to radial zone 4
Clefts to calcified zone 5
Complete disorganization 6
II. Cells
Normal 0
Diffuse hypercellularity 1
Cloning 2
Hypocellularity 3
III. Safranin-O staining
Normal 0
Slightly reduced 1
Moderate reduced 2
Severe reduced 3
No dye noted 4
IV. Tidemark integrity
Intact 0
Crossed by blood vessels 1
Arthritis Research & Therapy Vol 9 No 5 Hattori et al.
Page 4 of 9
(page number not for citation purposes)
tological findings of the plug surface by another blinded
observer (TH) as follows: group H, the cartilage plug retained
the features of hyaline cartilage; group F, the cartilage plug
consisted of fibrous tissue and/or fibrocartilage. The samples
were retrospectively divided into the two groups and investi-
gated for possible significant differences in the spectrocolori-
metric analyses between the two groups.
Statistical analysis
Differences among spectrocolorimetric data were analyzed
using the non-parametric Mann-Whitney U-test. The relation-
ships between spectrocolorimetric data and the histological
score were analyzed using the non-parametric Spearman's
rank-order correlation method. The significance level was set
at P < 0.05.
Results
Macroscopic findings
Gross inspections were performed at 4 and 12 weeks after
the operation. OCG displayed similar cartilage to the sur-
rounding cartilage at both intervals. The margin around each
osteochondral plug was a little faint but still detectable. The
surface of the cartilage plugs appeared to be almost smooth.
All of the surfaces were glistening and white in appearance.
From the macroscopic findings, no histological differences
could be detected among the cartilage plugs. The mean
macroscopic scores were 5.8 points at 4 weeks and 5.9
points at 12 weeks. There was no significant difference
between the macroscopic scores at 4 and 12 weeks (P =
0.54).
Spectrocolorimetric findings
Color measurements were carried out on the cartilage plugs
and the control cartilage (patella groove of the right knee). The
differences in the L*, a* and b* values of the cartilage plugs at
4 and 12 weeks after the operation and the control cartilage
are shown in Table 3. There were no significant differences in
the L*, a* and b* values at 4 and 12 weeks after the operation.
Compared to the control cartilage, the cartilage plugs at 4
weeks had significantly lower b* values (P = 0.004) and the
cartilage plugs at 12 weeks had significantly lower L* and b*
values (P = 0.02 and P = 0.003, respectively).
The SRP
700
values (mean ± standard deviation), as a coinci-
dence index of the spectral reflectance curves, were 89.1 ±
11.6% at 4 weeks and 93.1 ± 7.2% at 12 weeks. There were
no significant differences in the SRP
700
values between the
two groups. The SRP
470
values were 107 ± 16% at 4 weeks
and 108.3 ± 11.6% at 12 weeks. There were no significant
differences in the SRP
470
values between the two groups. The
SRP
700
values of the control cartilage were 99.7 ± 7.2% at 4
weeks and 100.3 ± 3.8% at 12 weeks. The SRP
470
values of
the control cartilage were 100.4 ± 5.2% at 4 weeks and 101.5
± 5.6% at 12 weeks. Compared to the control cartilage, no
significant differences were seen in all groups (Figure 2).
Histological findings
All osteochondral plugs had united in the subchondral area.
Eight cartilage plugs (2 at 4 weeks and 6 at 12 weeks) were
thicker than the surrounding intact cartilage, while 7 cartilage
plugs (4 at 4 weeks and 3 at 12 weeks) were almost the same
thickness as the adjacent intact cartilage. The mean histologi-
cal scores were 2.0 at 4 weeks and 1.4 at 12 weeks. There
was no significant difference between the histological scores
at 4 and 12 weeks (P = 0.51).
From the histological findings, the samples were divided into
two groups. Specifically, 9 samples (3 at 4 weeks and 6 at 12
weeks) were classified into group H (Figure 3a,c) and 6 sam-
ples (3 at 4 weeks and 3 at 12 weeks) were classified into
group F (Figure 3b,d). The histological findings of group H
revealed that the cartilage plugs were inserted flush with the
surrounding articular surface and maintained the characteris-
tics of hyaline cartilage. The histological findings of group F
Table 3
L* a* b* color change of the plug cartilage at 4 and 12 weeks after osteochondral autograft
Parameter 4 weeks 12 weeks P value
a
L* value 58.3 ± 3.9 59.5 ± 2.2
b
NS
L* value/control 62.7 ± 2.8 62.4 ± 1.6
a* value 3.0 ± 1.3 3.3 ± 0.9 NS
a* value/control 2.2 ± 1.0 2.4 ± 0.9
b* value -0.8 ± 1.6
b
0.1 ± 2.0
b
NS
b* value/control 6.1 ± 1.1 6.6 ± 1.6
Data are mean ± standard deviation.
a
P values based on Mann-Whitney U-test, 4 weeks versus 12 weeks.
b
P < 0.05 versus control. NS, not
significant.
Available online />Page 5 of 9
(page number not for citation purposes)
showed that the cartilage plugs had sunk or become tilted
below the level of the surrounding articular surface and their
surfaces had become covered with fibrous tissue and/or fibro-
cartilage. The mean histological scores were 0.6 in group H
and 3.3 in group F. There was a significant difference between
the histological scores for groups H and F (P = 0.001).
Spectrocolorimetric findings for groups H and F
The histological differences in the L*, a* and b* values of the
cartilage plugs and the control cartilage are shown in Table 4.
The L* values were significantly lower in group H than in group
F (P = 0.02), whereas the a* values were significantly higher
in group H than in group F (P = 0.006). However, the b* values
in groups H and F did not differ significantly (P = 0.16). Com-
pared to the control cartilage, the cartilage plugs in group H
had significantly lower L* and b* values and higher a* values
(P = 0.001, P = 0.003 and P = 0.003, respectively) and the
cartilage plugs in group F had significantly lower b* values (P
= 0.003).
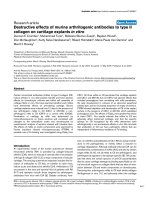
Typical examples of the spectral reflectance curves for control
hyaline cartilage, group H and group F are shown in Figure 4.
The spectral curves of all the groups showed two dips at 420
and 560 nm and a specific peak around 490 nm. There was a
gradual increase in the spectral reflectance ratio from 620 to
700 nm. Across all the measured wavelengths, there was a
low reflectance ratio in group H compared with control
cartilage. As a characteristic difference, group F had a higher
spectral reflectance ratio than control cartilage between 400
to 470 nm. The SRP
700
values were 86.9 ± 6.7% in group H
and 98.4 ± 7.7% in group F, and the difference between these
values was significant (P = 0.018). The SRP
470
values were
99.8 ± 6.7% in group H and 119.8 ± 10.6% in group F, and
the difference between these values was also significant (P =
0.005). The SRP
700
values of the control cartilage were 100.4
± 6.3% in group H and 99.5 ± 3.3% in group F. The SRP
470
values of the control cartilage were 101.9 ± 6.6% in group H
and 99.7 ± 2.3% in group F. Compared to the control carti-
lage, there were significant differences for the SRP
700
values
of group H (P = 0.001) and the SRP
470
values of group F (P
= 0.004) (Figure 5).
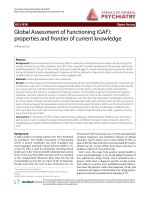
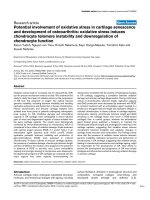
Figure 2
Bar graphs representing the spectral reflectance percentages (SRPs) of the cartilage plugs at 4 and 12 weeks (4 w and 12 w, respectively) after transplantationBar graphs representing the spectral reflectance percentages (SRPs)
of the cartilage plugs at 4 and 12 weeks (4 w and 12 w, respectively)
after transplantation. The black bar represents the control cartilage for
each group. The SRP values are used as a coincidence index of the
spectral reflectance distribution of the repaired cartilage with respect
to standard intact cartilage. The SRP
700
values of the cartilage plugs
are used as a coincidence index between 400 and 700 nm in wave-
length (left four bars), while the SRP
470
values of the cartilage plugs are
used as a coincidence index between 400 and 470 nm in wavelength
(right four bars). Error bars represent the standard deviation of each
group.
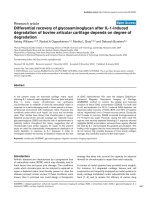
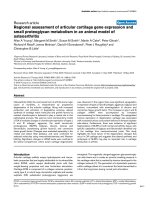
Figure 3
Photomicrographs of cartilage plugs (between the arrows)Photomicrographs of cartilage plugs (between the arrows). (a,b) At
four weeks postoperatively, three plugs were still flush with the sur-
rounding cartilage and retained the hyaline cartilage characteristics (a),
while three plugs had sunk or become tilted and their surfaces were
covered with newly formed fibrocartilaginous tissue (b). (c,d) At 12
weeks postoperatively, 6 plugs retained the hyaline cartilage character-
istics (c), while 3 plugs had sunk or become tilted and their surfaces
were covered with fibrous tissue (d). Safranin-O fast-green staining;
original magnification ×2.5.
Arthritis Research & Therapy Vol 9 No 5 Hattori et al.
Page 6 of 9
(page number not for citation purposes)
Relationships between spectrocolorimetric data and the
histological score
The histological score was significantly correlated with the a*
values (P = 0.004, r = -0.76) and the SRP
470
values (P = 0.01,
r = 0.67) (Figure 6), but not correlated with the L*, b* or
SRP
700
values.
Discussion
In the present study, cartilage plugs after OCG were evalu-
ated quantitatively using the L* a* b* colorimetric system and
the spectral reflectance distribution. Our findings demonstrate
the ability of spectrocolorimetric measurements to predict the
histological findings of cartilage plugs after OCG. In particular,
the a* values and SRP
470
values can be used to judge the sur-
face condition of an osteochondral plug on the basis of objec-
tive data.
As new cartilage treatment methods come into use, there will
be a requirement for non-invasive evaluation of the regener-
ated cartilage. A reliable evaluation method, if established,
would assist in the solution of the important clinical question
regarding the type of cartilage regenerated in lesions, that is,
hyaline cartilage or fibrocartilage (fibrous tissue). Magnetic
resonance imaging (MRI) may be the most powerful tool for
evaluating articular cartilage [14-16]. White and colleagues
[16] reported that qualitative and quantitative T2 mapping was
useful for differentiating hyaline cartilage from reparative fibro-
cartilage after cartilage repair using 1.5T MRI. Using optical
coherence tomography, Li and colleagues [17] demonstrated
real-time imaging of human cartilage in normal and
osteoarthritic knee joints. Optical coherence tomography suc-
Table 4
L* a* b* color change of the plug cartilage in groups H and F
Parameter Group H Group F P value
a
L* value 57.5 ± 2.4
b
61.2 ± 2.3 P = 0.02
L* value/control 62.3 ± 2.0 62.9 ± 2.3
a* value 3.7 ± 0.7
b
2.4 ± 0.8 P = 0.007
a* value/control 2.5 ± 0.8 2.0 ± 1.0
b* value 0.3 ± 1.8
b
-1.1 ± 1.7
b
NS
b* value/control 6.2 ± 1.5 6.8 ± 1.4
Data are mean ± standard deviation.
a
P values based on Mann-Whitney U-test, group H versus F, 12 weeks.
b
P < 0.05 versus control. NS, not
significant.
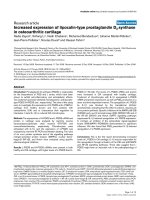
Figure 4
Spectral reflectance curves of groups H and FSpectral reflectance curves of groups H and F. Group H consisted of
cartilage plugs that retained the features of hyaline cartilage, while
group F consisted of cartilage plugs that had become covered with
fibrous tissue and/or fibrocartilage. The control samples were intact
articular cartilage.
Figure 5
Bar graphs representing the spectral reflectance percentages (SRPs) of groups H and FBar graphs representing the spectral reflectance percentages (SRPs)
of groups H and F. The black bar represents the control cartilage for
each group. The SRP
700
values of groups H and F (left four bars) and
SRP
470
values of groups H and F (right four bars) are shown. Error bars
represent the standard deviation of each group. *P < 0.05, group H
versus group F; **P < 0.05, versus the control; non-parametric Mann-
Whitney U-test.
Available online />Page 7 of 9
(page number not for citation purposes)
cessfully revealed structural changes, including cartilage thin-
ning, fissures and fibrillation, at substantially higher resolutions
than those achieved with other currently used clinical imaging
technologies. Furthermore, high-frequency ultrasound tech-
niques were recently introduced for detecting the features of
regenerated and degenerated cartilage [18-21]. Our previous
study revealed that ultrasound analysis can predict the micro-
structure of regenerated cartilage, and in particular, that this
method can differentiate hyaline cartilage from fibrocartilage
[22,23]. Laasanen and colleagues [24] further showed that
quantitative ultrasound imaging offered diagnostic information
regarding the impaired structural integrity of spontaneously
repaired cartilage. The present study demonstrates the first
spectrocolorimetric assessment of cartilage plugs after OCG.
The application of spectrocolorimetry for medical research is
popular in the fields of dermatology and plastic surgery [25-
28]. Bohnert and colleagues [25] evaluated subcutaneous
bruises after visible contusions in 50 corpses, and found a
relationship between the color impression and the localization
of the bruise. Li-Tsang and colleagues [26,27] used
spectrocolorimetry for scar pigmentation, and found that it
showed satisfactory reliability and reproducibility for clinical
research. However, there are few published studies of articular
cartilage evaluation by spectrocolorimetry. Katayama and col-
leagues [28] tried to evaluate intact and degenerated menis-
cuses, while Pilin and colleagues [29] used a digital camera
and reported that the color changes of intervertebral discs and
rib cartilage were good tools for age estimation.
Based on the findings of the present study, cartilage plugs
after OCG can be effectively evaluated by spectrocolorimetry.
However, we used the L* a* b* values and SRP values as
quantitative indices of the cartilage plugs after OCG, and it is
not known what these indices are closely related to. The L* val-
ues express the white of the cartilage color, while the a* values
express the red of the cartilage color. In the present study, we
observed that group H had low L* values and high a* values,
whereas group F had high L* values and low a* values. The dif-
ferences in the L* values imply that the cartilage plug colors
differed subtly between the two groups, from translucent (the
state of hyaline cartilage) to white (the color of fibrocartilage).
Regarding the a* values, several studies on skin color have
revealed that the a* values of skin are mainly affected by the
degree of blood flow [30,31]. In our cartilage study, the a* val-
ues of cartilage should be affected by the blood color of the
subchondral bone. Therefore, it is reasonable that the
translucent hyaline cartilage had higher a* values than the
opaque fibrocartilage.
The spectral reflectance curve represents the most accurate
data that can be provided for the characteristics of cartilage
color. Therefore, SRP values as a coincidence index for the
spectral reflectance distribution were used in the present
study. In the dermis, the scattering process of optical radiation
due to type I collagen fibers is dominant and skin reflects more
light with short wavelengths [25,32]. In the present study, car-
tilage plugs that maintained a hyaline cartilage surface showed
SRP
470
values of close to 100%, while cartilage plugs that
failed to maintain a hyaline cartilage surface and became cov-
ered by fibrocartilage and/or fibrous tissue had SRP
470
values
of >100%. Therefore, we suggest that type II collagen is more
transparent to light with short wavelengths than type I
collagen. Moreover, the SRP
470
values can provide diagnosti-
cally important information about cartilage plugs after OCG.
Further detailed research on the assessment of articular carti-
lage using spectrocolorimetry is now required.
Several limitations of our study should be considered. First, a
total cartilage area of 4 mm in diameter could be measured at
one time. The measurement area of 4 mm in diameter seems
to be too large for the assessment of articular cartilage.
Although the proper measurement area should be discussed
further, most cartilage defect areas in experimental models are
Figure 6
Correlations of the histological scores from microscopic findings and the spectrocolorimetric indicesCorrelations of the histological scores from microscopic findings and
the spectrocolorimetric indices. (a) The a* values are significantly cor-
related with the Mankin histological score (P = 0.004, r = -0.76). (b)
The SRP
470
values are significantly correlated with the Mankin histolog-
ical score (P = 0.01, r = 0.67). P < 0.05 by non-parametric Spearman's
rank-order correlation.
Arthritis Research & Therapy Vol 9 No 5 Hattori et al.
Page 8 of 9
(page number not for citation purposes)
larger than 4 mm in diameter [33-35]. Therefore,
spectrocolorimetry is suitable for in vivo animal studies. Sec-
ond, the present machine is too big for use in arthroscopy, and
modified machines will be required for clinical assessment of
living human cartilage. Finally, the cartilage samples in this
study were not human but rabbit cartilage, although spectro-
colorimetric assessment of human cartilage is now under
investigation.
Conclusion
The spectrocolorimetric analysis used in the present study
was capable of judging the surface condition of an osteochon-
dral plug on the basis of objective data. Therefore, spectro-
colorimetry may contribute to orthopedics, rheumatology and
related research in arthritis, and arthroscopic use of this
method may potentially be preferable for in vivo assessment.
However, the present machine is too big for use in arthros-
copy, and smaller spectrocolorimeters suitable for arthro-
scopic use are presently being developed.
Competing interests
The authors declare that they have no competing interests.
Authors' contributions
KH conceived the study, participated in its design and per-
formed all the experiments. KU, YT and HY performed the ani-
mal study. TH performed the macroscopic and histological
assessments. YT performed the histological assessments. YT
participated in the design of the animal study.
Acknowledgements
We appreciate the advice and expertise of Mr Daishi Kato. This work
was supported by a Grant-in-Aid for Young Scientists (B) from the Min-
istry of Education, Culture, Sports, Science and Technology of Japan.
The study sponsors had no role in the study design, data collection, data
analysis or data interpretation, or in the writing of the report.
References
1. Mankin HJ, Maw VC, Buckwalter JA: Articular cartilage repair
and osteoarthritis. In Orthopaedic Basic Science 2nd edition.
Edited by: Buckwalter JA, Einhorn TA, Simon SR. Rosemont, IL:
American Academy of Orthopaedic Surgeons; 2000:472-488.
2. Aigner T, Fan Z: Anatomy and biochemistry of articular carti-
lage. In Cartilage Surgery and Future Perspectives Edited by:
Hendrich C, Nöth U, and Eulert J. Berlin: Springer-Verlag;
2003:3-7.
3. Buckwalter JA: Articular cartilage injuries. Clin Orthop 2002,
402:21-37.
4. Buckwalter JA, Mankin HJ: Articular cartilage part II: degenera-
tion and osetoarthrosis, repair regeneration, and
transplantation. J Bone Joint Surg Am 1997, 79:612-632.
5. Matsusue Y, Yamamuro T, Hama H: Arthroscopic multiple ose-
tochondral transplantation to the chondral defect in the knee
associated with anterior cruciate ligament disruption. Arthros-
copy 1993, 9:318-321.
6. Brittberg M, Lindahl A, Nilsson A, Ohlsson C, Isaksson O, Peter-
son L: Treatment of deep cartilage defects in the knee with
autologous chondrocyte transplantation. N Engl J Med 1994,
331:889-895.
7. Ochi M, Uchio Y, Kawasaki K, Wakitani S, Iwasa J: Transplanta-
tion of cartilage-like tissue made by tissue engineering in the
treatment of cartilage defects of the knee. J Bone Joint Surg
Br 2002, 84:571-578.
8. Hangody L, Füles P: Autologous osteochondral mosaicplasty
for the treatment of full-thickness defects of weight-bearing
joints. Ten years of experimental and clinical experience. J
Bone Joint Surg Am 2003, 85:25-32.
9. Roffman M: Combined auto- and alloosteochondral grafts for
large defects. J Trauma 1986, 26:189-191.
10. Wang CJ: Treatment of focal articular cartilage lesions of the
knee with autogenous osteochondral grafts: a 2- to 4-year fol-
low-up study. Arch Orthop Trauma Surg 2002, 122:169-172.
11. Huang FS, Simonian PT, Norman AG, Clark JM: Effects of small
inconcruities in a sheep model of osteochondral autografting.
Am J Sports Med 2004, 32:1842-1848.
12. Moran ME, Kim HK, Salter RB: Biological resurfacing of full-
thickness defects in patellar articular cartilage of the rabbit.
Investigation of autogenous periosteal grafts subjected to
continuous passive motion. J Bone Joint Surg Br 1992,
74:659-667.
13. Mankin HJ, Dorfman H, Lippiello L, Zarins A: Biochemical and
metabolic abnormalities in articular cartilage from osteo-
arthritic human hips. II. Correlation of morphology with bio-
chemical and metabolic data. J Bone Joint Surg Am 1971,
53:523-537.
14. Roberts S, McCall IW, Darby AJ, Menage J, Evans H, Harrison PE,
Richardson JB: Autologous chondrocyte implantation for carti-
lage repair: monitoring its success by magnetic resonance
imaging and histology. Arthritis Res Ther 2003, 5:R60-73.
15. Trattnig S, Millington SA, Szomolanyi P, Marlovits S: MR imaging
of osteochondralgrafts and autologous chondrocyte
implantation. Eur Radiol 2007, 17:103-118.
16. White LM, Sussman MS, Hurting M, Probyn L, Tomlinson G, Kan-
del R: Cartilage T2 assessment: differentiation of normal hya-
line cartilage and reparative tissue after arthroscopic cartilage
repair in equine subjects. Radiology 2006, 241:407-414.
17. Li X, Martin S, Pitris C, Ghanta R, Stamper DL, Harman M, Fujimoto
JG, Brezinski ME: High-resolution optical coherence tomo-
graphic imaging of osteoarthritic cartilage during open knee
surgery. Arthritis Res Ther 2005, 7:R318-323.
18. Töyräs J, Rieppo J, Nieminen MT, Helminen HJ, Jurvelin JS: Char-
acterization of enzymatically induced degradation of articular
cartilage using high frequency ultrasound. Phys Med Biol
1999, 44:2723-2733.
19. Cherin E, Saied A, Pellaumail B, Loeuille D, Laugier P, Gillet P, Net-
ter P, Berger G: Assessment of rat articular cartilage matura-
tion using 50-MHz quantitative ultrasonography. Osteoarthritis
Cartilage 2001, 9:178-186.
20. Hattori K, Ikeuchi K, Morita Y, Takakura Y: Quantitative ultrasonic
assessment for detecting microscopic cartilage damage in
osteoarthritis. Arthritis Res Ther 2005, 7:R38-46.
21. Hattori K, Takakura Y, Ohgushi H, Habata T, Uematsu K, Yamauchi
J, Yamashita K, Fukuchi T, Sato M, Ikeuchi K: Quantitative ultra-
sound can assess the regeneration process of tissue-engi-
neered cartilage using a complex between adherent bone
marrow cells and a three-dimensional scaffold. Arthritis Res
Ther 2005, 7:R552-559.
22. Hattori K, Takakura Y, Morita Y, Takenaka M, Uematsu K, Ikeuchi
K: Can ultrasound predict histological findings in regenerated
cartilage? Rheumatology 2004, 43:302-305.
23. Hattori K, Takakura Y, Ohgushi H, Habata T, Uematsu K, Takenaka
M, Ikeuchi K: Which cartilage is regenerated, hyaline cartilage
or fibrocartilage? Non-invasive ultrasonic evaluation of tissue-
engineered cartilage. Rheumatology 2004, 43:1106-1108.
24. Laasanen MS, Töyräs J, Vasara A, Saarakkala S, Hyttinen MM, Kivi-
ranta I, Jurvelin JS: Quantitative ultrasound imaging of sponta-
neous repair of porcine cartilage. Osteoarthritis Cartilage 2006,
14:258-263.
25. Bohnert M, Baumgartner R, Pollak S: Spectrophotometric evalu-
ation of the colour on intra- and subcutaneous bruises. Int J
Legal Med 2000, 113:343-348.
26. Li-Tsang CWP, Lau JCM, Liu SKY: Validation of an objective
scar pigmentation measurement by using a
spectrocolorimeter. Burns 2003, 29:779-784.
27. Li-Tsang CWP, Lau JCM, Chan CCH: Prevalence of hyper-
trophic scar formation and its characteristics among Chinese
population. Burns 2005, 31:610-616.
28. Katayama N, Ishikawa T, Ohshima Y, Hurukawa H: Difference of
the degenerative meniscal color between in air and in water.
Arthoscopy 2002, 27:177-181.
Available online />Page 9 of 9
(page number not for citation purposes)
29. Pilin A, Pudil F, Bencko V: Changes in colour of different human
tissues as a marker of age. Int J Legal Med 2007, 121:158-162.
30. Yamatomo Y: Colorimetric evaluation of skin color in the
Japanese. Plast Reconstr Surg 1995, 96:139-145.
31. Ham K, Choi T, Son D: Skin color of Koreans: statistical evalu-
ation of affecting factors. Skin Res Technol 2006, 12:170-177.
32. Findlay GH: Blue skin. Br J Dermatol 1970, 83:127-134.
33. Schaefer D, Martin I, Jundt G, Siedel J, Heberer M, Grodzinsky A,
Bergin I, Vunjak-Novakovic G, Freed LE: Tissue-engineered
composites for the repair of large osteochondral defects.
Arthritis Rheum 2002, 46:2524-2534.
34. Wakitani S, Kimura T, Hirooka A, Ochi T, Yoneda M, Yasui N,
Owaki H, Ono K: Repair of rabbit articular surfaces with allo-
graft chondrocytes embedded in collagen gel. J Bone Joint
Surg Br 1989, 71:74-80.
35. O'Driscoll SW, Keeley FW, Salter RB: The chondrogenic poten-
tial of free autogenous periosteal grafts for biological resur-
facing of major full-thickness defects in joint surfaces under
the influence of continuous passive motion. J Bone Joint Surg
Am 1986, 68:1017-1035.