Báo cáo y học: "Passage and reversal effects on gene expression of bovine meniscal fibrochondrocytes" pdf
Bạn đang xem bản rút gọn của tài liệu. Xem và tải ngay bản đầy đủ của tài liệu tại đây (316.07 KB, 12 trang )
Open Access
Available online />Page 1 of 12
(page number not for citation purposes)
Vol 9 No 5
Research article
Passage and reversal effects on gene expression of bovine
meniscal fibrochondrocytes
Najmuddin J Gunja and Kyriacos A Athanasiou
Department of Bioengineering, Rice University, PO Box 1892, Houston, TX 77251, USA
Corresponding author: Kyriacos A Athanasiou,
Received: 9 Mar 2007 Revisions requested: 25 Apr 2007 Revisions received: 5 Sep 2007 Accepted: 13 Sep 2007 Published: 13 Sep 2007
Arthritis Research & Therapy 2007, 9:R93 (doi:10.1186/ar2293)
This article is online at: />© 2007 Gunja and Athanasiou; licensee BioMed Central Ltd.
This is an open access article distributed under the terms of the Creative Commons Attribution License ( />),
which permits unrestricted use, distribution, and reproduction in any medium, provided the original work is properly cited.
Abstract
The knee meniscus contains a mixed population of cells that
exhibit fibroblastic as well as chondrocytic characteristics.
Tissue engineering studies and future therapies for the
meniscus require a large population of cells that are seeded on
scaffolds. To achieve this, monolayer expansion is often used as
a technique to increase cell number. However, the phenotype of
these cells may be significantly different from that of the primary
population. The objective of this study was to investigate
changes in meniscal fibrochondrocytes at the gene expression
level over four passages using quantitative real-time reverse
transcriptase polymerase chain reaction. Cells from the inner
two-thirds of bovine medial menisci were used. Four
extracellular matrix (ECM) molecules, commonly found in the
meniscus, were investigated, namely collagen I, collagen II,
aggrecan and cartilage oligomeric matrix protein (COMP). In
addition, primary and passaged meniscus fibrochondrocytes
were placed on surfaces coated with collagen I or aggrecan
protein to investigate whether any gene expression changes
resulting from passage could be reversed. Collagen I expression
was found to increase with the number of passages, whereas
collagen II and COMP expression decreased. Collagen I and
aggrecan surface coatings were shown to downregulate and
upregulate collagen I and COMP expression levels, respectively,
in passaged cells. However, decreases in collagen II expression
could not be reversed by either protein coating. These results
indicate that although monolayer expansion results in significant
changes in gene expression in meniscal fibrochondrocytes,
protein coatings may be used to regain the primary cell
expression of several ECM molecules.
Introduction
The meniscus is a wedge-shaped fibrocartilaginous tissue
located in the knee joint. As reviewed elsewhere, it serves sev-
eral mechanical functions including shock absorption, load
transmission, joint stability and joint lubrication [1,2]. Injuries to
the meniscus can result in significant pain and discomfort to
the patient, as well as in increasing the average stress in the
knee joint, causing damage to the articular cartilage on the
femoral and tibial surfaces [3]. The ability of the meniscus to
heal intrinsically is limited to the vascular regions of the tissue.
Thus, tissue engineering is a promising treatment modality to
replace avascular sections of the meniscus [2].
The term fibrochondrocyte or fibrocartilage cell has often been
used to describe the cells of the meniscus [4-7]. However,
recent characterization studies have led to the identification of
different cell populations within the tissue [2,8]. McDevitt and
colleagues [8] divided the meniscal cell population into three
distinct groups: fibrochondrocytes, fibroblast-like cells, and
cells of the superficial zone. Fibrochondrocytes, as defined by
the authors, are cells that are localized in the middle and inner
meniscus and express both collagen I and collagen II. They
can be identified by their round or oval shape and by the pres-
ence of a pericellular matrix. The extracellular matrix (ECM) in
this region consists mainly of collagens I and II, in a 2:3 ratio,
which are responsible for providing structural and tensile prop-
erties to the tissue [9,10]. Fibroblast-like cells are found mainly
in the outer one-third of the tissue and lack a pericellular matrix.
The ECM in this region is predominantly collagen I [2,11].
Cells of the superficial zone are located below the surface of
ANOVA = analysis of variance; COMP = cartilage oligomeric matrix protein; DEPC = diethyl pyrocarbonate; ECM = extracellular matrix; FBS = fetal
bovine serum; GAPDH = glyceraldehyde-3-phosphate dehydrogenase; IGF-I = insulin-like growth factor-I; PBS = phosphate-buffered saline; PSF =
penicillin–streptomycin–Fungizone; RT-PCR = reverse transcriptase polymerase chain reaction; TMJ = temporomandibular joint.
Arthritis Research & Therapy Vol 9 No 5 Gunja and Athanasiou
Page 2 of 12
(page number not for citation purposes)
the tissue and can be identified by their fusiform shape and
lack cytoplasmic projections. In this experiment, we use cells
from the inner two-thirds of the meniscus; thus, most of the
cells present are fibrochondrocytes. In addition to the
presence of collagen I and II in the inner two-thirds of the
meniscus, several other proteoglycans and glycoproteins can
also be found. The major meniscal proteoglycan is aggrecan
and its main function is to provide compressive properties of
the meniscus, especially to the inner one-third, which is pre-
dominantly under compressive load [12]. Cartilage oligomeric
matrix protein (COMP), a pentameric glycoprotein that influ-
ences collagen fibril formation, can also be identified in the
inner two-thirds of the meniscus [13]. Also present, in smaller
quantities, are small leucine-rich proteoglycans, biglycan and
decorin, that interact with growth factors as well as influence
fibrillogenesis [7].
Current cellular approaches for meniscus tissue engineering
usually involve autologous meniscus cells [14,15]. However,
there are too few primary cells in any one animal to be seeded
on a scaffold. To overcome this, an approach often employed
is to expand autologous cells in monolayer until the cell
number is sufficient for the study. A caveat with this technique
is that primary cells may dedifferentiate in vitro in monolayer
culture. This has been shown consistently with articular carti-
lage [16,17]. Gene expression studies with primary chondro-
cytes show that they express predominantly collagen II.
However, after one passage, the collagen II expression
decreases and the cells begin to express collagen I, which is
indicative of a fibroblastic phenotype [18,19]. In an effort to
reverse lost gene expression in articular cartilage and tempo-
romandibular joint (TMJ) disc fibrochondrocytes, several
growth factors, surface protein coatings and three-dimen-
sional scaffolds have been investigated [18,20-22]. However,
corresponding passage and gene expression reversal studies
for the meniscus are absent. Hence, understanding the state
of expanded meniscal fibrochondrocytes before embarking on
long-term tissue engineering studies may be prudent.
The goal of this experiment was, thus, twofold. The first was to
determine the effects of passage on the gene expression of
important ECM molecules (collagen I, collagen II, aggrecan
and COMP) produced by meniscal fibrochondrocytes. The
hypothesis was that, much like articular chondrocytes, menis-
cal fibrochondrocytes would exhibit phenotypic changes in
monolayer culture. The second was to reverse any changes in
gene expression incurred during passage by plating passaged
meniscus cells on either an aggrecan or a collagen I protein
coating.
Materials and methods
Cell harvesting
Medial menisci were isolated from six 1-week-old calf knees
(Research 87 Inc., Boston, MA, USA)) by exposing the knee
joint under aseptic conditions using scalpel blades. The pro-
cedures used were in strict accordance with the National Insti-
tutes of Health Guidelines on the Care and Use of Laboratory
Animals. Ethics approval was obtained from Rice University
before commencement of the study.
Each meniscus was taken to a cell culture hood, washed with
autoclaved PBS and transferred to a solution containing 2%
penicillin–streptomycin–Fungizone (PSF; Cambrex, Walkers-
ville, MD, USA) and culture medium. The culture medium con-
tained 50:50 Dulbecco's modified Eagle's medium and F12
(Gibco, Carlsbad, CA, USA), 10% fetal bovine serum (FBS;
Mediatech, Carlsbad, CA, USA), 1% non-essential amino
acids (NEAA; Gibco, Carlsbad, CA, USA), 25 μg of
L-ascorbic
acid (Sigma, St Louis, Missouri,) and 1% PSF. The outer one-
third of each meniscus was removed and the remainder was
minced into small fragments (less than 1 mm
3
). Each minced
meniscus was then placed in 30 ml of 2 mg/ml collagenase
type II (Worthington Biochemical, Lakewood, NJ, USA) and
transferred to an orbital shaker to be digested overnight at
37°C. After digestion, an equal volume of PBS was added to
the mixture and centrifuged at 200 g. The bulk of the superna-
tant was removed, more PBS was added and the mixture was
centrifuged again. This process was repeated until all the col-
lagenase had been removed from the mixture, leaving behind
a white pellet of meniscal cells. Cell counts from each menis-
cus were obtained with a hemocytometer. Cell viability was
assessed with the use of a Trypan blue exclusion test and was
found to be greater than 95%.
Cell culture, passage and expansion
From each meniscus, 1.3 × 10
6
cells were obtained, of which
0.2 × 10
6
were placed in 1 ml of TRIzol reagent (Invitrogen,
Grand Island, NY, USA), 0.5 × 10
6
were plated on T-75 flasks
at about 25% confluence, and the remaining 0.6 × 10
6
were
divided into three equal groups and placed in a 24-well non-
tissue-culture plastic plate coated with collagen 1 (Sigma, St
Louis, Missouri, USA), aggrecan (Sigma, St Louis, Missouri,
USA) or a non-protein control for 24 hours. Collagen I was dis-
solved in 0.1 M acetic acid and then diluted in water to a final
concentration of 10 μg/cm
2
per 24-well plate. Aggrecan was
soluble in water and was reconstituted to the same concentra-
tion. After plating, the 24-well plates were kept open in the cell
culture hood and allowed to dry overnight. The cells were left
to settle on the coatings for 1 day, and were then scraped off
the bottom with a cell scraper and placed in 1 ml of TRIzol rea-
gent. The cells in the T-75 flask were allowed to expand until
100% confluence and then passaged with trypsin/EDTA
(Gibco, Carlsbad, CA, USA). The cells were counted with a
hemocytometer and labeled as passage 1 (P1) cells. From this
cell population, 0.2 × 10
6
cells were placed in 1 ml of TRIzol
reagent, 0.5 × 10
6
were plated on T-75 flasks, and 0.6 × 10
6
were divided into three equal groups and placed in a 24-well
non-tissue-culture plastic plate. This process was repeated
until the fourth passage. The experimental design is shown in
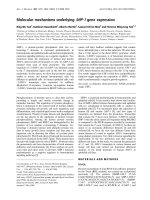
Figure 1.
Available online />Page 3 of 12
(page number not for citation purposes)
Figure 1
The overall experimental designThe overall experimental design. In brief, bovine meniscus cells were expanded through four passages in monolayer culture; 0.5 × 10
6
cells were
expanded in a T-75 flask to confluence. At each passage time point, 0.2 × 10
6
cells were collected for RT-PCR, and 0.2 × 10
6
cells were plated on
an aggrecan or collagen I two-dimensional surface coating or on a no coating control for 24 hours and then subsequently processed for RT-PCR.
The gene expression profiles with passage and on the different protein coatings were then determined. n = 6 was used for all gene expression abun-
dance evaluations.
M1
M6
M5
M4
M3
M2
24 well plate
200,000 cells/well
24 well plate
200,000 cells/well
1.3 million cells
500,000 cells
25 % confluence
RT-PCR
200,000 cells
100 % confluence
2 million cells
500,000 cells
25 % confluence
RT-PCR
200,000 cells
RT-PCR
200,000 cells
RT-PCR
200,000 cells
PASSAGE 0
PASSAGE 1
PASSAGE 2
PASSAGE 3
PASSAGE 4
T-75 flask
T-75 flask
M2 M3 M4 M5 M6
Meniscus 1 (M1)
Collagen I
M1
M6
M5
M4
M3
M2
Control
Control
Aggrecan
Aggrecan
Collagen I
Arthritis Research & Therapy Vol 9 No 5 Gunja and Athanasiou
Page 4 of 12
(page number not for citation purposes)
RNA isolation
Gene expression abundance of these cells was measured by
means of quantitative real-time reverse transcriptase polymer-
ase chain reaction (RT-PCR). In the first step, RNA was
isolated from each sample that had previously been placed in
TRIzol. Chloroform was added to each sample. The samples
were then centrifuged at 12,000 r.p.m. for 15 minutes. Pro-
pan-2-ol was added to the supernatant and the sample was
centrifuged again. The RNA precipitate was washed with 75%
ethanol and then dissolved in diethyl pyrocarbonate (DEPC)-
treated water. The concentration and purity of RNA was deter-
mined with a spectrophotometer (NanoDrop, Wilmington, DE,
USA).
Reverse transcriptase
After RNA isolation, the samples were normalized to 200 ng of
RNA per sample, suspended in DEPC-treated water. Before
reverse transcription, the RNA was treated with DNase to elim-
inate any DNA contamination in our samples. The RNA was
then reverse transcribed to cDNA with a Stratascript™ First
Strand Synthesis System (Stratagene, La Holla, CA, USA) in
accordance with the manufacturer's protocol. In brief, random
hexamers were added to each sample and the mixture was
incubated at 65°C for 5 minutes, then cooled to 22°C for 10
minutes. Finally, to each sample 10× First strand buffer,
RNase block, dNTPs and Stratascript enzyme were added.
The samples were incubated at different temperatures starting
at 25°C for 10 minutes, followed by 42°C for 60 minutes and
finally 70°C for 15 minutes to terminate the reaction.
Polymerase chain reaction
The cDNA obtained from the previous step was then amplified
with a Rotor-gene 3000 real-time PCR machine (Corbett
Research, Sydney, Australia). In brief, DEPC-treated water,
10× PCR buffer, MgCl
2
, dNTP, HotStar Taq and gene-spe-
cific primers and probes were added to the cDNA sample. The
samples were heated to 95°C for 50 cycles, at 15 s per cycle,
to denature and separate the strands of cDNA. The mix was
then cooled to 60°C to allow the forward and reverse primers
to anneal to the DNA strand and the HotStar Taq to elongate
both primers in the direction of the target sequence.
Fluorescence measurements on the FAM, Cy5 and ROX
channels were taken every cycle at 60°C to provide a quanti-
tative, real-time analysis of the PCR reaction for specific
genes. The genes of interest included collagen I, collagen II,
aggrecan, COMP and glyceraldehyde-3-phosphate dehydro-
genase (GAPDH). The forward and reverse primers and probe
sequences for these genes are shown in Table 1. The primers
and probes were optimized into triplexes such that (collagen I,
COMP and GAPDH), and (collagen II, aggrecan and GAPDH)
could be detected simultaneously.
Gene expression efficiency and abundance
The efficiency of the PCR reactions was determined by taking
dilutions of standard samples run in duplicate (1:1, 1:10,
1:100 and 1:1,000). The take-off cycle (C
t
) of the standard's
slope was plotted against the logarithmic standards to deter-
mine the slope (S). The efficiency (E) was then determined
with the following formula [23]:
E = 10
-1/S
The abundance (A) of the gene was calculated by using the
determined efficiency for the reaction, as well as the take-off
cycle for the particular sample [24]:
A = (1 + E)
-Ct
Statistical analysis
Statistical analysis was performed with JMP IN™ software. A
one-way analysis of variance (ANOVA) was run with five treat-
ment groups (P0, P1, P2, P3 and P4), with passage number
as a factor. To compare the effects of coating, a two-way
ANOVA was run with coating and passage treated as factors.
Coating had four treatment groups (collagen I coating, aggre-
can coating, no coating control and no coating passage),
whereas passage had five treatment groups (P0 to P4). If sig-
Table 1
Primer and probe sequences of desired genes
Target gene
(GenBank accession number,
product size)
Forward primer (5'→3') Reverse primer (5'→3') Probe (5'→3')
Collagen-I (NM-174520, 97 bp) CATTAGGGGTCACAATGGTC TGGAGTTCCATTTTCACCAG ATGGATTTGAAGGGACAGCCTTGG
Collagen-II
a
(X02420, 76 bp) AACGGTGGCTTCCACTTC GCAGGAAGGTCATCTGGA ATGACAACCTGGCTCCCAACACC
Aggrecan (U76615
, 76 bp) GCTACCCTGACCCTTCATC AAGCTTTCTGGGATGTCCAC TGACGCCATCTGCTACACAGGTGA
COMP (X74326
, 72 bp) TCAGAAGAGCAACGCAGAC TCTTGGTCGCTGTCACAA CAGAGGGATGTGGACCACGACTTC
GAPDH (U85042
, 86 bp) ACCCTCAAGATTGTCAGCAA ACGATGCCAAAGTGGTCA CCTCCTGCACCACCAACTGCTT
bp, base pairs; COMP, cartilage oligomeric matrix protein; GAPDH; glyceraldehyde-3-phosphate dehydrogenase.
a
Collagen II primers detect
both A and B isoforms.
Available online />Page 5 of 12
(page number not for citation purposes)
nificance was observed with the ANOVAs, a post-hoc Tukey's
Honestly Significant Difference test was run to pinpoint any
specific differences among groups. The significant groups
were further analyzed by crossing coating and passage factors
to test for any specific differences observed between pas-
sages of different coating groups. P < 0.05 was considered
significant for all statistical tests. All results are shown as mean
± SD.
Results
GAPDH as a verification gene
For clarity, the convention shown in Table 2 will be used here-
after. GAPDH expression was observed in more than 98% of
the samples that were tested and was, thus, used as a verifi-
cation gene. Samples with undetectable levels of GAPDH
were not processed and were considered to be part of a failed
reaction. No significant difference was observed in GAPDH
expression between groups over passage.
Gene expression with passage
The gene expression abundances for primary and passaged
fibrochondrocytes are reported normalized to the amount of
RNA per sample and are plotted for the genes of interest.
These baseline passage values are shown in the upper left
panels of Figures 2 (collagen I), 3 (collagen II), 4 (COMP) and
5 (aggrecan). Over four passages, a sharp 5,800-fold increase
in gene expression was observed in collagen I levels (from (1.1
± 1.2) × 10
-9
at P0 to (6.4 ± 2.5) × 10
-6
at P4), whereas a 70-
fold decrease was observed with collagen II expression (from
(1.2 ± 0.28) × 10
-8
at P0 to (1.8 ± 1.6) × 10
-10
at P4). COMP
levels decreased sevenfold after the first passage (from (6.2 ±
4.6) × 10
-10
at P0 to (1.2 ± 1.2) × 10
-10
at P1) and then stayed
relatively constant over the next three passages. Aggrecan
abundance with passage did not seem to follow any particular
trend. A fivefold decrease in gene expression was observed
after the first passage (from (1.22 ± 0.417) × 10
-6
at P0 to
(2.32 ± 1.20) × 10
-7
at P1). Gene expression was then upreg-
ulated in the second passage by about 25-fold (from (2.3 ±
1.20) × 10
-7
at P1 to (5.93 ± 2.45) × 10
-6
at P2) and then
dipped again over the next few passages by about 1.5-fold
(from (5.93 ± 2.45) × 10
-6
at P2 to (4.76 ± 2.17) × 10
-6
at P4).
Reversal attempts with protein coatings
Collagen I and aggrecan coatings were used to determine
whether any changes in gene expression occurring as a result
of monolayer passage could be reversed. The upper right and
lower left panels of Figures 2 to 5 represent the reversal
behavior of these protein coatings.
Collagen I
Cells placed on collagen I and aggrecan coatings showed sig-
nificantly different gene expression profiles for collagen I over
passage compared with the baseline passage and the no
coating groups. Both protein coatings were found to decrease
collagen I expression in the cells from the second to the fourth
passage by 50% or more. In addition, the gene expression in
the coating groups for all passages was within 20% of the P0
baseline abundance values.
Collagen II
Contrary to expectations, the decrease in collagen II expres-
sion observed over four passages was not reversed by either
the collagen I or the aggrecan protein coating. In fact, both
protein coatings induced a further downregulation of collagen
II expression by about 50% or more at most passage time
points. Interestingly, even the no coating control group
showed a decrease in collagen II expression, as was observed
with the protein coatings.
Cartilage oligomeric matrix protein
Significant differences were observed between the baseline
passage group and the two coating groups. COMP expres-
sion in cells plated on collagen I protein coating was
upregulated with each passage and had returned to baseline
P0 levels by the third passage. In contrast, the aggrecan coat-
ing group showed some signs of reversal with passage; how-
ever, the effect was not as pronounced as in the collagen I
coating group.
Aggrecan
None of the protein coating groups were found to have an
effect on the expression of aggrecan in the passaged cells.
Cells plated on the aggrecan protein coating tended to
Table 2
Terminology used to explain the different passage numbers as well surface coating groups
Passage Explanation Coating Explanation
P0 Primary cells Passage Cells from P0 to P4 on T-75 flasks
P1 Cells that have undergone one passage Collagen I coating Cells from P0 to P4 on collagen I coating
P2 Cells that have undergone two passages Aggrecan coating Cells from P0 to P4 on aggrecan coating
P3 Cells that have undergone three passages No coating Cells from P0 to P4 on a water control
P4 Cells that have undergone four passages
Arthritis Research & Therapy Vol 9 No 5 Gunja and Athanasiou
Page 6 of 12
(page number not for citation purposes)
decrease aggrecan expression at all passages by at most two-
fold when compared with baseline values; however, the
groups were not significantly different.
Discussion
Cartilage tissue engineering studies generally require large
numbers of cells that can be attained through expansion in
monolayer. However, several experiments with articular
chondrocytes and TMJ disc fibrochondrocytes have shown
that phenotypic changes are common when dealing with pas-
saged cartilaginous cells [17,18,25,26]. Further, gene expres-
sion reversal to baseline (P0) passage values after expansion
has been met with minimal success [18,21]. Because similar
studies have not been performed for meniscal
fibrochondrocytes, in this study the degree of dedifferentiation
and subsequent phenotype reversal via protein coatings were
investigated by observing gene expression changes with
passage. Significant differences in gene expression were
observed over four passages for collagen I, collagen II and
COMP, the first two being sensitive markers for the differenti-
ation state of primary meniscal fibrochondrocytes [27]. In our
gene expression reversal experiments, aggrecan and collagen
I protein coatings aided in reversing collagen I and COMP
expression to primary values; however, collagen II expression
could not be reversed.
The morphology and phenotype of cartilaginous cells may be
modulated by altering the culturing conditions. Meniscus cells
cultured on alginate beads for 3 to 4 weeks were found both
to resemble chondrocytes in morphology and to upregulate
Figure 2
Collagen I gene expression profiles of meniscal fibrochondrocytesCollagen I gene expression profiles of meniscal fibrochondrocytes. The x-axis refers to the passage number, and the y-axis to the gene expression
abundance (in the exponent notation used, 'E-n' stands for '× 10
-n
'). Small letters denote significant differences with passage, using a one-way anal-
ysis of variance (top left). Capital letters denote significant differences between levels (passage, collagen I coating, aggrecan coating and no coat-
ing), using a two-way analysis of variance. Stars denote groups that are not significantly different from values of the primary cells (that is, the P0 value
in the top left panel), using an interaction term between the two factors.
A
Passage
B
Collagen I coat
B
Aggrecan coat
A
No coat
a
b
c
b
a
0 E+00
3 E-06
5 E-06
8 E-06
1 E-05
01234
01234
01234
01234
0 E+00
3 E-06
5 E-06
8 E-06
1 E-05
0 E+00
3 E-06
5 E-06
8 E-06
1 E-05
0 E+00
3 E-06
5 E-06
8 E-06
1 E-05
A
0
1
2
3
4
C
B
A
A
Available online />Page 7 of 12
(page number not for citation purposes)
collagen II expression [27]. Similar results have been observed
with dedifferentiated chondrocytes placed in three-dimen-
sional hydrogels such as agarose or alginate [20,25]. In con-
trast, meniscus cells seeded for 1 day in monolayer seemed to
be either rounded like chondrocytes or spindle-shaped like
fibroblasts. However, after 1 week in monolayer, all cells
spread and proliferated, exhibiting a morphology characteristic
of fibroblasts [27]. It has been consistently shown in the liter-
ature that cartilaginous cells exhibiting a fibroblastic morphol-
ogy express high levels of collagen I, with a downregulation in
collagen II expression [18,26,28,29]. A similar result was
observed in this experiment: expression of collagen I increased
5,800-fold over four passages, whereas collagen II expression
decreased 70-fold. This observation may be attributed to ded-
ifferentiation of meniscus cells in monolayer, in an analogous
manner to dedifferentiation observed by Darling and
Athanasiou [18]. However, the presence of multiple cell pop-
ulations in the inner two-thirds of the meniscus that can prolif-
erate at different rates must also considered as a potential
contributor to the observed phenomenon. For instance, the
rapid upregulation in collagen I expression, as normalized to
total cells per sample, may be achieved by an increase in col-
lagen I expression per cell, or, for multiple cell populations, an
increase in the number of cells producing collagen I, or by a
combination of these [7,26,27]. Similarly, the observed down-
regulation of collagen II may be a direct consequence of a
Figure 3
Collagen II gene expression profiles of meniscal fibrochondrocytesCollagen II gene expression profiles of meniscal fibrochondrocytes. The x-axis refers to the passage number, and the y-axis to the gene expression
abundance (in the exponent notation used, 'E-n' stands for '× 10
-n
'). Small letters denote significant differences with passage, using a one-way anal-
ysis of variance (top left). Capital letters denote significant differences between levels (passage, collagen I coating, aggrecan coating and no coat-
ing), using a two-way analysis of variance.
A
Passage
B
Collagen I coat
B
Aggrecan coat
C
No coat
a
c
c
b
bc
01234
01234
01234
0 E+00
5 E-09
1 E-08
2 E-08
01234
0 E+00
5 E-09
1 E-08
2 E-08
0 E+00
5 E-09
1 E-08
2 E-08
0 E+00
5 E-09
1 E-08
2 E-08
A
0
1
2
3
4
B
B
B
B
Arthritis Research & Therapy Vol 9 No 5 Gunja and Athanasiou
Page 8 of 12
(page number not for citation purposes)
decrease in the ratio of chondrocyte-like cells to fibroblast-like
cells. Unfortunately, it is difficult to ascertain whether the pas-
saged meniscus cells are composed of two cell populations or
just one cell population expressing mainly fibroblastic genes.
In future experiments examining gene expression it will be
imperative to identify whether cell populations can be clearly
distinguished before passage and, if so, to isolate the different
cell types and analyze their proliferative, morphological and
phenotypic properties separately to gain a better understand-
ing of their individual contributions to the observed results.
Gene expression profiles of COMP, a pentameric glycoprotein
found preferentially in the pericellular and territorial matrices of
meniscus cells, were found to decrease significantly with pas-
sage [13,30]. Disruptions or mutations in the COMP structure
have been linked with skeletal development disorders such as
pseudoachondroplasia and multiple epiphyseal dysplasia,
underlining the importance of COMP in the tissue [31,32]. A
recent study with chondrocytes has shown that collagen II
downregulation (the most common chondrocytic dedifferenti-
ation marker) during monolayer passage is accompanied by a
Figure 4
Cartilage oligomeric matrix protein gene expression profiles of meniscal fibrochondrocytesCartilage oligomeric matrix protein gene expression profiles of meniscal fibrochondrocytes. The x-axis refers to the passage number, and the y-axis to
the gene expression abundance (in the exponent notation used, 'E-n' stands for '× 10
-n
'). Small letters denote significant differences with passage,
using a one-way analysis of variance (top left). Capital letters denote significant differences between levels (passage, collagen I coating, aggrecan
coating and no coating), using a two-way analysis of variance. Stars denote groups that are not significantly different from values of the primary cells
(that is, the P0 value in the top left panel), using an interaction term between the two factors.
A
Passage
B
Collagen I coat
C
Aggrecan coat
A
No coat
a
b
b
b
b
01234
01234
01234
01234
0.E+00
6 E-10
1 E-09
2 E-09
0.E+00
6 E-10
1 E-09
2 E-09
0.E+00
6 E-10
1 E-09
2 E-09
A
0
1
2
3
4
AB
AB
B
B
0.E+00
6 E-10
1 E-09
2 E-09
Available online />Page 9 of 12
(page number not for citation purposes)
quicker downregulation of COMP [17]. Similar results were
obtained in the present experiment, in which COMP expres-
sion decreased sevenfold after the first passage, although this
was slower than the decrease in collagen II expression (15-
fold after first passage). These results are in agreement with
previous studies that have determined the function of COMP
to be that of maintaining the integrity and properties of the col-
lagen II network by bridging collagen II and collagen IX fibrils
[17,33].
In addition to culturing conditions, the effect of aging on
meniscus cells is a relevant topic of interest. Behavioral differ-
ences between immature and adult animals exist at the level of
primary cells, and passaged adult cells may dedifferentiate to
a different phenotype when compared with the cells examined
in this study. Combining the results of this study with previous
literature, such differences are expected to be small and the
same trends are expected to hold. For instance, a protein
expression study using skeletally mature and immature rabbit
fibrochondrocytes expanded in primary and secondary monol-
ayer culture showed no significant differences in sulfated
proteoglycans and cell number [34]. With regard to the
increased collagen I expression and decreased collagen II
expression seen in that study as a result of passage, a more
recent gene expression study by Hellio Le Graverand and col-
leagues showed that, in comparison with cells from immature
tissue, adult primary cells expressed higher levels of collagen
I and lower levels of collagen II [35]. This observation, taken
together with past literature on the dedifferentiation of
chondrocytes and the results of this study, indicates that adult
cells are unlikely to be able to reverse this trend (that is, to
begin to express more collagen II and less collagen I) [18]. The
Figure 5
Aggrecan gene expression profiles of meniscal fibrochondrocytesAggrecan gene expression profiles of meniscal fibrochondrocytes. The x-axis refers to the passage number, and the y-axis to the gene expression
abundance (in the exponent notation used, 'E-n' stands for '× 10
-n
'). Small letters denote significant differences with passage, using a one-way anal-
ysis of variance (top left). Capital letters denote significant differences between levels (passage, collagen I coating, aggrecan coating and no coat-
ing), using a two-way analysis of variance. Stars denote groups that are not significantly different from values of the primary cells (that is, the P0 value
in the top left panel), using an interaction term between the two factors.
Passage
Collagen I coat
Aggrecan coat
No coat
c
c
a
b
ab
0 E-00
3 E-06
6 E-06
9 E-06
01234
01234
01234
01234
0 E-00
3 E-06
6 E-06
9 E-06
0 E-00
3 E-06
6 E-06
9 E-06
0 E-00
3 E-06
6 E-06
9 E-06
AA
AB
0
1
2
3
4
BC
BC
C
A
Arthritis Research & Therapy Vol 9 No 5 Gunja and Athanasiou
Page 10 of 12
(page number not for citation purposes)
practical result of this study is therefore that, as with cells from
immature tissue, with adult cells the already scarce collagen II
expression is likely to be even lower with passage.
The rapid changes in gene expression of meniscus cells over
passage are a matter of concern as this has important implica-
tions for future tissue engineering studies involving passaged
meniscus cells. Several techniques have been used in the past
to promote gene expression reversal of passaged chondro-
cytes and TMJ disc fibrochondrocytes back to primary cell val-
ues. These techniques have included the use of growth
factors, three-dimensional hydrogels and protein coatings
[18,20,22,25]. For meniscus cells, experiments have focused
mainly on preventing dedifferentiation and stabilizing pheno-
type. For example, human meniscus cells cultured in alginate
beads have been shown to obtain a round chondrocytic shape
as well as to maintain the expression of collagen II over 3 to 4
weeks [27]. However, for most tissue engineering studies the
cell population needs to be expanded. Culturing cells in three-
dimensional environments, such as alginate, has been shown
to promote protein synthesis while suppressing cell prolifera-
tion [18,29]. Unless an alternative medium that promotes both
cell proliferation and phenotype retention is identified, gene
expression reversal to primary cell values of expanded menis-
cus cells in a monolayer remains the most viable option.
We hypothesized that exposing passaged meniscus cells for
24 hours to collagen I or aggrecan, proteins abundantly
present in the meniscus, would mimic the environment in vivo
and be conducive to reversing lost phenotype. It is known that
cells plated in monolayer interact with proteins present in FBS
that are adsorbed on the cell culture flask [36,37]. This results
in stimuli not generally encountered in vivo, prompting
changes in cell morphology and surface marker expression
[38]. An interesting result of the reversal study was that aggre-
can coating decreased the expression of collagen I back to P0
baseline passage values. Previous studies in our laboratory
have shown that dermal fibroblasts treated with insulin-like
growth factor-I (IGF-I) and plated on an aggrecan surface
coating adopted a chondrocytic phenotype and morphology,
thus initiating the expression of collagen II with a downregula-
tion of collagen I [39]. Passaged meniscus cells contain a high
population of fibroblast-like cells; the observed decrease in
collagen I expression was therefore not surprising [27]. How-
ever, the absence of IGF-I from the culture medium may have
contributed to the lack of reversal of collagen II expression. It
is plausible that IGF-I or other growth factors are essential for
the expression of collagen II on fibroblast-like cells placed on
an aggrecan protein coating [39]. However, the results of this
study could also be a consequence of insufficient exposure
time (namely 24 hours) to the aggrecan protein coating.
Collagen I protein coating was found to downregulate colla-
gen I expression and upregulate COMP expression. The
downregulation of collagen I expression may be attributed to a
collagen I saturation effect experienced by the cells through
integrins on the cell surface. It is known that cell-surface
integrins can attach to region 1 (for example the I-domain of
integrin α 2) of collagen I surfaces with a similar homology to
the von Willebrand factor [40]. In addition, integrins also aid in
the transmission of intracellular signals that can regulate cell
growth, differentiation and motility [41]. It is therefore likely that
similar integrins on passaged meniscus cells can sense the
presence of excess collagen I in the vicinity and relay mes-
sages to the nucleus to downregulate collagen I expression.
Proliferative rates of cells may affect gene expression as well,
as is commonly observed in growth-plate chondrocytes [42].
It is has been shown that fibroblastic cells on three-dimen-
sional collagen I matrices have lower proliferative rates than
chondrocytic cells on the same surface, although the opposite
is true in monolayer culture [43,44]. Because passaged
meniscal cells exhibit mainly fibroblastic properties, the down-
regulation of collagen I may perhaps be attributed to the
slower proliferation rate of these fibroblast-like cells. The
upregulation of COMP gene expression back to primary fibro-
chondrocyte levels by the third passage was another exciting
finding. COMP is an important marker for the dedifferentiation
state of articular chondrocytes; its upregulation may therefore
signal a resurgence of the chondrocytic population in the
meniscus [17].
In this experiment, GADPH expression stayed relatively con-
stant with passage and may be used to represent a house-
keeping gene for future meniscus tissue engineering studies.
GAPDH has often been employed as a useful housekeeping
gene in RT-PCR studies not involving other standardization
techniques. It is commonly believed that within the same tissue
sample, GADPH mRNA expression levels are relatively con-
stant, whereas they can vary considerably between tissue
types [45]. Recent studies with fibrochondrocytes from the
TMJ disc suggest that even though GADPH may be constant
in different regions of the disc, there is a definite change in
abundance with passage, a phenomenon not observed in pas-
saged meniscal fibrochondrocytes [26].
Conclusion
These data indicate that the cells of the inner two-thirds of the
meniscus undergo significant changes during monolayer
expansion and passage. They experience losses in major
chondrocytic markers (collagen II and COMP) while
experiencing gains in fibroblastic markers (collagen I).
Reversal efforts to regain lost phenotype in passaged menis-
cus cells via protein coatings were successful for collagen I
and COMP by means of collagen I and aggrecan coatings.
However, reversal of collagen II gene expression proved to be
unsuccessful. A lack of collagen II could result in structural
breakdown of the tissue as well as preempt osteoarthritis
[11,46,47]. It will therefore be important to investigate alterna-
tive vehicles for reversing losses in collagen II expression in
passaged meniscus cells. These could include studying alter-
Available online />Page 11 of 12
(page number not for citation purposes)
native protein coatings such as collagen II and decorin, adding
growth factors such as transforming growth factor-β I (TGF-β
I), fibroblast growth factor-II (FGF-II) and IGF-I to the culture
medium, or culturing the cells in novel two-dimensional or
three-dimensional environments that support proliferation
while maintaining morphology [18,22,25,48-52].
Competing interests
The authors declare that they have no competing interests.
Authors' contributions
NJG and KAA conceived and designed the study. NJG per-
formed all experiments, post-experimental assays, and statisti-
cal analyses described in the study, in addition to drafting the
initial version of the manuscript. KAA supervised the study and
oversaw the drafting of the manuscript. Both authors read and
approved the final manuscript.
Acknowledgements
The authors thank Dr Jerry Hu for aiding with the revision of the manu-
script. The authors also acknowledge NIAMS RO1 AR 47839-2 for
funding this work.
References
1. Adams ME, Huckins DWL: The extracellular matrix of the
meniscus. In Knee Meniscus: Basic and Clinical Foundations
Edited by: Mow VC, Arnoczky SP, Jackson DW. New York: Raven
Press; 1992:15-28.
2. Sweigart MA, Athanasiou KA: Toward tissue engineering of the
knee meniscus. Tissue Eng 2001, 7:111-129.
3. Krause WR, Pope MH, Johnson RJ, Wilder DG: Mechanical
changes in the knee after meniscectomy. J Bone Joint Surg Am
1976, 58:599-604.
4. Araujo VG, Figueiredo CA, Joazeiro PP, Mora OA, Toledo OM: In
vitro rapid organization of rabbit meniscus fibrochondrocytes
into chondro-like tissue structures. J Submicrosc Cytol Pathol
2002, 34:335-343.
5. Isoda K, Saito S: In vitro and in vivo fibrochondrocyte growth
behavior in fibrin gel: an immunohistochemical study in the
rabbit. Am J Knee Surg 1998, 11:209-216.
6. Sweigart MA, AufderHeide AC, Athanasiou KA: Fibrochondro-
cytes and their use in tissue engineering of the meniscus. In
Topics in Tissue Engineering 2003 Volume 1. Edited by: Aham-
makhi N, Ferretti P. University of Oulu, Finland; 2003:18.
7. Benjamin M, Ralphs JR: Biology of fibrocartilage cells. Int Rev
Cytol 2004, 233:1-45.
8. McDevitt CA, Mukherjee S, Kambic HE, Parker R: Emerging con-
cepts of the cell biology of the meniscus. Curr Opin Orthop
2002, 13:345-350.
9. Cheung HS: Distribution of type I, II, III and V in the pepsin sol-
ubilized collagens in bovine menisci. Connect Tissue Res
1987, 16:343-356.
10. Almarza AJ, Athanasiou KA: Design characteristics for the tissue
engineering of cartilaginous tissues. Ann Biomed Eng 2004,
32:2-17.
11. Kambic HE, McDevitt CA: Spatial organization of types I and II
collagen in the canine meniscus. J Orthop Res 2005,
23:142-149.
12. AufderHeide AC, Athanasiou KA: Mechanical stimulation toward
tissue engineering of the knee meniscus. Ann Biomed Eng
2004, 32:
1161-1174.
13. Muller G, Michel A, Altenburg E: COMP (cartilage oligomeric
matrix protein) is synthesized in ligament, tendon, meniscus,
and articular cartilage. Connect Tissue Res 1998, 39:233-244.
14. Martinek V, Ueblacker P, Braun K, Nitschke S, Mannhardt R,
Specht K, Gansbacher B, Imhoff AB: Second generation of
meniscus transplantation: in-vivo study with tissue engi-
neered meniscus replacement. Arch Orthop Trauma Surg
2006, 126:228-234.
15. Peretti GM, Gill TJ, Xu JW, Randolph MA, Morse KR, Zaleske DJ:
Cell-based therapy for meniscal repair: a large animal study.
Am J Sports Med 2004, 32:146-158.
16. Schnabel M, Marlovits S, Eckhoff G, Fichtel I, Gotzen L, Vecsei V,
Schlegel J: Dedifferentiation-associated changes in morphol-
ogy and gene expression in primary human articular chondro-
cytes in cell culture. Osteoarthritis Cartilage 2002, 10:62-70.
17. Zaucke F, Dinser R, Maurer P, Paulsson M: Cartilage oligomeric
matrix protein (COMP) and collagen IX are sensitive markers
for the differentiation state of articular primary chondrocytes.
Biochem J 2001, 358:17-24.
18. Darling EM, Athanasiou KA: Rapid phenotypic changes in pas-
saged articular chondrocyte subpopulations. J Orthop Res
2005, 23:425-432.
19. Benya PD, Shaffer JD: Dedifferentiated chondrocytes reex-
press the differentiated collagen phenotype when cultured in
agarose gels. Cell 1982, 30:215-224.
20. Lee DA, Reisler T, Bader DL: Expansion of chondrocytes for tis-
sue engineering in alginate beads enhances chondrocytic
phenotype compared to conventional monolayer techniques.
Acta Orthop Scand 2003, 74:6-15.
21. Allen KD, Athanasiou KA: Growth factor effects on passaged
TMJ disk cells in monolayer and pellet cultures. Orthod Cranio-
fac Res 2006, 9:143-152.
22. Allen KD, Erickson K, Athanasiou KA: The effects of protein
coated surfaces on passaged TMJ disc cells. Arch Oral Biol
2007 in press.
23. Wilkening S, Bader A: Quantitative real-time polymerase chain
reaction: methodical analysis and mathematical model. J Bio-
mol Tech 2004, 15:107-111.
24. Pfaffl MW: A new mathematical model for relative quantifica-
tion in real-time RT-PCR. Nucleic Acids Res
2001, 29:e45.
25. Murphy CL, Sambanis A: Effect of oxygen tension and alginate
encapsulation on restoration of the differentiated phenotype
of passaged chondrocytes. Tissue Eng 2001, 7:791-803.
26. Allen KD, Athanasiou KA: Effect of passage and topography on
gene expression of temporomandibular joint disc cells. Tissue
Eng 2007, 13:101-110.
27. Verdonk PC, Forsyth RG, Wang J, Almqvist KF, Verdonk R, Veys
EM, Verbruggen G: Characterisation of human knee meniscus
cell phenotype. Osteoarthritis Cartilage 2005, 13:548-560.
28. Wildey GM, McDevitt CA: Matrix protein mRNA levels in canine
meniscus cells in vitro. Arch Biochem Biophys 1998,
353:10-15.
29. Glowacki J, Trepman E, Folkman J: Cell shape and phenotypic
expression in chondrocytes. Proc Soc Exp Biol Med 1983,
172:93-98.
30. Hedbom E, Antonsson P, Hjerpe A, Aeschlimann D, Paulsson M,
Rosa-Pimentel E, Sommarin Y, Wendel M, Oldberg A, Heinegard
D: Cartilage matrix proteins. An acidic oligomeric protein
(COMP) detected only in cartilage. J Biol Chem 1992,
267:6132-6136.
31. Schmitz M, Becker A, Schmitz A, Weirich C, Paulsson M, Zaucke
F, Dinser R: Disruption of extracellular matrix structure may
cause pseudoachondroplasia phenotypes in the absence of
impaired cartilage oligomeric matrix protein secretion. J Biol
Chem 2006, 281:32587-32595.
32. Kennedy J, Jackson G, Ramsden S, Taylor J, Newman W, Wright
MJ, Donnai D, Elles R, Briggs MD: COMP mutation screening as
an aid for the clinical diagnosis and counselling of patients
with a suspected diagnosis of pseudoachondroplasia or mul-
tiple epiphyseal dysplasia. Eur J Hum Genet 2005,
13:547-555.
33. Tian H, Stogiannidis I: Up-regulation of cartilage oligomeric
matrix protein gene expression by insulin-like growth factor-I
revealed by real-time reverse transcription-polymerase chain
reaction. Acta Biochim Biophys Sin (Shanghai) 2006,
38:677-682.
34. Webber RJ, Zitaglio T, Hough AJ Jr: In vitro cell proliferation and
proteoglycan synthesis of rabbit meniscal fibrochondrocytes
as a function of age and sex. Arthritis Rheum 1986,
29:1010-1016.
35. Hellio Le Graverand MP, Reno C, Hart DA: Gene expression in
menisci from the knees of skeletally immature and mature
female rabbits. J Orthop Res 1999, 17:738-744.
Arthritis Research & Therapy Vol 9 No 5 Gunja and Athanasiou
Page 12 of 12
(page number not for citation purposes)
36. Steele JG, Dalton BA, Johnson G, Underwood PA: Polystyrene
chemistry affects vitronectin activity: an explanation for cell
attachment to tissue culture polystyrene but not to unmodified
polystyrene. J Biomed Mater Res 1993, 27:927-940.
37. Steinmeyer J, Ackermann B: The effect of continuously applied
cyclic mechanical loading on the fibronectin metabolism of
articular cartilage explants. Res Exp Med (Berl) 1999,
198:247-260.
38. Diaz-Romero J, Gaillard JP, Grogan SP, Nesic D, Trub T, Mainil-
Varlet P: Immunophenotypic analysis of human articular
chondrocytes: changes in surface markers associated with
cell expansion in monolayer culture. J Cell Physiol 2005,
202:731-742.
39. French MM, Rose S, Canseco J, Athanasiou KA: Chondrogenic
differentiation of adult dermal fibroblasts. Ann Biomed Eng
2004, 32:50-56.
40. Kamata T, Liddington RC, Takada Y: Interaction between colla-
gen and the α
2
I-domain of integrin α
2
β
1
. Critical role of con-
served residues in the metal ion-dependent adhesion site
(MIDAS) region. J Biol Chem 1999, 274:32108-32111.
41. Dedhar S: Integrins and signal transduction. Curr Opin
Hematol 1999, 6:37-43.
42. Alvarez J, Balbin M, Santos F, Fernandez M, Ferrando S, Lopez JM:
Different bone growth rates are associated with changes in
the expression pattern of types II and X collagens and
collagenase 3 in proximal growth plates of the rat tibia. J Bone
Miner Res 2000, 15:82-94.
43. Nishiyama T, Tsunenaga M, Nakayama Y, Adachi E, Hayashi T:
Growth rate of human fibroblasts is repressed by the culture
within reconstituted collagen matrix but not by the culture on
the matrix. Matrix 1989, 9:193-199.
44. Yashiki S, Umegaki R, Kino-Oka M, Taya M: Evaluation of attach-
ment and growth of anchorage-dependent cells on culture
surfaces with type I collagen coating. J Biosci Bioeng 2001,
92:385-388.
45. Barber RD, Harmer DW, Coleman RA, Clark BJ: GAPDH as a
housekeeping gene: analysis of GAPDH mRNA expression in
a panel of 72 human tissues. Physiol Genomics 2005,
21:389-395.
46. Wojtys EM, Chan DB: Meniscus structure and function. Instr
Course Lect 2005, 54:323-330.
47. Stoop R, van der Kraan PM, Buma P, Hollander AP, Billinghurst
RC, Poole AR, van den Berg WB: Type II collagen degradation
in spontaneous osteoarthritis in C57Bl/6 and BALB/c mice.
Arthritis Rheum 1999, 42:2381-2389.
48. Lee DA, Noguchi T, Knight MM, O'Donnell L, Bentley G, Bader DL:
Response of chondrocyte subpopulations cultured within
unloaded and loaded agarose. J Orthop Res 1998,
16:726-733.
49. Bobacz K, Gruber R, Soleiman A, Graninger WB, Luyten FP,
Erlacher L: Cartilage-derived morphogenetic protein-1 and -2
are endogenously expressed in healthy and osteoarthritic
human articular chondrocytes and stimulate matrix synthesis.
Osteoarthritis Cartilage 2002, 10:394-401.
50. de Haart M, Marijnissen WJ, van Osch GJ, Verhaar JA: Optimiza-
tion of chondrocyte expansion in culture. Effect of TGF β-2,
bFGF and L-ascorbic acid on bovine articular chondrocytes.
Acta Orthop Scand 1999, 70:55-61.
51. Adesida AB, Grady LM, Khan WS, Hardingham TE: The matrix-
forming phenotype of cultured human meniscus cells is
enhanced after culture with fibroblast growth factor 2 and is
further stimulated by hypoxia.
Arthritis Res Ther 2006, 8:R61.
52. Revell CM, Dietrich JA, Scott CC, Luttge A, Baggett LS, Athana-
siou KA: Characterization of fibroblast morphology on bioac-
tive surfaces using vertical scanning interferometry. Matrix
Biol 2006, 25:523-533.