Báo cáo y học: "Three-dimensional and thermal surface imaging produces reliable measures of joint shape and temperature: a potential tool for quantifying arthritis" pdf
Bạn đang xem bản rút gọn của tài liệu. Xem và tải ngay bản đầy đủ của tài liệu tại đây (1.57 MB, 9 trang )
Open Access
Available online />Page 1 of 9
(page number not for citation purposes)
Vol 10 No 1
Research article
Three-dimensional and thermal surface imaging produces reliable
measures of joint shape and temperature: a potential tool for
quantifying arthritis
Steven J Spalding
1
, C Kent Kwoh
2
, Robert Boudreau
2
, Joseph Enama
2
, Julie Lunich
1
,
Daniel Huber
3
, Louis Denes
3
and Raphael Hirsch
1
1
Division of Rheumatology, Children's Hospital of Pittsburgh, 3705 Fifth Avenue, University of Pittsburgh School of Medicine, Pittsburgh, PA 15213,
USA
2
Department of Medicine, University of Pittsburgh School of Medicine, 3550 Terrace Street, Pittsburgh, PA 15213, USA
3
Robotics Institute, Carnegie Mellon University, 5000 Forbes Avenue, Pittsburgh, PA 15213, USA
Corresponding author: Raphael Hirsch,
Received: 27 Mar 2007 Revisions requested: 8 Jun 2007 Revisions received: 20 Jun 2007 Accepted: 23 Jan 2008 Published: 23 Jan 2008
Arthritis Research & Therapy 2008, 10:R10 (doi:10.1186/ar2360)
This article is online at: />© 2008 Spalding et al.; licensee BioMed Central Ltd.
This is an open access article distributed under the terms of the Creative Commons Attribution License ( />),
which permits unrestricted use, distribution, and reproduction in any medium, provided the original work is properly cited.
Abstract
Introduction The assessment of joints with active arthritis is a
core component of widely used outcome measures. However,
substantial variability exists within and across examiners in
assessment of these active joint counts. Swelling and
temperature changes, two qualities estimated during active joint
counts, are amenable to quantification using noncontact digital
imaging technologies. We sought to explore the ability of three
dimensional (3D) and thermal imaging to reliably measure joint
shape and temperature.
Methods A Minolta 910 Vivid non-contact 3D laser scanner and
a Meditherm med2000 Pro Infrared camera were used to create
digital representations of wrist and metacarpalphalangeal (MCP)
joints. Specialized software generated 3 quantitative measures
for each joint region: 1) Volume; 2) Surface Distribution Index
(SDI), a marker of joint shape representing the standard deviation
of vertical distances from points on the skin surface to a fixed
reference plane; 3) Heat Distribution Index (HDI), representing
the standard error of temperatures. Seven wrists and 6 MCP
regions from 5 subjects with arthritis were used to develop and
validate 3D image acquisition and processing techniques. HDI
values from 18 wrist and 9 MCP regions were obtained from 17
patients with active arthritis and compared to data from 10 wrist
and MCP regions from 5 controls. Standard deviation (SD),
coefficient of variation (CV), and intraclass correlation coefficients
(ICC) were calculated for each quantitative measure to establish
their reliability. CVs for volume and SDI were <1.3% and ICCs
were greater than 0.99.
Results Thermal measures were less reliable than 3D measures.
However, significant differences were observed between control
and arthritis HDI values. Two case studies of arthritic joints
demonstrated quantifiable changes in swelling and temperature
corresponding with changes in symptoms and physical exam
findings.
Conclusion 3D and thermal imaging provide reliable measures of
joint volume, shape, and thermal patterns. Further refinement may
lead to the use of these technologies to improve the assessment
of disease activity in arthritis.
Introduction
Rheumatoid arthritis (RA) and juvenile idiopathic arthritis (JIA)
are chronic inflammatory conditions of the joints which can
result in substantial morbidity and loss of function. Over the
last decade, significant progress has been made in increasing
the number pharmacological options available to treat these
conditions. To determine the efficacy of these new drug ther-
apies, outcome measures, such as the American College of
Rheumatology (ACR) 20 in RA and the ACR 30 in JIA, have
been developed and accepted by international regulatory
agencies [1,2]. An essential component of these outcome
measures is the assessment of the number of joints with active
arthritis. Unfortunately, carefully designed studies have repeat-
edly shown poor reproducibility of physician-assessed swollen
3D = three-dimensional; ACR = American College of Rheumatology; CV = coefficient of variation; HDI = heat distribution index; ICC = intra-class
correlation coefficient; JIA = juvenile idiopathic arthritis; MCP = metacarpalphalangeal; MRI = magnetic resonance imaging; RA = rheumatoid arthritis;
RF = rheumatoid factor; ROC = receiver operating characteristic; ROI = region of interest; SD = standard deviation; SDI = surface distribution index.
Arthritis Research & Therapy Vol 10 No 1 Spalding et al.
Page 2 of 9
(page number not for citation purposes)
joint counts and active joint counts. Studies of intra- and inter-
observer variability regarding these measures have
demonstrated high coefficients of variation (CVs) and low
intra-class correlation coefficients (ICCs) [3-5]. An unbiased
and reliable measure of the inflammatory state of the joint
would improve the ability to quantify disease activity. Such a
measure could be used to assess response to therapy in both
the clinical and research settings.
A number of imaging technologies have been studied in an
effort to improve the assessment of arthritis activity. However,
all of the current technologies have limitations. For instance,
plain radiographs are insensitive to early changes. Ultrasound
can quantify changes in effusion and synovitis, but it is highly
user-dependent. Magnetic resonance imaging (MRI) has
proven to be more sensitive and reliable than clinical examina-
tion in the detection of synovitis and has the ability to quantify
changes in synovial volumes and erosions [3,6]. However, MRI
involves substantial time and cost, exposure to contrast
agents, and the need for sedation in young children. We con-
ducted a proof-of-concept study to determine whether two of
the cardinal signs of disease activity in arthritis (swelling and
warmth) can be reliably quantified using existing three-dimen-
sional (3D) and thermal digital imaging devices.
Materials and methods
Patients
Seven wrist and 6 metacarpalphalangeal (MCP) regions from
5 subjects with arthritis were used to develop and validate 3D
image acquisition and processing techniques. HDI values from
18 wrist and 9 MCP regions were obtained from 17 patients
with active arthritis and compared with data from 10 wrist and
MCP regions from 5 controls. The subjects included pediatric
patients recruited from a single pediatric rheumatology prac-
tice and adult patients recruited from an academic rheumatol-
ogy center. Diagnosis and classification of RA or JIA were
made based on accepted ACR criteria or International League
Against Rheumatism criteria [7,8]. Active arthritis was defined
as the presence of swelling and tenderness. The study proto-
col was approved by the University of Pittsburgh Institutional
Review Board. All patients signed informed consent forms
prior to inclusion in the study.
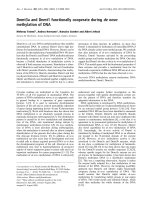
3D data acquisition and processing
The image acquisition and processing technique is outlined in
Figure 1. A forearm-based hand splint was designed to mini-
mize movement and standardize hand position and pose
between sessions (Figure 1a). Fixed objects, necessary to cre-
ate and align 3D models from different sessions, were
attached to the base of this splint. Scans were acquired using
a Minolta Vivid 910 (Konica Minolta Sensing Americas, Inc.,
Ramsey, NJ, USA), a laser line triangulation scanner that pro-
duces a 640 × 480-pixel 3D image. Its manufacturer-reported
resolution and accuracy are less than 0.2 mm in all axes. The
camera was operated via a laptop computer using Polygon
Editing Tool (version 1.22; Konica Minolta Sensing Americas,
Inc.). Scans were acquired under the following standard con-
ditions: camera positioned perpendicular to the subject's fore-
arm at a stand-off distance of 0.8 m, camera height of 0.8 m,
and camera declined to 45° from horizontal. Ambient room
lighting was used during image acquisition. Two scans of each
hand/wrist were acquired, one from the medial and the other
from the lateral side. Rapidform2006 software (INUS Technol-
ogy, Inc., Seoul, South Korea) was used to merge these two
scans into a single, complete 3D model (Figure 1b). To follow
patients longitudinally, it was essential to prevent minor wrist
or hand rotation from session to session which might cause
false variations in volume measurements. The fixation device
constructed for this study prevented most such rotation. Small
positioning changes that did occur were readily overcome by
aligning the forearm and hand of models created across ses-
sions, using the Rapidform co-registration function. Subse-
quent 3D models were constructed in the same fashion and
then aligned to the reference model using the fiduciary mark-
ers and stable anatomic landmarks.
After model creation, two distinct computer-generated regions
of interest (ROIs) were defined, one for the wrist and one for
the 2nd-5th MCPs (green boxes in Figure 1b). The 2nd-5th
MCP region was treated as a single ROI because the MCP
joints are in juxtaposition to each other, and, in the case in
which an MCP is swollen, it is impossible to determine where
one MCP region ends and the adjacent one begins. The
center of the wrist ROI was defined as the midpoint of the dis-
tance between the radial and ulnar styloids, whereas the
center of the 2nd-5th MCP ROI was defined as the midpoint
of the distance between the peaks of the 3rd and 4th MCP.
Through trial and error, we determined that wrist ROI box
dimensions of 9 cm in the medial-lateral plane, 4 cm in the
proximal-distal plane, and 4 cm in the vertical plane and MCP
ROI box dimensions of 10 cm in the medial-lateral plane, 2 cm
in the proximal-distal plane, and 2 cm in the vertical plane
encompassed maximal relevant data. These ROI boxes were
created at the initial imaging session and remained fixed for all
subsequent sessions. The wrist or MCP ROI was then
extracted by deleting all data outside of the ROI box (Figure
1c). Volumes within the ROIs were then calculated. In addi-
tion, all points on the joint surface could be represented as dis-
tances in millimeters from the bottom plane of the ROI box.
These distances could then be depicted as a color map (Fig-
ure 1d). We have established a surface distribution index
(SDI), defined as one standard deviation (SD) from the mean
of the all surface points-to-bottom plane distances. The SDI is
a reflection of the surface shape, and distortions due to swell-
ing will result in a change in SDI. The SDI data were generated
using the 'Shell-Surface deviation' function in the Rapidform
software.
Available online />Page 3 of 9
(page number not for citation purposes)
Thermal data acquisition and processing
Thermal data were acquired using a Meditherm medPro2000
thermoelectrically cooled microbolometer (Meditherm, Inc.,
Beaufort, NC, USA) and WinTES Thermal Evaluation Software
(Compix, Lake Oswego, OR, Queensland, Australia). Unlike
other commercially available thermal imagers, this sensor is
specifically designed to measure temperatures found in the
human body (10°C to 40°C). The device has a manufacturer-
reported sensitivity and accuracy of less than 0.1°C and self-
calibrates to an internal source at each pixel, avoiding the need
for an external calibration target. Following International Acad-
emy of Clinical Thermology guidelines [9], subjects were
asked to remove all jewelry and clothing covering the joints of
interest and were given a 15-minute acclimation period prior to
thermal imaging. All thermal images were obtained with the
camera positioned directly over the hands. Ambient room tem-
perature was 22°C ± 0.5°C. Skin emissivity was fixed at 0.98
[10,11]. Thermal data were processed using specially
designed code in Matlab (The MathWorks, Inc., Natick, MA,
USA). With this code, centers for standard ROI boxes were
selected (Figure 1e). The midpoint of the wrist or the midpoint
between the 3rd and 4th MCPs served as the center of the
thermal ROI boxes. A heat distribution index (HDI) was defined
as twice the SD of all temperatures within the ROI [8]. Relative
frequency distributions were generated by plotting the fre-
quency of temperatures in 1°C increments.
Statistical analysis
Wrist and MCP volume and shape vary across individuals.
Therefore, pooled SDs were used to represent the overall
measurement error SD when measuring volume and shape on
multiple individuals. Excel XP (Microsoft Corporation, Red-
mond, WA, USA) and SAS 9.1 (SAS Institute Inc., Cary, NC,
USA) were used for analysis. The average CV was used as a
measure of overall CV. The ICC [1,3] was used as a measure
of reliability [12]. When comparing HDIs, group means were
used to examine for significant differences using Student t
tests. P values of less than 0.05 were considered significant.
The area under the receiver operating characteristic (ROC)
curve was used to assess overall sensitivity and specificity of
thermal imaging [13].
Results
3D measures are highly reliable
We tested the reliability of the 3D measures of wrists and
MCPs in subjects with arthritis in a clinically relevant setting.
To compare inter-session reliability, 7 wrist and 6 MCP
regions from 5 subjects (3 JIA and 2 RA) were scanned twice
by an experienced camera operator. The subject left the room
between each of the imaging sessions. Wrist and MCP vol-
ume and SDI measures demonstrated excellent reliability
across imaging sessions (Table 1). In wrists, pooled inter-ses-
sion volume SD was 0.9 ml (CV, 1.3%) and SDI SD was 0.1
mm (CV, 1.1%). Inter-session pooled MCP volume SD was
0.1 ml (CV, 1.3%) and SDI SD was 0.1 mm (CV, 1.1%). ICCs
[1,3] for all 3D measures of wrists and MCPs were greater
than 0.99 (wrist volume ICC = 0.992, wrist SDI ICC = 0.996,
MCP volume ICC = 0.995, and MCP SDI ICC = 0.999).
Based on the inter-session data, volume changes greater than
1.1 ml in the wrist and 0.5 ml in the MCPs between imaging
sessions would be considered significant with 99% confi-
dence. Similarly, a change in the SDI of 0.4 mm in the wrist or
0.3 mm in the MCPs between imaging sessions would also be
significant with the same degree of confidence.
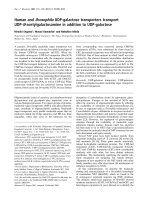
3D imaging can reliably quantify small changes in joint
volume and shape
We performed a set of experiments to determine the ability of
the 3D imager to detect surface changes due to joint swelling,
using clay on a mannequin hand to simulate different degrees
of swelling consistent with JIA or RA (Figure 2). A known vol-
ume of clay was applied to the wrist or MCP region either in a
Figure 1
Image acquisition and processingImage acquisition and processing. After immobilizing a subject's wrist and hand in a fixation splint (a), two scans are obtained from opposite view
points and the scans are merged to create a three-dimensional (3D) model (b). Using the model, the center of a predefined region of interest (ROI)
is selected and defined by the green box. Both wrist and metacarpalphalangeal (MCP) ROI boxes are shown. The ROIs can be isolated and the vol-
ume between the base of the ROI and the surface can be directly calculated using Rapidform software. The wrist is shown as an example (c). The
distance in millimeters from the base of the ROI to the surface can be depicted as a color map in which blue represents a greater, and red a lesser,
distance in millimeters from the base (d). In a similar manner, ROIs defining the wrist and MCP are selected from thermograms (e) and used to cal-
culate the heat distribution index.
Arthritis Research & Therapy Vol 10 No 1 Spalding et al.
Page 4 of 9
(page number not for citation purposes)
lump, to simulate focal swelling, or spread over a large area, to
simulate diffuse swelling (Figure 2a). The estimated changes
in volume and SDI were based on the average of three models
with the mannequin hand held in fixed position. Three-dimen-
sional imaging proved accurate and sensitive in identifying
small changes in both volume and SDI (Figure 2b,c). A signif-
icant increase from baseline volume was detectable with the
addition of as little as 0.2 ml of clay (0.8% above baseline vol-
ume) to the MCP ROI (p = 0.0001) and 0.6 ml (1.5% above
baseline volume) to the wrist ROI (p = 0.0002). A significant
increase in SDI from baseline due to simulated swelling was
also detected with the addition of as little as 1.3 ml of clay
(3.2% above baseline volume) to the wrist ROI (p = 0.001)
and 0.6 ml (2.5% above baseline volume) added to the MCP
ROI (p = 0.002). The SDI was able to discriminate between
focal and diffuse swelling when 1.6 ml of clay was added to
the wrist ROI (p = 0.02) and 0.6 ml to the MCP ROI (p =
0.0003).
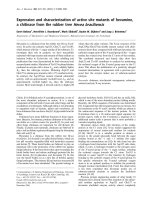
Thermal imaging differentiates patients with active
arthritis from normal controls
To determine the reliability of thermal imaging of the wrist and
MCP, 6 normal adult wrists and hands from 3 controls were
imaged on 3 separate days. Three thermal scans were
obtained at each session and the HDI was calculated for each
ROI. Intra-session (that is, same day and time) HDIs were very
similar, with SDs less than 0.05°C (data not shown). Pooled
inter-session (that is, day-to-day) SD of wrist HDIs was 0.2°C
(Figure 3a) whereas MCP HDI performed less well, with an
inter-session SD of 0.4°C (Figure 3b). Pooled inter-session
CVs were 22.1% for the wrist and 29.7% for the MCP, indi-
cating relatively large day-to-day variation. This was also
reflected in the low HDI ICC [1,3] values for wrists (0.146) and
MCPs (-0.295). However, no control wrist or MCP HDI
exceeded 1.3°C, suggesting that an HDI above 1.3°C might
be indicative of the presence of arthritis. To explore this further,
we compared HDI values of 10 control wrists and 10 control
MCPs to 18 wrists with active arthritis and 9 MCPs with active
arthritis. As shown in Figure 3c, an HDI cutoff of 1.3°C dis-
criminated well between controls and patients with active
arthritis. The mean ± SD HDI in control joints was 1.0°C ±
0.2°C compared with 1.7°C ± 0.6°C in joints with active arthri-
tis (p < 0.0001). By ROC analysis, an HDI value of 1.3°C
yielded a sensitivity of 67% and a specificity of 100%. The
area under the ROC curve was 0.823. No significant differ-
ences in HDI were seen between control adults and children
or between arthritic adults and children.
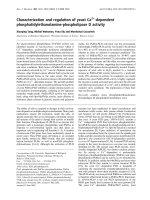
3D and thermal surface imaging can quantify clinically
meaningful changes in arthritic joints in response to
therapy
To demonstrate the potential utility of 3D and thermal surface
imaging to monitor arthritis, we have longitudinally imaged two
patients with wrist arthritis. The first patient was a 9-year-old
female with anti-nuclear antigen (ANA)-negative and rheuma-
toid factor (RF)-negative polyarticular JIA who presented with
left wrist pain, warmth, and swelling. The decision was made
to proceed with intra-articular steroid injection, and the patient
underwent imaging prior to the procedure (Figure 4). The
patient returned for re-imaging 5 days after the injection. A
reduction in volume of 2 ml, representing a 10% decrease,
was noted (Figure 4a). No significant change in SDI was
observed, although the area of decreased swelling was evi-
dent on the surface color map (Figure 4b). HDI values
changed from 1.9°C prior to the injection to 1.1°C after the
injection (Figure 4c), associated with narrowing of her temper-
ature frequency distribution (Figure 4d). These quantitative
findings correlated with both physician-assessed improve-
ment in swelling and tenderness and patient report of symp-
tom reduction.
The second patient was a 45-year-old Caucasian female with
long-standing RF-positive RA on a regimen of hydroxychloro-
quine and methotrexate. She underwent imaging after com-
Table 1
Reproducibility of wrist and metacarpalphalangeal three-dimensional measures across sessions
3D measure Wrist Metacarpophalangeal
1234567123456
Volume, ml
Mean, ml 55.8 47.8 38.5 39.2 55.0 53.3 66.8 16.7 4.3 8.9 4.0 9.5 7.3
SD, ml 0.7 0.6 0.2 0.2 0.6 2.1 0.5 0.2 0.02 0.1 0.1 0.1 0.1
CV (%) 1.3 1.2 0.6 0.4 1.0 4.0 0.8 1.3 0.4 1.5 1.3 0.9 2.0
SDI, mm
Mean, mm 10.3 9.3 7.3 7.5 9.0 9.8 10.8 6.7 4.2 5.1 4.5 5.4 4.9
SD, mm 0.2 0.1 0.1 0.03 0.2 0.1 0.02 0.1 0.04 0.1 0.03 0.05 0.04
CV (%) 2.1 1.0 1.2 0.4 1.8 0.7 0.2 1.9 1.0 1.0 0.7 0.9 0.8
3D, three-dimensional; CV, coefficient of variation; SD, standard deviation; SDI, surface distribution index.
Available online />Page 5 of 9
(page number not for citation purposes)
pleting a course of oral steroids for flare of her disease. At this
initial imaging session, her symptoms and physical exam find-
ings were minimal. Ten days later, she returned with com-
plaints of increased swelling, stiffness, pain, and warmth in the
right wrist. Her wrist was re-imaged. An increase in swelling,
particularly on the dorsolateral aspect of the wrist, was visually
apparent in the 3D models. Wrist volume increased between
sessions by 4 ml, representing an 8.7% increase from baseline
(Figure 5a). Wrist SDI increased between sessions by 1.4
mm, representing an 18.4% increase, along with an obvious
change in surface contour as reflected by the surface color
map (Figure 5b). The patient's wrist HDI increased from 1.5°C
to 2.5°C (Figure 5c). Relative frequency distribution went from
narrow to broad (Figure 5d). These quantitative findings corre-
lated with both physician assessment of disease activity and
patient report of worsening symptoms.
Discussion
The findings from this proof-of-concept study suggest that sur-
face imaging could be used to improve the assessment of dis-
ease activity in arthritis. Although the number of subjects we
analyzed was small and will require further validation, our
results demonstrate that this approach is feasible. The 3D
measures described in this study were accurate and sensitive
to small changes in joint volume and shape. HDI values of
greater than 1.3°C could be used to identify patients with
active arthritis. In 2 arthritis patients with changes in clinical
status, these surface imaging measures were able to quantify
changes that correlated with subjective physician assessment.
Currently used measures to monitor changes in arthritis activ-
ity, such as the ACR 20 and ACR 30, rely upon the number of
joints with active arthritis as a core criterion [1,2]. However,
multiple studies have documented the limited reproducibility of
rheumatologist-assessed active or swollen joint counts. The
inter-observer agreement of active joint count ranges from
0.69 to 0.76 [4,14]. Guzmán and colleagues [4] reported poor
inter-rater agreement in the assessment of active disease in
the wrist and MCPs. Similarly, in a study of patients with pso-
riatic arthritis, the inter-rater agreement regarding the number
Figure 2
Sensitivity of three-dimensional measures to change due to simulated swellingSensitivity of three-dimensional measures to change due to simulated swelling. Various amount of clay (depicted in yellow) were added to a manne-
quin wrist and 2nd-5th metacarpalphalangeal (MCP) regions to represent swelling (a). The clay volume was estimated by forming the clay into a
cube and measuring the length, width, and height with calipers. Different shapes of the same volume were used to simulate focal and diffuse swell-
ing. Volume changes (b) and surface distribution index (SDI) changes (c) due to addition of clay are shown, with vertical bars representing the mean
and standard deviation of three models. The dotted lines correspond to baseline volume and SDI. Large brackets encompass all values significantly
greater than baseline. Small brackets represent comparison of focal and diffuse swelling measurements. *p < 0.05;
†
p < 0.01;
‡
p < 0.001.
Arthritis Research & Therapy Vol 10 No 1 Spalding et al.
Page 6 of 9
(page number not for citation purposes)
of swollen joints was even lower (ICC 0.10) [14]. Slightly
higher agreement between observers in the assessment of
swollen joints has been observed in other studies, with ICCs
ranging from 0.7 to 0.82 [3,5,15]. ICCs reported in our study
for 3D volume and SDI measures of the wrist and MCP were
all greater than 0.99, a substantial improvement in reliability.
Thus, surface imaging could improve the reliability of the active
Figure 3
Reproducibility of inter-session human subject wrist (a) and metacar-palphalangeal (MCP) (b) heat distribution index (HDI) measurementsReproducibility of inter-session human subject wrist (a) and metacar-
palphalangeal (MCP) (b) heat distribution index (HDI) measurements.
Three thermal images of control human wrists and MCPs were cap-
tured once a day on 3 separate days. Each data point represents the
mean and standard error of the three images. (c) Comparison of wrist
and MCP HDI values in control patients and patients with active arthri-
tis. Solid horizontal lines represent the mean. Dotted line represents
proposed cutoff for active arthritis (1.3°C).
Figure 4
Changes in three-dimensional and thermal measurements after intra-articular steroid injectionChanges in three-dimensional and thermal measurements after intra-
articular steroid injection. A 9-year-old female with polyarticular juvenile
idiopathic arthritis underwent imaging before and 5 days after an intra-
articular steroid injection of the left wrist. (a) Pre- and post-injection
wrist region of interest and volume with dorsal (solid white arrow) and
lateral (dashed white arrow) swelling evident in the pre-injection image.
(b) Pre- and post-injection surface distance color map demonstrating
pre-injection swelling (solid arrows) that resolves post-injection
(dashed arrows). (c) Pre- and post-injection thermograms and heat dis-
tribution index (HDI). (d) Pre- and post-injection relative frequency dis-
tributions of temperatures. SDI, surface distribution index.
Available online />Page 7 of 9
(page number not for citation purposes)
or swollen joint counts, which would lead to an overall
improvement in the reliability of the ACR 20 and ACR 30.
We used a non-contact 3D laser scanning device used by
other investigators to obtain objective and quantifiable data of
the physical characteristics of body surfaces in non-arthritic
conditions [16-21]. Highton and colleagues [22,23] used
static laser technology to assist examiners in determining
changes in joint size and hand function resulting from arthritis.
This method required examiners to adjust the position of a
laser beam on a joint surface and then record its position as a
way to measure joint deformity. While this was a significant
step toward objectifying shape changes in arthritis, there was
still the potential for inter- and intra-user variability and only lim-
ited areas of the joints were examined. Our technology differed
in that we examined the entire dorsal surface of the joint and
data were acquired and recorded without user input, thus
reducing the chance for operator variability.
Infrared thermography has been studied since the 1960s to
measure active arthritis with variable results [24-37]. Multiple
indices have been developed to quantify the temperature
changes observed in arthritis [35,38]. The HDI measure used
in our study reduces the environmental effects on absolute
skin temperature [32]. Previous studies demonstrated that
HDI, calculated by limiting the data to values greater than 15%
of the modal frequency, correlated with the Ritchie articular
index, grip strength, morning stiffness, erythrocyte
sedimentation rate, and pain score [33]. In our study, the HDI
performed with greater sensitivity when the data were not lim-
ited by modal frequency. Using thermal imaging, we deter-
mined that an HDI of greater than 1.3°C correlated with
physician-assessed active arthritis (r = 0.68, p < 0.0001) and
displayed a specificity of 100% and a sensitivity of 67% when
compared with normal controls. The poorer performance of
the MCP HDI is likely a consequence of uncontrollable physi-
ologic factors (metabolic rate, caloric intake, and so on) within
each subject, suggesting that absolute changes in HDI may
not be a reliable longitudinal measure of change in arthritis
activity. However, the HDI could be employed in a dichoto-
mous fashion to classify joints as active or inactive, which
could simplify and improve the reproducibility of active joint
counts.
Other imaging modalities, such as MRI and ultrasound, have
been proposed as tools to improve reproducibility and quantify
changes in arthritic joints. Unlike 3D and thermal surface imag-
ing, which collect exterior joint data, these other modalities
examine structures below the joint surface. MRI has been used
to quantify synovial volumes in JIA and RA [3,39]. Using the
Rheumatoid Arthritis Magnetic Resonance Imaging Scores
(RAMRIS), researchers have been able to document intra- and
inter-rater correlation coefficients of greater than 0.89 in the
assessment of synovitis [40,41]. However, MRI-measured
synovial volumes require contrast administration and are time-
intensive, requiring acquisition times of more than 20 minutes
per extremity, and slightly less time to analyze the images [3].
In this study, using manual image acquisition and processing,
patient positioning and image acquisition were completed in
less than 5 minutes and image processing was completed in
less than 30 minutes. These steps are amenable to full auto-
mation, which should result in a much shorter interval between
imaging and availability of results.
Figure 5
Changes in three-dimensional and thermal measures during rheumatoid arthritis flareChanges in three-dimensional and thermal measures during rheumatoid
arthritis flare. A 45-year-old Caucasian female with well-controlled rheu-
matoid arthritis was imaged. Nine days later, she developed an acute
flare of her symptoms and was re-imaged on day 10. (a) Pre- and post-
flare wrist region of interest and volume. (b) Pre- and post-flare surface
distance color map demonstrating post-flare swelling (dashed arrow),
not present in pre-flare image (solid arrow). (c) Pre- and post-flare ther-
mograms and heat distribution index (HDI). (d) Pre- and post-flare rela-
tive frequency distributions of temperatures. SDI, surface distribution
index.
Arthritis Research & Therapy Vol 10 No 1 Spalding et al.
Page 8 of 9
(page number not for citation purposes)
Several previous studies have reported ultrasound's increased
sensitivity in the detection of synovitis when compared with
clinical assessment [40,42]. Naredo and colleagues [43]
compared ultrasound to physician assessment of joint activity.
Ultrasound exhibited greater reliability and sensitivity in the
detection of synovitis and effusion compared with clinical
examination. However, ultrasound is ultimately reliant on con-
sistent performance by the operator. The same study reported
moderate intra-observer agreement of ultrasound-measured
effusions in the wrist and MCPs (kappa statistic 0.59 and
0.83, respectively) and synovitis in the wrist and MCPs (kappa
statistic 0.62 and 0.76, respectively).
For this study, pediatric arthritis and adult arthritis were con-
sidered as a single group since the study was designed (a) to
determine the ability of the thermal and 3D cameras to provide
reproducible data from repeated imaging of the same wrist
and (b) to detect a difference between wrists with arthritis and
control wrists. Therefore, the adult and pediatric arthritis sub-
jects were considered as a single group representing wrists
with inflammation and compared with a single control group.
Analyzed in this manner, the number of subjects was adequate
for the study, as demonstrated by the very significant p values.
In the future, it would be of interest to study JRA separately to
see whether very small children would be able to cooperate
with the imaging protocol.
In our study, novel 3D and thermal surface imaging techniques
and post-processing methods were developed and tested in a
clinically relevant setting. The wrist and 2nd-5th MCPs were
selected as targets over other joints given their frequent
involvement in RA and JIA. Since this was a proof-of-concept
study aimed at establishing the ability of surface imaging tech-
nologies to quantify physical changes of arthritis, other small
joints such as the 1st MCP and proximal interphalangeals
were not examined. However, techniques developed in this
study can be easily adapted for use in the assessment of any
other peripheral joint. In addition, imaging was performed only
on the dorsal half of these joints since this is the primary sur-
face evaluated clinically by the rheumatologist and allows the
use of a simple fixation splint and to limit the scans necessary
to provide coverage of the ROI to two per model.
To follow patients longitudinally, it was essential to prevent
minor wrist or hand rotation from session to session which
might cause false variations in volume measurements. The fix-
ation device constructed for this study prevented most such
rotation. Small positioning changes that did occur were readily
overcome by aligning the forearm and hand of models created
across sessions, using specially developed co-registration
functions. Furthermore, the virtual 3D ROI boxes we created
are of fixed size sufficient to allow for progressive shape
changes over time. However, it is possible that, in severe
deformity, additional measures may be needed to image the
entire region. For example, we have found that an additional
3D view taken from the anterior aspect of the hand allows us
to capture the surface of very deformed MCP joints. While
further optimization of the fixation device may be necessary in
order to ensure reproducible positioning between clinic visits,
the innovative methods and technologies developed during
our study may someday result in a clinical device that provides
a rapid and accurate longitudinal assessment of disease
activity.
Conclusion
In the present study, we have established the ability of 3D and
thermal surface imaging to produce reliable, quantifiable
measures of joint volume, shape, and temperature to aid in the
assessment of disease activity in arthritis. We are currently
assessing the inter-observer reliability and the effect of signifi-
cant deformity on this approach in a larger population of RA
and JIA patients. Ultimately, this approach may provide a tool
to improve the accuracy of assessment of arthritis.
Competing interests
LD, RH, DH, and CKK have equity interest in Cartesia Dx
(Pittsburgh, PA, USA). SJS, RB, JE, and JL declare that they
have no competing interests.
Authors' contributions
SJS participated in study design, data acquisition, processing,
analysis, and in preparation of the manuscript. JE participated
in data acquisition and analysis. CKK participated in study
design and helped to draft the manuscript. RB participated in
the design of the study and performed the statistical analysis.
JL constructed the fixation device and participated in study
design. DH and LD helped with study design. RH conceived
of the study, participated in its design and coordination, and
helped to draft the manuscript. All authors read and approved
the final manuscript.
Acknowledgements
The authors thank Taschawee Arkachaisri, Daniel Kietz, Paul Rosen, and
Mary Chester Wasko for their assistance with recruitment of patients.
References
1. Felson DT, Anderson JJ, Boers M, Bombardier C, Furst D, Gold-
smith C, Katz LM, Lightfoot R Jr, Paulus H, Strand V, Tugwell P,
Weinblatt M, Williams HJ, Wolfe F, Kieszak S: American College
of Rheumatology. Preliminary definition of improvement in
rheumatoid arthritis. Arthritis Rheum 1995, 38:727-735.
2. Giannini EH, Ruperto N, Ravelli A, Lovell DJ, Felson DT, Martini A:
Preliminary definition of improvement in juvenile arthritis.
Arthritis Rheum 1997, 40:1202-1209.
3. Bird P, Lassere M, Shnier R, Edmonds J: Computerized meas-
urement of magnetic resonance imaging erosion volumes in
patients with rheumatoid arthritis: a comparison with existing
magnetic resonance imaging scoring systems and standard
clinical outcome measures. Arthritis Rheum 2003, 48:614-624.
4. Guzmán J, Burgos-Vargas R, Duarte-Salazar C, Gómez-Mora P:
Reliability of the articular examination in children with juvenile
rheumatoid arthritis: interobserver agreement and sources of
disagreement. J Rheumatol 1995, 22:2331-2336.
5. Hernández-Cruz B, Cardiel MH: Intra-observer reliability of com-
monly used outcome measures in rheumatoid arthritis. Clin
Exp Rheumatol 1998, 16:459-462.
Available online />Page 9 of 9
(page number not for citation purposes)
6. Goupille P, Roulot B, Akoka S, Avimadje AM, Garaud P, Naccache
L, Le Pape A, Valat JP: Magnetic resonance imaging: a valuable
method for the detection of synovial inflammation in rheuma-
toid arthritis. J Rheumatol 2001, 28:35-40.
7. Arnett FC, Edworthy SM, Bloch DA, McShane DJ, Fries JF, Cooper
NS, Healey LA, Kaplan SR, Liang MH, Luthra HS, Medsger TA,
Mitchell DM, Neustadt DH, Pinals RS, Schaller JG, Sharp JT,
Wilder RL, Hunder GG: The American Rheumatism Association
1987 revised criteria for the classification of rheumatoid
arthritis. Arthritis Rheum 1988, 31:315-324.
8. Petty RE, Southwood TR, Manners P, Baum J, Glass DN, Golden-
berg J, He X, Maldonado-Cocco J, Orozco-Alcala J, Prieur AM,
Suarez-Almazor ME, Woo P, International League of Associations
for Rheumatology: International League of Associations for
Rheumatology classification of juvenile idiopathic arthritis:
second revision, Edmonton, 2001. J Rheumatol 2004,
31:390-392.
9. Thermography guidelines, Standards and Protocols in Clinical
Thermographic Imaging (September 2002) [t-
org.org/professionals/thermog-guidelines.html#/imaging]
10. Jones BF, Plassmann P: Digital infrared thermal imaging of
human skin. IEEE Eng Med Biol Mag 2002, 21:41-48.
11. Otsuka K, Okada S, Hassan M, Togawa T: Imaging of skin ther-
mal properties with estimation of ambient radiation
temperature. IEEE Eng Med Biol Mag 2002, 21:49-55.
12. Shrout JL, Fleiss PE: Intraclass correlations: uses in assessing
rater reliability. Psychol Bull 1979, 86:420-428.
13. Hanley JA, McNeil BJ: The meaning and use of the area under
a receiver operating characteristic (ROC) curve. Radiology
1982, 143:29-36.
14. Gladman DD, Cook RJ, Schentag C, Feletar M, Inman RI, Hitchon
C, Karsh J, Klinkhoff AV, Maksymowych WP, Mosher DP, Nair B,
Stone MA: The clinical assessment of patients with psoriatic
arthritis: results of a reliability study of the spondyloarthritis
research consortium of Canada. J Rheumatol 2004,
31:1126-1131.
15. Prevoo ML, van Riel PL, van 't Hof MA, van Rijswijk MH, van Leeu-
wen MA, Kuper HH, van de Putte LB: Validity and reliability of
joint indices. A longitudinal study in patients with recent onset
rheumatoid arthritis. Br J Rheumatol 1993, 32:589-594.
16. Hill DL, Berg DC, Raso VJ, Lou E, Durdle NG, Mahood JK, Moreau
MJ: Evaluation of a laser scanner for surface topography. Stud
Health Technol Inform 2002, 88:90-94.
17. Kau CH, Cronin A, Durning P, Zhurov AI, Sandham A, Richmond
S: A new method for the 3D measurement of postoperative
swelling following orthognathic surgery. Orthod Craniofac Res
2006, 9:31-37.
18. Kovacs L, Eder M, Hollweck R, Zimmermann A, Settles M, Schnei-
der A, Endlich M, Mueller A, Schwenzer-Zimmerer K, Papadopulos
NA, Biemer E: Comparison between breast volume measure-
ment using 3D surface imaging and classical techniques.
Breast 2007, 16:137-145.
19. Kovacs L, Zimmermann A, Brockmann G, Gühring M, Baurecht H,
Papadopulos NA, Schwenzer-Zimmerer K, Sader R, Biemer E,
Zeilhofer HF: Three-dimensional recording of the human face
with a 3D laser scanner. J Plast Reconstr Aesthet Surg 2006,
59:1193-1202.
20. Marmulla R, Muhling J, Wirtz CR, Hassfeld S: High-resolution
laser surface scanning for patient registration in cranial com-
puter-assisted surgery. Minim Invasive Neurosurg 2004,
47:72-78.
21. Weinberg SM, Kolar JC: Three-dimensional surface imaging:
limitations and considerations from the anthropometric
perspective. J Craniofac Surg 2005, 16:847-851.
22. Highton J, Davidson P, Markham V: A laser-aligned method for
anthropometry of hands. J Biomech 2003, 36:1397-1400.
23. Highton J, Markham V, Doyle TC, Davidson PL: Clinical character-
istics of an anatomical hand index measured in patients with
rheumatoid arthritis as a potential outcome measure. Rheu-
matology (Oxford) 2005, 44:651-655.
24. Brenner M, Braun C, Oster M, Gulko PS: Thermal signature anal-
ysis as a novel method for evaluating inflammatory arthritis
activity. Ann Rheum Dis 2006, 65:306-311.
25. MacDonald AG, Land DV, Sturrock RD: Microwave thermogra-
phy as a noninvasive assessment of disease activity in inflam-
matory arthritis. Clin Rheumatol 1994, 13:589-592.
26. Ilowite NT, Walco GA, Pochaczevsky R: Assessment of pain in
patients with juvenile rheumatoid arthritis: relation between
pain intensity and degree of joint inflammation. Ann Rheum
Dis 1992, 51:343-346.
27. Helliwell PS: "The cool patella sign". J Rheumatol 1992,
19:1006.
28. Black CM, Clark RP, Darton K, Goff MR, Norman TD, Spikes HA:
A pyroelectric thermal imaging system for use in medical
diagnosis. J Biomed Eng 1990, 12:281-286.
29. van Holsbeeck M, van Holsbeeck K, Gevers G, Marchal G, van
Steen A, Favril A, Gielen J, Dequeker J, Baert A: Staging and fol-
low-up of rheumatoid arthritis of the knee. Comparison of
sonography, thermography, and clinical assessment. J Ultra-
sound Med 1988, 7:561-566.
30. Ring EF: Thermographic and scintigraphic examination of the
early phase of inflammatory disease. Scand J Rheumatol Suppl
1987,
65:77-80.
31. Fraser S, Land D, Sturrock RD: Microwave thermography – an
index of inflammatory joint disease. Br J Rheumatol 1987,
26:37-39.
32. de Silva M, Kyle V, Hazleman B, Salisbury R, Page Thomas P,
Wraight P: Assessment of inflammation in the rheumatoid
knee joint: correlation between clinical, radioisotopic, and
thermographic methods. Ann Rheum Dis 1986, 45:277-280.
33. Devereaux MD, Parr GR, Thomas DP, Hazleman BL: Disease
activity indexes in rheumatoid arthritis; a prospective, compar-
ative study with thermography. Ann Rheum Dis 1985,
44:434-437.
34. Bird HA, Ring EF, Bacon PA: A thermographic and clinical com-
parison of three intra-articular steroid preparations in rheuma-
toid arthritis. Ann Rheum Dis 1979, 38:36-39.
35. Collins AJ, Ring EF, Cosh JA, Bacon PA: Quantitation of ther-
mography in arthritis using multi-isothermal analysis. I. The
thermographic index. Ann Rheum Dis 1974, 33:113-115.
36. Viitanen SM, Laaksonen AL: Thermography in juvenile rheuma-
toid arthritis. Acta Rheumatol Scand 1970, 16:91-98.
37. Boas NF: Thermography in rheumatoid arthritis. Ann N Y Acad
Sci 1964, 121:223-34.
38. Salisbury RS, Parr G, De Silva M, Hazleman BL, Page-Thomas DP:
Heat distribution over normal and abnormal joints: thermal
pattern and quantification. Ann Rheum Dis 1983, 42:494-499.
39. Graham TB, Laor T, Dardzinski BJ: Quantitative magnetic reso-
nance imaging of the hands and wrists of children with juve-
nile rheumatoid arthritis. J Rheumatol 2005, 32:1811-1820.
40. Peterfy C, Edmonds J, Lassere M, Conaghan P, Østergaard M,
McQueen F, Genant H, Klarlund M, Ejbjerg B, Stewart N, Bird P,
Shnier R, O'Connor P, Emery P: OMERACT Rheumatoid Arthritis
MRI Studies Module. J Rheumatol 2003, 30:1364-1365.
41. Haavardsholm EA, Ostergaard M, Ejbjerg BJ, Kvan NP, Uhlig TA,
Lilleås FG, Kvien TK: Reliability and sensitivity to change of the
OMERACT rheumatoid arthritis magnetic resonance imaging
score in a multireader, longitudinal setting.
Arthritis Rheum
2005, 52:3860-3867.
42. Backhaus M, Kamradt T, Sandrock D, Loreck D, Fritz J, Wolf KJ,
Raber H, Hamm B, Burmester GR, Bollow M: Arthritis of the fin-
ger joints: a comprehensive approach comparing conventional
radiography, scintigraphy, ultrasound, and contrast-enhanced
magnetic resonance imaging. Arthritis Rheum 1999,
42:1232-1245.
43. Naredo E, Bonilla G, Gamero F, Uson J, Carmona L, Laffon A:
Assessment of inflammatory activity in rheumatoid arthritis: a
comparative study of clinical evaluation with grey scale and
power Doppler ultrasonography. Ann Rheum Dis 2005,
64:375-381.