Báo cáo y học: " Dysfunctional interferon-α production by peripheral plasmacytoid dendritic cells upon Toll-like receptor-9 stimulation in patients with systemic lupus erythematosus" doc
Bạn đang xem bản rút gọn của tài liệu. Xem và tải ngay bản đầy đủ của tài liệu tại đây (1.21 MB, 11 trang )
Open Access
Available online />Page 1 of 11
(page number not for citation purposes)
Vol 10 No 2
Research article
Dysfunctional interferon-α production by peripheral plasmacytoid
dendritic cells upon Toll-like receptor-9 stimulation in patients
with systemic lupus erythematosus
Seung-Ki Kwok
1
*, June-Yong Lee
1,2
*, Se-Ho Park
2
, Mi-La Cho
1
, So-Youn Min
1
, Sung-Hwan Park
1
,
Ho-Youn Kim
1
and Young-Gyu Cho
1
1
Department of Medicine, Division of Rheumatology, Center for Rheumatic Diseases and Rheumatism Research Center, Catholic Research Institutes
of Medical Sciences, Catholic University of Korea, Banpo-Dong, Seocho-Gu, Seoul, 137-701, Korea
2
School of Life Sciences and Biotechnology, Korea University, Anam-Dong, Seongbuk-Gu, Seoul, 136-701, Korea
* Contributed equally
Corresponding author: Ho-Youn Kim, Cho,
Received: 9 Oct 2007 Revisions requested: 6 Nov 2007 Revisions received: 19 Feb 2008 Accepted: 6 Mar 2008 Published: 6 Mar 2008
Arthritis Research & Therapy 2008, 10:R29 (doi:10.1186/ar2382)
This article is online at: />© 2008 Kwok et al.; licensee BioMed Central Ltd.
This is an open access article distributed under the terms of the Creative Commons Attribution License ( />),
which permits unrestricted use, distribution, and reproduction in any medium, provided the original work is properly cited.
Abstract
Background It is well known that interferon (IFN)-α is important
to the pathogenesis of systemic lupus erythematosus (SLE).
However, several reports have indicated that the number of IFN-
α producing cells are decreased or that their function is
defective in patients with SLE. We studied the function of
plasmacytoid dendritic cells (pDCs) under persistent stimulation
of Toll-like receptor (TLR)9 via a TLR9 ligand (CpG ODN2216)
or SLE serum.
Methods The concentrations of IFN-α were determined in
serum and culture supernatant of peripheral blood mononuclear
cells (PBMCs) from SLE patients and healthy controls after
stimulation with CpG ODN2216 or SLE serum. The numbers of
circulating pDCs were analyzed by fluoresence-activated cell
sorting analysis. pDCs were treated with CpG ODN2216 and
SLE serum repeatedly, and levels of produced IFN-α were
measured. The expression of IFN-α signature genes and
inhibitory molecules of TLR signaling were examined in PBMCs
from SLE patients and healthy control individuals.
Results Although there was no significant difference in serum
concentration of IFN-α and number of circulating pDCs
between SLE patients and healthy control individuals, the IFN-α
producing capacity of PBMCs was significantly reduced in SLE
patients. Interestingly, the degree which TLR9 ligand-induced
IFN-α production in SLE PBMCs was inversely correlated with
the SLE serum-induced production of IFN-α in healthy PMBCs.
Because repeated stimulation pDCs with TLR9 ligands showed
decreased level of IFN-α production, continuous TLR9
stimulation may lead to decreased production of IFN-α in SLE
PBMCs. In addition, PBMCs isolated from SLE patients
exhibited higher expression of IFN-α signature genes and
inhibitory molecules of TLR signaling, indicating that these cells
had already undergone IFN-α stimulation and had become
desensitized to TLR signaling.
Conclusion We suggest that the persistent presence of
endogenous IFN-α inducing factors induces TLR tolerance in
pDCs of SLE patients, leading to impaired production of IFN-α.
Introduction
Systemic lupus erythematosus (SLE) is a systemic autoim-
mune disease that is characterized by generation of autoanti-
bodies against nuclear DNA and/or nuclear proteins [1]. The
precise pathogenesis of SLE remains unknown, but both
genetic and environmental factors are involved [2]. Over the
past two decades numerous studies have suggested that
interferon (IFN)-α may play a pathogenic role in SLE. This view
is derived from the observation that IFN-α treatment in patients
with nonautoimmune diseases, such as malignant tumors,
induced anti-double-stranded DNA antibodies and occasion-
ally resulted in the development of an SLE-like syndrome [3-7].
SLE patients exhibit ongoing IFN-α production, and IFN-α
serum levels are correlated with both disease activity and
BDCA = blood dendritic cell antigen; ELISA = enzyme-linked immunosorbent assay; IFN = interferon; IL = interleukin; IRAK = IL-1 receptor-associated
kinase; PBMC = peripheral blood mononuclear cell; PCR = polymerase chain reaction; pDC = plasmacytoid dendritic cell; SLE = systemic lupus
erythematosus; SLEDAI = SLE Disease Activity Index; TLR = Toll-like receptor.
Arthritis Research & Therapy Vol 10 No 2 Kwok et al.
Page 2 of 11
(page number not for citation purposes)
severity [8,9]. IFN-α levels also correlate with anti-double-
stranded DNA antibody production, complement activation,
and IL-10 production, all of which are important indicators in
SLE disease progression [9].
IFN-α plays a role in the activation, differentiation, and survival
of B cells, T cells, and dendritic cells. IFN-α is mainly produced
in plasmacytoid dendritic cells (pDCs); they were originally
termed natural IFN-α producing cells [10-12]. pDCs are key
effector cells in the innate immune system because of their
ability to produce large amounts of IFN-α in response to micro-
bial and viral infections. Human pDCs selectively express Toll-
like receptor (TLR)7 and TLR9 within the endosomal compart-
ment. These receptors are activated in response to viral RNA
and DNA, leading to production of IFN-α [12,13]. Recent
studies have shown that DNA-containing immune complexes
within SLE serum stimulate pDCs to produce IFN-α [14,15],
which is mediated cooperatively by TLR9 and FcγRIIa (CD32)
[15].
Patients with SLE have reduced numbers of circulating natural
IFN-α producing cells. The levels of IFN-α produced by SLE
peripheral blood mononuclear cells (PBMCs) induced by SLE
serum that contained an endogenous IFN-α-inducing factor,
herpes simplex virus type 1, or the D type of CpG motif were
lower than those produced by healthy control PBMCs, and the
IFN-α producing capability of circulating pDCs in SLE patients
may be impaired [16-18]. These results do not fit well with the
role of IFN-α in SLE pathogenesis described above, although
they suggest that the local concentration of IFN-α in an
affected region is important. Furthermore, there have been
reports that the pDCs from SLE patients and healthy control
individuals produce similar amounts of IFN-α on a per cell
basis in response to viral infection [17,19]. We wished to
establish definitively the IFN-α production capability of
PBMCs from SLE patients, and we show that IFN-α produc-
tion is dysfunctional in pDCs from such patients.
We hypothesized that the persistent presence of DNA-con-
taining immune complexes, which stimulate TLR9, affects the
function of pDCs resulting in their malfunction. We analyzed
serum levels of IFN-α in SLE patients and in vitro production
of IFN-α in isolated PBMCs subjected to artificial stimulation
by CpG ODN2216, which specifically activates human TLR9
in pDCs but not in B cells [20]. We also examined the number
of circulating pDCs in SLE patients, as compared with those
in healthy control individuals, using specific pDC surface mark-
ers and flow cytometry. The expression of IFN-α signature
genes (IFN-α responsive genes) and inhibitory molecules of
the TLR signaling cascade were examined. Our findings sug-
gest that pDCs are dysfunctional in patients with chronic SLE,
which is probably due to desensitization of TLR9 as a result of
over-stimulation by DNA-containing immune complexes that
are present in the sera of SLE patients.
Materials and methods
Patients and control individuals
This study was approved by the Institutional Review Board of
Kangnam St. Mary's Hospital (Seoul, Korea) and all partici-
pants provided informed consent. Forty-three consecutive
patients (two males and 41 females; age 35 ± 8.4 years) who
presented at the rheumatology clinic and fulfilled the revised
classification criteria for SLE [21] were enrolled in the study.
Twenty-six volunteers (one male and 25 females; age 38.4 ±
4.3 years) were recruited to serve as healthy control individu-
als. Among the 43 patients, two patients were off prescription
medication (in remission) and three were receiving pred-
nisolone alone (mean dosage 12.5 mg/day; range 5 to 20 mg/
day). The remaining 38 patients were receiving both pred-
nisolone (mean dosage 13.3 mg/day; range 2.5 to 125 mg/
day) and adjunctive therapies, such as hydroxychloroquine (34
patients; 200 or 400 mg/day), azathioprine (four patients),
mizoribine (four patients), mycophenolate mofetil (three
patients), and cyclosporine (one patient). Disease activity was
scored using the SLE Disease Activity Index (SLEDAI) [22].
Descriptive statistics and clinical data for the SLE patients are
described in Table 1.
Preparation of PBMCs and pDCs
Blood samples obtained from patients and healthy control indi-
viduals were collected in heparinized tubes (BD Biosciences,
San Jose, CA, USA), and PBMCs were prepared using Ficoll-
Hypaque (Amersham Bioscience, Pascataway, NJ, USA) den-
sity gradient centrifugation. Cells were washed and sus-
pended in RPMI 1640 medium (GibcoBRL, Carlsbad, CA,
USA) containing penicillin (100 U/ml), streptomycin (100 μg/
ml), and 10% fetal bovine serum (GibcoBRL) that had been
inactivated by heating to 56°C for 1 hour. Healthy pDCs were
isolated from PBMCs using a Diamond Plasmacytoid Den-
dritic Cell Isolation Kit (Miltenyi Biotec, Bergisch Gladbach,
Germany); pDC purity was greater than 95%. The purified
pDCs were cultured in RPMI 1640 medium containing 10%
fetal bovine serum, granulocyte-macrophage colony stimulat-
ing factor (10 ng/ml), and IL-3 (10 ng/ml).
Flow cytometry
PBMCs were incubated with human IgG to block the Fc
receptor and then incubated with anti-CD123-PE-Cy5 mono-
clonal antibody (Mouse IgG
1
; BD Pharmingen™, San Jose,
CA, USA), anti-BDCA-2-fluorescein isothiocyanate, and mon-
oclonal antibody (Mouse IgG
1
; Miltenyi Biotec) for 30 minutes
at 4°C; isotype control experiments were conducted in paral-
lel. After two washes, the cells were re-suspended in phos-
phate-buffered saline and analyzed by flow cytometry. pDCs
were identified by dual staining for both CD123 and blood
dendritic cell antigen (BDCA)-2.
IFN-α induction
PBMCs (1 × 10
6
cells) were stimulated using 1 μmol/l CpG
ODN2216 (InvivoGen, San Diego, CA, USA) or 30% serum
Available online />Page 3 of 11
(page number not for citation purposes)
from SLE patients. Duplicate cultures were performed in 48-
well plates (NUNK, Roskilde Denmark) at a final volume of 500
μl/well. After 24 hours IFN-α was measured from the
supernatant.
Measurement of IFN-α
Supernatants collected from sera and cell cultures were
stored at -70°C until further use. The amounts of IFN-α in the
sera and supernatants were then measured using a sensitive
sandwich ELISA kit (Bender MedSystems, Vienna, Austria). A
representative standard curve for the IFN-α ELISA is shown in
Additional file 1 (Supplementary Figure 1). All measurements
were performed in duplicate and averaged values were used
in the data analysis.
pDC stimulation with TLR9 ligand and SLE serum
Purified pDCs (2 × 10
4
cells) were incubated with or without
the TLR9 ligand CpG ODN2216 (1 μmol/l; InvivoGen) or 30%
serum from SLE patients in 96-well plates (NUNK) at a final
volume of 200 μl/well. After 24 hours the pDCs were carefully
washed with serum-free RPMI and re-treated with or without
CpG ODN2216 (1 μmol/l) or 30% serum from SLE patients.
The supernatants were harvested after an additional 24 hours
and IFN-α production was measured using ELISA. In the
recovery assay, pDCs were treated with 1 μmol/l CpG
ODN2216 for 24 hours, washed with serum-free medium, cul-
tured with serum-containing medium for 0, 24, or 48 hours,
and then treated again with CpG ODN2216 (1 μmol/l). After
24 hours IFN-α production was measured from the
supernatant.
Cell viability assay
Relative cell viability was measured by Quick Cell Proliferation
Assay kit (BioVision, Mountain View, CA, USA). Briefly, 1/10
volume of WST-1/electrocoupling solution were added into
the culture media, incubated 4 hours in 5% carbon dioxide
incubator, and measured the absorbance of the treated and
untreated samples with water-soluble tetrazolium salt (WST)-
1/electrocoupling solution using a microtiter plate reader at
450 nm. Each sample was duplicated and averages of the
absorbance were used in comparisons. The differences in
absorbance between treated and untreated samples was
shown as relative cell viability.
Reverse transcription PCR
Total RNA was extracted from isolated PBMCs or cultured
cells using RNAzol B (Biotex Laboratories, Houston, TX,
USA), in accordance with the manufacturer's instructions.
Reverse transcription using 2 μg total RNA was carried out at
42°C using the Superscript reverse transcription system
(Takara, Shiga, Japan). PCR amplification was performed in a
reaction mixture containing 2.5 mmol/l dNTPs, 2.5 U Taq DNA
Table 1
Demographic and clinical characteristics of SLE patients
Characteristic SLE patients (n = 43)
Age (years; mean [range]) 35.0 (21 to 56)
Sex (n; males/females) 2/41
Disease duration (years; mean [range]) 8.5 (0.1 to 18)
SLEDAI (mean ± SD) 3.72 ± 3.84
Active (n = 9)
a
9.55 ± 4.50
Inactive (n = 34) 2.17 ± 1.42
Cutaneous manifestation (n [%]) 26 (60.5)
Arthritis (n [%]) 27 (62.8)
Renal manifestation (n [%]) 9 (20.9)
Cytopenia (n [%]) 11 (25.6)
Serositis (n [%]) 8 (18.6)
Prednisolone (n [%]; mean dosage [mg/day]) 41 (95.3); 13.0
Hydroxychloroquine (n [%]) 34 (79.1)
Azathioprine (n [%]) 4 (9.3)
Cyclosporin (n [%]) 1 (2.3)
Mizoribine (n [%]) 4 (9.3)
Mycophenolate mofetil (n [%]) 3 (7.0)
a
Systemic Lupus Erythematosus Disease Activity Index above 4. SD, standard deviation; SLE, systemic lupus erythematosus.
Arthritis Research & Therapy Vol 10 No 2 Kwok et al.
Page 4 of 11
(page number not for citation purposes)
polymerase (Takara), 0.25 μmol/l sense and antisense prim-
ers, and PCR buffer (1.5 mmol/l MgCl
2
, 50 mmol/l KCl, 10
mmol/l Tris-HCl [pH 8.3]). Reactions were processed in a
DNA thermal cycler (Perkin-Elmer Cetus, Wellesley, MA,
USA). PCR products were separated on a 2.5% agarose gel
and stained with ethidium bromide. The latest cycle number
during which PCR products were not yet saturated was
selected and used to compare treatments using Quantity One
software (version 4.5.2; BioRad, Hercules, CA, USA). Results
are expressed as the ratio of target PCR products to GAPDH
(glyceraldehyde-3-phosphate dehydrogenase) or β-actin
product. The used primer pairs are described in Table 2.
Measuring immune complex levels in SLE patients' sera
To measure the serum levels of immune complexes in SLE
patients, we used the CIC-C1Q Circulating Immune Com-
plexes ELISA kit (Bühlmann Laboratories AG, Schonenbuch,
Switzerland). Circulating immune complexes from sera from
patients with chronic SLE and control individuals were incu-
bated with human C1q, which was adsorbed onto microtiter
wells. After a washing step, we added alkaline phosphatase-
conjugated protein A, which binds to the Fc region of human
IgG. After an additional washing step, the enzyme substrate
(paranitrophenyl-phosphate) was added, followed by a stop
solution. The absorption at 405 nm of each sample was meas-
ured. We used 14 SLE sera, two of which were from patients
with SLEDAI values of 12 and 16, and the remainder were
from patients with SLEDAI values of less than 4. The two
active SLE sera exhibited 1.8 U and 6.3 U of immune
complexes.
Statistical analysis
Differences between groups were analyzed using the Mann-
Whitney U-test or Student's t-test. Correlation analyses were
performed using Spearman's rank correlation test. All analyses
were performed using SPSS (version 10.0; SPSS Inc., Chi-
cago, IL, USA). Data are expressed as the mean ± standard
deviation.
Results
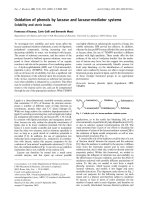
In vitro IFN-α production is reduced in PBMCs from SLE
patients
We used ELISA to compare serum concentrations of IFN-α
between SLE patients and healthy control individuals (Figure
1a). Patients with active SLE (SLEDAI > 4) exhibited signifi-
cantly higher levels of IFN-α than did patients with inactive
SLE and healthy control individuals (P = 0.002 and P = 0.007,
respectively). However, the levels of IFN-α in total SLE
patients (active and inactive) versus healthy control individuals
were not significantly different (P = 0.280). No correlation was
observed between serum IFN-α levels and the clinical charac-
teristics of SLE, such as disease duration, or medications such
as steroids and hydroxychloroquine (data not shown).
Because the number of circulating pDCs is very low among
total PMBCs, making it difficult to isolate this cell type from a
blood sample, IFN-α production was measured in total
PBMCs using a pDC-specific TLR9 ligand [20]. PBMCs from
patients with SLE and healthy controls werestimulated in vitro
for 24 hours using the TLR9 ligand CpG ODN2216. IFN-α
production was then measured using ELISA. CpG DNA
induced IFN-α production was markedly reduced in PBMCs
from SLE patients as compared with PBMCs from healthy
Table 2
Sequences of primer pairs
Target molecules Sequence
GAPDH Forward: 5'-CGA TGC TGG GCG TGA GTA C-3'
Reverse: 5'-CGT TCA GCT CAG GGA TGA CC-3'
β-actin Forward: 5'-GGA CTT CGA GCA AGA GAT GG-3'
Reverse: 5'-TGT GTT GGC GTA CAG GTC TTT G-3'
TLR9 Forward: 5'-GTG CCC CAC TTC TCC ATG-3'
Reverse: 5'-GGC ACA GTC ATG ATG TTG TTG-3'
IFI44 Forward: 5'-CTC GGT GGT TAG CAA TTA TTC CTC-3'
Reverse: 5'-AGC CCA TAG CAT TCG TCT CAG-3'
IFIT1 Forward: 5'-CTC CTT GGG TTC GTC TAC AAA TTG-3'
Reverse: 5'-AGT CAG CAG CCA GTC TCA G-3'
PRKR Forward: 5'-CTT CCA TCT GAC TCA GGT TT-3'
Reverse: 5'-TGC TTC TGA C G GTA TGT ATT A-3'
MyD88s Forward: 5'-CGG CAA CTG GAG ACA CAA G-3'
Reverse: 5'-TCT GGA AGT CAC ATT CCT TGC-3'
IRAK-M Forward: 5'-TTT GAA TGC AGC CAG TCT GA-3'
Reverse: 5'-GCA TTG CTT ATG GAG CCA AT-3'
GAPDH, glyceraldehyde-3-phosphate dehydrogenase; IFI44, interferon-induced protein 44; IFIT1, interferon-induced protein with
tetratricopeptide repeats 1; PRKR, Interferon-inducible double-stranded RNA-dependent protein kinase; TLR, Toll-like receptor.
Available online />Page 5 of 11
(page number not for citation purposes)
control individuals (342.46 ± 636.82 pg/ml in SLE patients
versus 1610.35 ± 759.56 pg/ml in healthy control individuals;
P < 0.001; Figure 1b). In addition, IFN-α production was
slightly higher in patients with active SLE than in those with
inactive SLE, but the difference was not significant (P =
0133). No correlation was observed between serum levels of
IFN-α and CpG-induced IFN-α production in vitro in patients
with active SLE. Interestingly, IFN-α production was com-
pletely abolished in PBMCs from one-third of SLE patients.
These data are almost identical to those reported previously
[18]. Although CpG ODN2216 was not used in that previous
work, CPG oligonucleotides, herpesviruses, and DNA-con-
taining immune complexes are all TLR9 ligands. Our findings
are in accordance with thosse of previous studies showing
that PBMCs from SLE patients have reduced capacity to pro-
duce IFN-α in response to TLR9 stimulation [16,17].
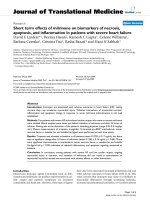
Decreased IFN-α production in SLE patients cannot be
fully explained in terms of decreased numbers of
circulating pDCs
Because pDCs are major producers of IFN-α, decreased IFN-
α levels in SLE patients may be the result of a drop in pDC
count [16,17,23]. To test this possibility, we stained PBMCs
with anti-BDCA-2 and anti-CD123, which recognize specific
surface markers for human pDCs [23]. During fluoresence-
activated cell sorting analysis, PBMCs were selected in gate
R1 and BDCA-2
+
/CD123
+
cells from gate R1 were deemed
pDCs, as shown in gate R2 (Figure 2a). The percentage of
pDCs among PBMCs was slightly reduced in SLE patients
compared with healthy control individuals (0.23 ± 0.11% in
SLE patients versus 0.30 ± 0.14% in controls; P > 0.10; Fig-
ure 2b). Although this difference was not statistically signifi-
cant, a decrease in pDC count may partially contribute to
reduced IFN-α production. We observed similar results for the
absolute number of circulating pDCs (data not shown).
Because pDCs are a major source of IFN-α in human PBMCs
[10-12], we calculated the relative IFN-α producing capacity
of pDCs in vitro as follows. The amount of IFN-α produced
upon CpG ODN2216 stimulation in vitro was divided by the
absolute number of pDCs. As expected from results
presented in Figures 1b and 2b, the relative IFN-α producing
capacity of pDCs was significantly lower in SLE patients than
in control individuals (0.2 ± 0.18 in SLE patients versus 1 ±
0.5 in control individuals; P < 0.01; Figure 2c). These data,
and the fact that PBMCs from one-third of SLE patients did
not produce IFN-α, suggest that the observed decrease in
IFN-α production is caused by aberrant function in SLE pDCs
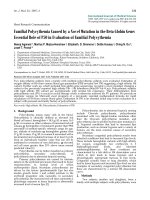
Figure 1
IFN-α serum levels and in vitro IFN-α production after CpG ODN2216-stimulationIFN-α serum levels and in vitro IFN-α production after CpG ODN2216-stimulation. (a) Interferon (IFN)-α serum levels were measured in blood sam-
ples collected from patients with systemic lupus erythematosus (SLE) and healthy control individuals using ELISA. Patients with a SLE Disease
Activity Index above 4 were classified as having active SLE. Although serum IFN-α levels were higher in patients with active SLE than in those with
inactive SLE and healthy control individuals, IFN-α levels in all SLE patients combined were not significantly different from those in healthy control
individuals (3.72 ± 3.89 pg/ml in SLE patients [n = 43] versus 1.2 ± 3.9 pg/ml in healthy control individuals [n = 26]; P = 0.280 < 0.001). (b) IFN-
α concentrations in culture supernatants were measured using ELISA after 24 hours of incubation with CpG ODN2216. IFN-α production in periph-
eral blood mononuclear cells isolated from SLE patients was significantly lower than that in cells isolated from healthy control individuals (342.46 ±
636.82 pg/ml in SLE patients [n = 43] versus 1,610.35 ± 759.56 pg/ml in healthy controls [n = 26]; P < 0.001). IFN-α production in peripheral
blood mononuclear cells isolated from active SLE patients was also significantly lower than in cells isolated from healthy control individuals (P =
0.005). The solid bars represent the mean value in each experimental group. Patients with high IFN-α serum levels are indicated by #, *, and $ in
both experiments. Statistical significance was analyzed using Student's t-test.
Arthritis Research & Therapy Vol 10 No 2 Kwok et al.
Page 6 of 11
(page number not for citation purposes)
or depletion of some proportion of pDCs, and not by a
decrease in total pDC count. However, there is no way to
determine the proportion of pDCs in the blood.
Downregulation of TLR9 may also contribute to decreases in
IFN-α production in SLE patients. We used semiquantitative
reverse transcription PCR to determine the expression of
TLR9 in PBMCs. Interestingly, TLR9 expression was higher in
SLE PBMCs than in cells from healthy control individuals (Fig-
ure 2d). These data demonstrate that the decrease in IFN-α
production was not caused by downregulation of TLR9
expression.
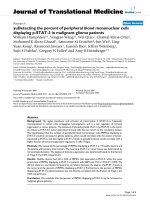
CpG-induced IFN-α production in SLE PBMCs is
inversely correlated with SLE serum induced IFN-α
production in healthy PMBCs
Differences in the numbers of circulating pDCs do not fully
explain the difference in IFN-α production capability between
the SLE and healthy PBMCs. Furthermore, it has been
reported that TLR9 expression levels in the pDCs of SLE
patients and healthy control individuals are similar [24]. We
suspected that the presence of DNA-containing immune com-
plexes, which function as TLR9 ligands, affect pDC function.
In SLE patients, these immune complexes stimulate pDCs to
produce IFN-α via TLR9 and FcγRIIa (CD32) [14,15]. We
incubated healthy PBMCs with serum from SLE patients and
healthy control individuals, and then measured the production
of IFN-α. As expected, serum from SLE patients induced IFN-
α production to a much greater degree than did serum from
healthy control individuals (24.1 ± 27.5 pg/ml versus 4.1 ±
3.14 pg/ml, respectively; P < 0.005; Figure 3a). Paradoxically,
SLE patients whose serum induces low levels of IFN-α
production in PBMCs from healthy individuals possess
PBMCs that exhibit higher IFN-α production when stimulated
by the TLR9 ligand CpG ODN2216 (Figures 1b and 3b). Vice
versa, those patients with SLE whose serum induces high lev-
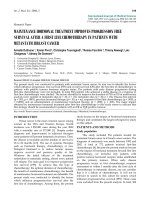
Figure 2
Proportion of pDCs and IFN-α production capacityProportion of pDCs and IFN-α production capacity. (a) A gating strategy was used to distinguish plasmacytoid dendritic cells (pDCs) from among
peripheral blood mononuclear cells (PBMCs). Blood cells were analyzed using flow cytometry. Total PBMCs were gated at R1 and then analyzed for
the presence of blood dendritic cell antigen (BDCA)-2 and CD123. Both BDCA-2-positive and CD123-positive cells were identified as pDCs in
gate R2. (b) The proportion of pDCs among PBMCs in patients with systemic lupus erythematosus (SLE) versus healthy control individuals. The
solid bars represent the mean percentage of pDCs among PBMCs (0.23% in SLE patients versus 0.30% in controls; P > 0.10). Statistical signifi-
cance was analyzed using the Mann-Whitney U-test. (c) Relative IFN-α producing capacity in SLE patients versus healthy control individuals. CpG
ODN2216-induced IFN-α production was divided by the absolute number of pDCs. (d) Expression of Tll-like receptor (TLR)9 mRNA. TLR-9 expres-
sion in PBMCs was measured using semiquantitative reverse transcription PCR. The expression of TLR9 is presented relative to β-actin expression.
Each analysis was performed in triplicate, and the average values are indicated by a solid square for SLE patients and solid triangle for healthy con-
trol individuals. The solid bars represent the mean value for each experimental group. Statistical significance was analyzed using the Mann-Whitney
U-test.
Available online />Page 7 of 11
(page number not for citation purposes)
els of IFN-α production in PBMCs from healthy individuals
possess PBMCs that exhibit lower IFN-α production in
response to CpG ODN2216. In other words, the degree of
CpG-induced IFN-α production in SLE PBMCs correlated
inversely with SLE serum induced IFN-α production in healthy
PBMCs. Also, SLE serum induced IFN-α production in healthy
PBMCs correlated with the amount of immune complexes in
SLE serum (Figure 3c), and the degree of CpG-induced IFN-
α production in SLE PBMCs was inversely correlated with the
amounts of immune complexes in matched SLE patients (Fig-
ure 3d).
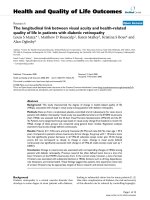
Repeated stimulation induces TLR9 tolerance in pDCs
Because there was an inverse correlation between IFN-α pro-
ducing capacity in SLE PBMCs and SLE serum induced IFN-
α production in control PBMCs, we hypothesized that the per-
sistent presence of DNA-containing immune complexes may
desensitize pDCs to TLR9 stimulation. TLR tolerance, in which
cells exhibit no response to subsequent challenges with the
same TLR stimulus, has been reported in epithelial cells, neu-
trophils, macrophages, and conventional dendritic cells [25-
28]. To test this hypothesis, we induced TLR9 tolerance by
repeatedly stimulating pDCs isolated from healthy individuals
using CpG ODN2216 or 30% serum derived from SLE
patients. Both IL-3 and granulocyte-monocyte colony stimulat-
ing factor are essential cytokines for pDC survival and were
thus included in the culture medium [29]. Repeated stimula-
tion using CpG ODN2216 or 30% serum from SLE patients
resulted in 65% and 90% decreases in IFN-α production,
respectively (Figure 4a); cell viability was not affected (data
not shown). These data indicate that repeated stimulation
induces TLR9 tolerance in pDCs and are similar to previous
data indicating that pDCs produce large amounts of IFN-α
within the first 12 hours of activation and become refractory to
subsequent stimulation [30].
TLR9 tolerance may be the result of negative feedback in the
TLR signaling pathway [31]. Therefore, we examined whether
TLR9 tolerance is reversible. pDC PBMCs from healthy indi-
viduals were incubated with CpG ODN2216 or 30% SLE
serum for 1 day, washed, and then re-stimulated with CpG
ODN2216 or 30% SLE serum after a given interval (0, 24, or
48 hours), as indicated in Figure 4b. IFN-α production was
measured 24 hours after re-stimulation. IFN-α production
decreased upon repeated stimulation at the 0 hours interval
and recovered within 48 hours of the first stimulation in repeat-
Figure 3
IFN-α production in PBMCs stimulated using serum from SLE patients or healthy control individualsIFN-α production in PBMCs stimulated using serum from SLE patients or healthy control individuals. (a) Peripheral blood mononuclear cells
(PBMCs), obtained from healthy individuals, were incubated with serum from patients with systemic lupus erythematosus (SLE) or healthy control
individuals for 24 hours. Interferon (IFN)-α production was measured using ELISA. The solid bars represent the mean value for each experimental
group. The experiment was performed twice using PBMCs obtained from separate healthy individuals. Data are representative of two independent
experiments. (b) Inverse correlation between the amount of CpG induced IFN-α production in SLE PBMCs (n = 22) versus SLE serum induced IFN-
α in control PBMCs. (c) Positive correlation between the amounts of immune complexes versus SLE serum induced IFN-α in control PBMCs (n =
14). (d) Inverse correlation between the amount of CpG-induced IFN-α production in SLE PBMCs versus the amounts of immune complexes (n =
14). Correlation analyses were performed using Spearman's rank correlation test.
Arthritis Research & Therapy Vol 10 No 2 Kwok et al.
Page 8 of 11
(page number not for citation purposes)
edly stimulated pDCs (Figure 4c,d). The cell viability did not
differ significantly between stimulation and re-stimulation
groups (lower panels of Figure 4c,d). Although we could not
test the recovery of IFN-α production capability by pDCs puri-
fied from SLE patients, the PBMCs from SLE patients recov-
ered IFN-α production capability over time in vitro, without
further stimulation, as shown in Additional file 1 (Supplemen-
tary Figure 2). These data indicate that TLR9 tolerance is
reversible over time and that continuous TLR9 stimulation is
required to induce persistent nonresponsiveness in pDCs.
SLE PBMCs are exposed to IFN-α to a greater degree
Because the overall amounts of IFN-α in SLE sera were not
significantly different from those in sera from healthy control
individuals (Figure 1a), it was unclear whether circulating
pDCs had already become TLR9 tolerant. Therefore, we used
fluorescence-activated cell sorting to analyze the expression
of CD80, CD86, and HLA-DR, which are markers of pDC mat-
uration and activation. However, the number of circulating
pDCs was too low to provide conclusive evidence regarding
the activation of PDCs. Instead, we examined the expression
of IFN-α signature genes in SLE PBMCs [32], including IFIT1
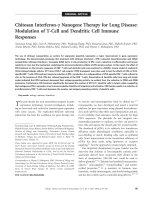
Figure 4
TLR9 tolerance in pDCsTLR9 tolerance in pDCs. (a) Repeated treatment with CpG ODN2216 and systemic lupus erythematosus (SLE) serum reduced interferon (IFN)-α
production. Plasmacytoid dendritic cells (pDCs) were purified from peripheral blood mononuclear cells (PBMCs) of healthy individuals using Dia-
mond Plasmacytoid Dendritic Cell Isolation Kit (Miltenyi Biotec) and 2 × 10
4
pDCs were incubated with or without CpG ODN2216 or 30% SLE
serum. After 24 hours pDCs were carefully washed in serum-free medium and then incubated again with or without CpG ODN2216 or 30% SLE
serum. After 24 hours, IFN-α production was measured using ELISA. The experiments were performed in duplicate and three independent experi-
ments were performed using PBMCs from different individuals. The data are presented in (Additional file 1 [Supplementary Figure 4]) and the aver-
ages of data are shown. (b) Experimental design to investigate the time-dependent recovery of Toll-like receptor (TLR)9 sensitivity. pDCs were
purified from total PBMCs of healthy individuals, and 2 × 10
4
pDCs were treated with or without CpG ODN2216 or SLE sera for 1 day. The pDCs
were then washed with serum-free medium and re-treated with or without CpG ODN2216 or SLE sera for 0 hours, 24 hours, and 48 hours. After 24
hours of treatment, IFN-α production was measured using ELISA. The white and black arrows represent washing and treatment with CpG
ODN2216 or 30% SLE sera, respectively. The shaded areas indicate cultures undergoing stimulation. TLR9 tolerance is reversible over time. Puri-
fied pDCs were retreated with (c) CpG ODN2216 and (d) 30% SLE serum, as shown in panel b. IFN-α production and cell viability were measured
24 hours after the final stimulation. Each group was duplicated in every experiment and the values shown are the averages of duplicate samples.
Three independent experiments were performed using PBMCs from different individuals. One representative case is shown here and the other data
are shown in Additional file 1 (Supplementary Figure 5).
Available online />Page 9 of 11
(page number not for citation purposes)
(IFN-induced protein with tetratricopeptide repeats 1), IFI44
(IFN-induced protein 44), and PRKR (IFN-inducible double-
stranded RNA-dependent protein kinase). The expression of
all three genes was elevated in SLE PBMCs compared with
healthy PBMCs (Figure 5a–c). These data imply that SLE
PBMCs had been exposed to IFN-α to a greater degree, even
though IFN-α levels did not differ between the sera of SLE
patients and those of healthy control individuals.
Discussion
We demonstrated that TLR9-induced IFN-α production is
reduced in PBMCsPMBCs from SLE patients (Figure 1 and
Table 1). SLE patients exhibit ongoing IFN-α production, and
IFN-α serum levels are closely correlated with SLE disease
activity [8,9]. Although active SLE serum contains slightly
increased levels of IFN-α as compared with inactive SLE and
healthy control sera, there were no significant differences in
serum levels between total or inactive SLE patients and
healthy control individuals. Because some chronic SLE
patients had lymphophenia (data not shown), the number of
pDCs per blood unit was reduced in SLE patients, which
would affect the serum levels of IFN-α. The proportion of cir-
culating pDCs was slightly reduced in SLE patients, and IFN-
α production was markedly impaired after in vitro stimulation
with TLR9, regardless of disease activity (Figures 1b and 2b).
Although SLE patients exhibited a slight, nonsignificant
decrease in the proportion of pDCs to total PBMCs, we can-
not exclude the possibility that this decrease contributes to the
decrease in TLR-induced IFN-α production in SLE patients,
because the composition of pDC subtypes may differ between
SLE patients and healthy control individuals. There is evidence
that the Ly6C/Ly49Q pDC subtypes are effective producers
of IFN-α [33], and so further investigation is required to deter-
mine the composition of pDC subtypes in SLE patients. Other
studies have reported that SLE patients exhibit a reduced
number of BDCA-2 expressing pDCs, and that herpes virus
induced IFN-α production is decreased in SLE PBMCs [16];
furthermore, CpG-induced IFN-α secretion was significantly
reduced in monocytes and dendritic cells from SLE patients
[18]. However, CpG-induced IFN-α production was com-
pletely abolished in one-third of SLE patients, and the
decrease in IFN-α production was more marked than the
decrease in pDCs, indicating that a different mechanism is at
play.
SLE patients exhibited decreased numbers of circulating
pDCs (Figure 2b), which is consistent with the findings of a
number of other studies [16,23,34], but they also showed
increased numbers of pDCs in cutaneous lesions [35,36]. It
has been suggested that circulating pDCs are low in SLE
patients because this cell type is recruited from the blood to
peripheral tissues. However, the fate of circulating pDCs after
activation by DNA-containing immune complexes, which
present in the blood of SLE patients, is not yet clear. Our
results showed that significant numbers of pDCs are still
present in the PBMC fraction isolated from SLE patients. Fur-
thermore, we demonstrated that TLR-tolerant pDCs can
recover over time and restore IFN-α production (Figure 4c,d),
suggesting that pDCs in SLE patients are still present but
inactive as a result of TLR tolerance or exhaustion.
The marked decrease or abrogation of IFN-α production may
be explained by factors other than cell count. We noted that
CpG-induced IFN-α production in SLE PBMCs was inversely
correlated with SLE serum-stimulated cytokine production in
healthy PBMCs (Figure 3b). We also found that repeated or
chronic stimulation of TLR9 by appropriate ligands, such as
CpG ODN 2216 or DNA-containing immune complexes,
leads to TLR tolerance in pDCs. Although the mechanism of
TLR tolerance has not been fully explained, it is a well known
occurrence for cells that have been persistently stimulated
with TLR ligands to fail to respond to re-stimulation [31,37].
One possible mechanism is inhibition of TLR signaling via dys-
regulation of lipopolysaccharide-induced TLR4-MyD88 com-
Figure 5
Expression of IFN-α signature genes
Expression of IFN-α signature genes. Expression of the interferon (IFN)-α responsive genes (a) IFI44, (b) IFIT1, and (c) PRKR was assessed using
semiquantitative reverse transcription PCR. Peripheral blood mononuclear cells (PBMCs) were isolated from patients with systemic lupus erythema-
tosus (n = 27; 9 with active and 18 with inactive disease) and healthy control individuals (n = 17). The expression of each gene is presented relative
to β-actin expression. The solid bars represent the mean value for each experimental group. Statistical significance was analyzed using Student's t-
test.
Arthritis Research & Therapy Vol 10 No 2 Kwok et al.
Page 10 of 11
(page number not for citation purposes)
plex formation and IL-1 receptor-associated kinase (IRAK)-1
activation in endotoxin-tolerant cells [38]. Another possibility is
induction of genes that negatively regulate TLR signaling, such
as IRAK-M and suppressor of cytokine signaling (SOCS)-1
[31,37,39].
We found an increase in the expression of IFN-α signature
genes, indicating that SLE PBMCs have already been
exposed to IFN-α, which is mainly produced by pDCs (Figure
5). Although we did not check the expression levels of mole-
cules that inhibit the TLR signaling cascade in pDCs from SLE
patients, the SLE PBMCs showed elevated levels of IRAK-M
and MyD88s compared with the healthy PBMCs (Additional
file 1 [Supplementary Figure 3a,b]). Because inflammation
may also increase the expression of TLR signaling molecules,
we examined the expression of MyD88, which is a positive reg-
ulator of the TLR signaling pathway. MyD88 expression was
also slightly elevated in SLE PBMCs (Additional file 1 [Supple-
mentary Figure 3c]), although the ratio of MyD88s to MyD88
indicated that the negative regulator, MyD88s, was dominantly
expressed in the SLE PBMCs (Additional file 1
[Supplementary Figure 3d]). Although these data do not reveal
the functional status of the pDCs in SLE patients, they suggest
that the expression of negative regulators of TLR signaling may
be responsible for the development of TLR tolerance in the
PBMCs of SLE patients. In addition, dysfunctional IFN-α pro-
duction by SLE pDCs can be induced by other TLR ligands
that are found frequently in SLE sera, such as RNA-containing
immune complexes and heat shock proteins. However, our
investigation was hampered by the limited number of pDCs
that could be isolated from the available blood sample, and
thus the exact mechanism of TLR-9 tolerance remains to be
elucidated. Further investigation is required to clarify this
issue.
Another possible mechanism for TLR tolerance is that SLE
medications may affect the function of pDCs. Although no cor-
relations were observed among serum IFN-α levels, CpG-
induced IFN-α production in vitro, and the type and dosage of
medicines taken by SLE patients (data not shown), the
immuno-suppressors, such as cyclosporine and hydroxychlo-
roquine, can affect the function of pDCs. Hydroxychloroquine,
in particular, is a known inhibitor of TLR9 signaling; this drug
blocks the acidification of endosomes (phagosomes), which is
essential for TLR9 signaling [40]. To rule out the effect of
hydroxychloroquine, pDCs from healthy individuals were pre-
treated with 1 mmol/l hydroxychloroquine for 24 hours,
washed twice in serum-free medium, and then treated with
CpG ODN2216. After 24 hours of incubation, IFN-α produc-
tion decreased by up to 60% compared with non-pretreated
pDCs (data not shown). These findings indicate that the
residual amounts of hydroxychloroquine in pDCs from SLE
patients may contribute to TLR tolerance. Moreover, we can-
not exclude the potential influences of other medications on
pDC numbers and functions. However, not all SLE patients
were taking hydroxychloroquine, and the inhibition of TLR9 by
residual hydroxychloroquine cannot fully explain the abroga-
tion of IFN-α observed in one-third of SLE patients (Figure 1).
Conclusion
In the present study we demonstrated that circulating pDCs
are desensitized to TLR9 stimulation in patients with chronic
SLE. This desensitization is probably the result of persistent
stimulation by DNA-containing immune complexes, which are
a hallmark of SLE. In SLE patients, pDCs become tolerant to
TLR9 stimulation or exhausted in terms of IFN-α production.
These findings provide important insight into the pathogenesis
of SLE and the markedly increased incidence of certain viral
infections in SLE patients. In addition, our data indicate that
the role of IFN-α is different in developing SLE and in chronic
SLE.
Competing interests
The authors declare that they have no competing interests.
Authors' contributions
J-YL and S-KK carried out the experimental work, performed
the statistical analysis, and drafted the manuscript. Se-Ho P
analyzed and interpreted data. M-LC and S-YM performed sta-
tistical analysis. Sung-Hwan P provided patient's blood sam-
ples. Y-GC and H-YK designed and conceived of the study,
coordinated the project, and drafted the manuscript. All
authors read and approved the final manuscript.
Additional files
Acknowledgements
This work was supported by the SRC/ERC program of MOST/KOSEF
(grant R11-2002-098-08002-0).
References
1. Mok CC, Lau CS: Pathogenesis of systemic lupus
erythematosus. J Clin Pathol 2003, 56:481-490.
2. Ruiz-Irastorza G, Khamashta MA, Castellino G, Hughes GR: Sys-
temic lupus erythematosus. Lancet 2001, 357:1027-1032.
3. Ronnblom LE, Alm GV, Oberg KE: Autoimmunity after alpha-
interferon therapy for malignant carcinoid tumors. Ann Intern
Med 1991, 115:178-183.
4. Ronnblom LE, Alm GV, Oberg KE: Possible induction of sys-
temic lupus erythematosus by interferon-alpha treatment in a
patient with a malignant carcinoid tumour. J Intern Med 1990,
227:207-210.
5. Ehrenstein MR, McSweeney E, Swane M, Worman CP, Goldstone
AH, Isenberg DA: Appearance of anti-DNA antibodies in
The following Additional files are available online:
Additional file 1
Additional file 1 is a Word file that contains
Supplementary Figures.
See />supplementary/ar2382-S1.doc
Available online />Page 11 of 11
(page number not for citation purposes)
patients treated with interferon-alpha. Arthritis Rheum 1993,
36:279-280.
6. Kalkner KM, Ronnblom L, Karlsson Parra AK, Bengtsson M, Ols-
son Y, Oberg K: Antibodies against double-stranded DNA and
development of polymyositis during treatment with interferon.
QJM 1998, 91:393-399.
7. Raanani P, Ben-Bassat I: Immune-mediated complications dur-
ing interferon therapy in hematological patients. Acta
Haematol 2002, 107:133-144.
8. Ytterberg SR, Schnitzer TJ: Serum interferon levels in patients
with systemic lupus erythematosus. Arthritis Rheum 1982,
25:401-406.
9. Bengtsson AA, Sturfelt G, Truedsson L, Blomberg J, Alm G, Vallin
H, Ronnblom L: Activation of type I interferon system in sys-
temic lupus erythematosus correlates with disease activity but
not with antiretroviral antibodies. Lupus 2000, 9:664-671.
10. Cella M, Jarrossay D, Facchetti F, Alebardi O, Nakajima H, Lanza-
vecchia A, Colonna M: Plasmacytoid monocytes migrate to
inflamed lymph nodes and produce large amounts of type I
interferon. Nat Med 1999, 5:919-923.
11. Siegal FP, Kadowaki N, Shodell M, Fitzgerald-Bocarsly PA, Shah
K, Ho S, Antonenko S, Liu YJ: The nature of the principal type 1
interferon-producing cells in human blood. Science 1999,
284:1835-1837.
12. Colonna M, Trinchieri G, Liu YJ: Plasmacytoid dendritic cells in
immunity. Nat Immunol 2004, 5:1219-1226.
13. Ito T, Wang YH, Liu YJ: Plasmacytoid dendritic cell precursors/
type I interferon-producing cells sense viral infection by Toll-
like receptor (TLR) 7 and TLR9. Springer Semin Immunopathol
2005, 26:221-229.
14. Lovgren T, Eloranta ML, Bave U, Alm GV, Ronnblom L: Induction
of interferon-alpha production in plasmacytoid dendritic cells
by immune complexes containing nucleic acid released by
necrotic or late apoptotic cells and lupus IgG. Arthritis Rheum
2004, 50:1861-1872.
15. Means TK, Latz E, Hayashi F, Murali MR, Golenbock DT, Luster
AD: Human lupus autoantibody-DNA complexes activate DCs
through cooperation of CD32 and TLR9. J Clin Invest 2005,
115:407-417.
16. Blomberg S, Eloranta ML, Magnusson M, Alm GV, Ronnblom L:
Expression of the markers BDCA-2 and BDCA-4 and produc-
tion of interferon-alpha by plasmacytoid dendritic cells in sys-
temic lupus erythematosus.
Arthritis Rheum 2003,
48:2524-2532.
17. Cederblad B, Blomberg S, Vallin H, Perers A, Alm GV, Ronnblom
L: Patients with systemic lupus erythematosus have reduced
numbers of circulating natural interferon-alpha-producing
cells. J Autoimmun 1998, 11:465-470.
18. Zeuner RA, Klinman DM, Illei G, Yarboro C, Ishii KJ, Gursel M, Ver-
thelyi D: Response of peripheral blood mononuclear cells from
lupus patients to stimulation by CpG oligodeoxynucleotides.
Rheumatology (Oxford) 2003, 42:563-569.
19. Blanco P, Palucka AK, Gill M, Pascual V, Banchereau J: Induction
of dendritic cell differentiation by IFN-alpha in systemic lupus
erythematosus. Science 2001, 294:1540-1543.
20. Krug A, Rothenfusser S, Hornung V, Jahrsdorfer B, Blackwell S,
Ballas ZK, Endres S, Krieg AM, Hartmann G: Identification of
CpG oligonucleotide sequences with high induction of IFN-
alpha/beta in plasmacytoid dendritic cells. Eur J Immunol
2001, 31:2154-2163.
21. Hochberg MC: Updating the American College of Rheumatol-
ogy revised criteria for the classification of systemic lupus
erythematosus. Arthritis Rheum 1997, 40:1725.
22. Bombardier C, Gladman DD, Urowitz MB, Caron D, Chang CH:
Derivation of the SLEDAI. A disease activity index for lupus
patients. The Committee on Prognosis Studies in SLE. Arthritis
Rheum 1992, 35:630-640.
23. Migita K, Miyashita T, Maeda Y, Kimura H, Nakamura M, Yatsuhashi
H, Ishibashi H, Eguchi K: Reduced blood BDCA-2
+
(lymphoid)
and CD11c
+
(myeloid) dendritic cells in systemic lupus
erythematosus. Clin Exp Immunol 2005, 142:84-91.
24. Migita K, Miyashita T, Maeda Y, Nakamura M, Yatsuhashi H, Kimura
H, Ishibashi H, Eguchi K: Toll-like receptor expression in lupus
peripheral blood mononuclear cells. J Rheumatol 2007,
34:493-500.
25. Dalpke AH, Lehner MD, Hartung T, Heeg K: Differential effects of
CpG-DNA in Toll-like receptor-2/-4/-9 tolerance and cross-
tolerance. Immunology 2005, 116:203-212.
26. Lotz M, Gutle D, Walther S, Menard S, Bogdan C, Hornef MW:
Postnatal acquisition of endotoxin tolerance in intestinal epi-
thelial cells. J Exp Med 2006, 203:973-984.
27. Parker LC, Jones EC, Prince LR, Dower SK, Whyte MK, Sabroe I:
Endotoxin tolerance induces selective alterations in neutrophil
function. J Leukoc Biol 2005, 78:1301-1305.
28. Perry JA, Olver CS, Burnett RC, Avery AC: Cutting edge: the
acquisition of TLR tolerance during malaria infection impacts
T cell activation. J Immunol 2005, 174:5921-5925.
29. Grouard G, Rissoan MC, Filgueira L, Durand I, Banchereau J, Liu
YJ: The enigmatic plasmacytoid T cells develop into dendritic
cells with interleukin (IL)-3 and CD40-ligand. J Exp Med 1997,
185:1101-1111.
30. Ito T, Kanzler H, Duramad O, Cao W, Liu YJ: Specialization, kinet-
ics, and repertoire of type 1 interferon responses by human
plasmacytoid predendritic cells. Blood 2006, 107:2423-2431.
31. Fan H, Cook JA: Molecular mechanisms of endotoxin tolerance.
J Endotoxin Res 2004, 10:71-84.
32. Hua J, Kirou K, Lee C, Crow MK: Functional assay of type I inter-
feron in systemic lupus erythematosus plasma and associa-
tion with anti-RNA binding protein autoantibodies. Arthritis
Rheum 2006, 54:1906-1916.
33. Vremec D, O'Keeffe M, Hochrein H, Fuchsberger M, Caminschi I,
Lahoud M, Shortman K: Production of interferons by dendritic
cells, plasmacytoid cells, natural killer cells, and interferon-
producing killer dendritic cells. Blood 2007, 109:1165-1173.
34. Vallin H, Blomberg S, Alm GV, Cederblad B, Ronnblom L: Patients
with systemic lupus erythematosus (SLE) have a circulating
inducer of interferon-alpha (IFN-alpha) production acting on
leucocytes resembling immature dendritic cells. Clin Exp
Immunol 1999, 115:196-202.
35. Blomberg S, Eloranta ML, Cederblad B, Nordlin K, Alm GV, Ron-
nblom L: Presence of cutaneous interferon-alpha producing
cells in patients with systemic lupus erythematosus. Lupus
2001, 10:484-490.
36. Farkas L, Beiske K, Lund-Johansen F, Brandtzaeg P, Jahnsen FL:
Plasmacytoid dendritic cells (natural interferon- alpha/beta-
producing cells) accumulate in cutaneous lupus erythemato-
sus lesions. Am J Pathol 2001, 159:237-243.
37. Akira S, Takeda K: Functions of toll-like receptors: lessons from
KO mice. C R Biol 2004, 327:581-589.
38. Medvedev AE, Lentschat A, Wahl LM, Golenbock DT, Vogel SN:
Dysregulation of LPS-induced Toll-like receptor 4-MyD88
complex formation and IL-1 receptor-associated kinase 1 acti-
vation in endotoxin-tolerant cells. J Immunol 2002,
169:5209-5216.
39. Escoll P, del Fresno C, Garcia L, Valles G, Lendinez MJ, Arnalich
F, Lopez-Collazo E: Rapid up-regulation of IRAK-M expression
following a second endotoxin challenge in human monocytes
and in monocytes isolated from septic patients. Biochem Bio-
phys Res Commun 2003, 311:465-472.
40. Rutz M, Metzger J, Gellert T, Luppa P, Lipford GB, Wagner H,
Bauer S: Toll-like receptor 9 binds single-stranded CpG-DNA
in a sequence- and pH-dependent manner. Eur J Immunol
2004, 34:2541-2550.