EARTH SCIENCES - Notable Research and Discoveries Part 7 pdf
Bạn đang xem bản rút gọn của tài liệu. Xem và tải ngay bản đầy đủ của tài liệu tại đây (614.14 KB, 24 trang )
earth ScienceS
124
1890s Boise, Idaho, develops the rst geothermal district
heating system, in which water from hot springs is
piped into some of the city’s buildings.
1904 Working in Larderello in central Italy, the Italian
chemist and inventor Piero Ginori Conti (1865–
1939) builds the rst electric generator running
from geothermal power.
1930 Iceland begins the widespread use of geothermal
energy to heat buildings.
1960 Pacic Gas and Electric Company opens the rst
geothermal power station in the United States at
e Geysers in California.
1970s e U.S. DOE initiates a series of geothermal re-
search projects in the Jemez Mountains of New
Mexico and establishes a testing facility at Fenton
Hill, New Mexico.
1980s Geothermal power stations appear in Hawaii, Ne-
vada, and Utah.
2006 An interdisciplinary panel of scientists and engi-
neers, organized by MIT, issues a report, e Fu-
ture of Geothermal Energy, which recommends
investment in enhanced geothermal systems.
Bruce D. Green and R. Gerald Nix of NREL, issue a
report proposing research on geothermal systems,
based on the ndings of a workshop in Golden,
Colorado, on May 16, 2006.
2008 An Australian company Geodynamics, Ltd., com-
pletes drilling a well at Cooper Basin in South Aus-
tralia and begins
development of a geothermal pow-
er station using hot fractured rock technology.
FOS_Earth Science_DC.indd 124 2/8/10 10:59:03 AM
125
FuRtHER RESouRCES
Print and Internet
Boyle, Godfrey, ed. Renewable Energy, 2nd ed. Oxford: Oxford Univer-
sity Press, 2004. Aer an initial chapter introducing renewable en-
ergy, the book describes solar energy and technologies, energy from
biological sources, hydroelectricity, tidal energy, wind energy, wave
energy, and geothermal energy.
California Energy Commission. “Geothermal Energy.” Available on
-
line. URL:
Accessed May 4, 2009. California generates more electricity from
geothermal energy than any other state. is Web page, which is
one of the chapters in the California Energy Commission publica
-
tion “e Energy Story,” contains a concise description of geother-
mal energy.
Deseret News. “Geothermal Energy Development Gathers Steam.” Oc-
tober 7, 2008. Available online. URL: licutilities.
utah.gov/news/geothermalenergydevelopmentgatherssteam.pdf.
Accessed May 4, 2009. is short article sounds an optimistic note
on geothermal energy.
Geothermal Education Oce. “Geothermal Energy.” Available online.
URL: Accessed May 4, 2009. e Geo
-
thermal Education Oce, a nonprot organization in California to
promote awareness of geothermal resources, oers a lot of information
on the Web. Topics include geothermal facts and a glossary of terms,
a slide show, general information about energy resources, and maps
showing the worldwide use and application of geothermal energy.
Gibilisco, Stan.
Alternative Energy Demystied. New York: McGraw-
Hill, 2007. In addition
to explaining the concept of energy and
energy
transformations, this book covers a broad range of energy
technologies. e author’s classication of geothermal power as an
“exotic” means of electricity generation is perhaps not the best word
choice, but readers can compare and contrast a variety of fossil fuel
and alternative energy sources.
Google. “Google.org Invests More an $10 Million in Breakthrough
Geothermal Energy Technology.” News release, August 19, 2008.
Geothermal Energy—a Furnace beneath the Soil
FOS_Earth Science_DC.indd 125 2/8/10 10:59:03 AM
earth ScienceS
126
Available online. URL: />rel/20080819_egs.html. Accessed May 4, 2009. Google announces a
signicant investment in geothermal energy.
Green, Bruce D., and R. Gerald Nix. “Geothermal—the Energy under
Our Feet.” Available online. URL: />geothermal/pdfs/40665.pdf. Accessed May 4, 2009. is technical
report is based on a workshop held at Golden, Colorado, on May
16, 2006, sponsored by NREL. Web users with slow download rates
should be warned that the size of this le is about 2.8 megabytes.
Kennedy, B. Mack, and Matthijs C. van Soest. “Flow of Mantle Fluids
through the Ductile Lower Crust: Helium Isotope Trends.”
Science
318 (November 30, 2007): 1,433–1,436. e researchers report on
their measurements of helium isotopes ratios in springs, wells, and
vents in a broad area covering western North America.
Massachusetts Institute of Technology. “e Future of Geothermal
Energy.” Available online. URL: />-
cations/future_of_geothermal_energy.pdf. Accessed May 4, 2009.
MIT’s geothermal energy report that was discussed in this chapter
is available on the Web. But Web users with slow download rates
should be warned that the size of this le is about 14 megabytes.
ScienceDaily. “A Step toward Inexpensive Geothermal Energy.”
News release, March 15, 2007. Available online. URL: http://www.
sciencedaily.com/releases/2007/03/070313110634.htm. Accessed
May 4, 2009. Dina Lopez, a researcher at Ohio University, reports
her
ndings on geothermal stations in El Salvador and ways to im
-
prove eciency.
Smil, Vaclav. Energies. Cambridge, Mass.: MIT Press, 1999. is book
oers a general view of energy, describing its many forms, its scien-
tic properties, and the manner in which it is used.
Swissinfo.ch. “Man-Made Tremor Shakes Basel.” December 9, 2006.
Available online. URL: />science_technology/Man_made_tremor_shakes_Basel.html?siteSec
t=514&sid=7334248&cKey=116583965 8000&ty=st. Accessed May
4, 2009. Geothermal drilling is suspected to play a role in the minor
earthquake that struck Basel, Switzerland, on December 8, 2006.
Union of Concerned Scientists. “How Geothermal Energy Works.” Avail-
able online. URL: />FOS_Earth Science_DC.indd 126 2/8/10 10:59:03 AM
127
and_impacts/energy_technologies/how-geothermal-energy-
works.html. Accessed May 4, 2009. is introduction to geothermal
energy contains three sections: the geothermal resource, how geo
-
thermal energy is captured, and the future of geothermal energy.
United States Department of Energy. “Geothermal Technologies
Program.” Available online. URL: />geothermal/. Accessed May 4, 2009. e Web resource describing
DOE’s program to enhance geothermal applications includes basic
information, maps, photographs, data on current exploration and
research, and a brief history of the subject.
Geothermal Energy—a Furnace beneath the Soil
FOS_Earth Science_DC.indd 127 2/8/10 10:59:04 AM
128
5
WATER
MANAGEMENT—
CONSERVING AN
ESSENTIAL RESOURCE
Water management is not a new problem. Ancient Rome was a bustling,
crowded city, housing more than a million people. A city this size is large
even by modern standards, and for the ancient world, a city with a million
inhabitants presented numerous sanitary and engineering challenges. One
of the most important concerns was freshwater. e Tiber, a river that
ows through Rome, supplied plenty of water during the city’s early years,
but as the population grew, the Tiber became inadequate as well as pollut-
ed. Wells and rainwater were also insu cient, so the Romans had to carry
water into the city from springs and other distant sources. To accomplish
this task e ciently, Roman engineers began building an ingenious system
of long channels or conduits—aqueducts—in 312 ...
e idea behind an aqueduct is simple. An aqueduct is made of
stone or concrete and has a gentle slope, so that water in the channel
ows downhill from the source—a spring on a hill, perhaps—all the way
to the city. But engineering these aqueducts required considerable skill,
for the channel must maintain its slope as it winds its way along the
countryside. e Romans used natural slopes such as a hillside wher-
ever possible and built arched bridges when necessary. A total of 11
FOS_Earth Science_DC.indd 128 2/8/10 10:59:04 AM
128
129
aqueducts eventually served the
city, the longest having a length of
about 60 miles (37 km).
Freshwater continues to be a
concern for cities today. Humans
need roughly a half gallon (1.9
L) of water a day to survive, and
most people use a lot more than
that for washing, sanitation, and
other applications. But according
to the World Health Organization
(WHO), the number of people in
2002 who did not have access to
safe drinking water exceeded 1
billion—about 17 percent of the
world’s population—and thou-
sands of people die every day from
waterborne illnesses such as bacte-
rial infections. A growing popula-
tion will put even more pressure on
scarce water resources. A United
Nations (UN) report, “Water for
People, Water for Life,” issued in
2003, predicts about half of the world’s population will experience sig-
ni cant water shortages or other major problems in the next 50 years:
“Critical challenges lie ahead in coping with progressive water shortag-
es and water pollution. By the middle of this century, at worst 7 billion
people in sixty countries will be water-scarce, at best 2 billion people in
forty-eight countries.”
Although Americans generally have access to plenty of potable wa-
ter, shortages caused by a drought can occur in various cities and states.
In the 1930s, a severe drought struck the lower Midwest, parching the
soil and resulting in the dust bowl, as the wind blew clouds of sti ing
dust throughout the region. Because freshwater is essential to life, peo-
ple in all countries should be aware of issues concerning shortages of
clean, drinkable water. One of the most important goals of Earth sci-
ence is to understand the dynamics and distribution of this life-giving
resource and to nd ways of alleviating present and future shortages.
5
Crop irrigation is often
essential for adequate yields.
(Don Bayley/iStockphoto)
Water Management—Conserving an Essential Resource
FOS_Earth Science_DC.indd 129 2/8/10 10:59:05 AM
earth ScienceS
130
As geologists gain a more complete understanding of Earth and its
water distribution, locating and exploiting water resources such as un-
derground sources will become easier and cheaper. But there is also an
urgent need to understand and predict rainfall variations and climate
patterns so that events such as droughts do not catch people o guard.
An extra complication is that the world’s climate has been changing re
-
cently, with temperatures rising about 1.3°F (0.74°C) on average in the
last century, and this change will probably have a strong eect on the
planet’s water circulation. Studying any phenomenon on a scale as large
as an entire planet is challenging because so many factors come into
play. Coping with this complexity is one of the important frontiers of
Earth science. is chapter discusses how researchers are learning more
about the ways in which water cycles through the environment and how
to use that knowledge for improved water management.
IntRoduCtIon
Water is a compound made of two parts hydrogen (H) and one part oxy-
gen (O). e chemical formula is H
2
O. e bond between the hydrogen
atoms and the oxygen atom is covalent, which means that bonded atoms
share electrons. Oxygen’s nucleus pulls on the shared electrons with a
little more strength than hydrogen’s nucleus, so the electrons tend to be
closer to the oxygen atom than the hydrogen atoms. is unequal charge
distribution means that a water molecule is not electrically neutral, so it
attracts other charges. Water molecules tend to stick together because of
this attraction and also have the ability to pry apart compounds such as
salt, dissolving them—water is an excellent solvent.
e ability to dissolve many kinds of substances makes water a
good choice for cleaning and washing purposes. For similar reasons,
water is an eective medium for living organisms, dissolving and car
-
rying nutrients and other required molecules. Water comprises about
60 percent of the weight of an average person. Life on Earth evolved in
the seas, which are salty because of dissolved substances such as sodium
and chloride ions (charged atoms that result when sodium chloride dis
-
solves in water). Living organisms retain a portion of this environment
within them—certain uids in the body of humans and other organ
-
isms are chemically similar to the ocean, containing large quantities of
sodium and chloride ions.
FOS_Earth Science_DC.indd 130 2/8/10 10:59:05 AM
131
e body is constantly losing H
2
O, and this water must be replaced.
People must drink freshwater instead of salt water in order to maintain
the delicate balance of ions and other substances in the body. (Certain
marine mammals such as seals can drink salt water, but, unlike humans,
they have the ability to excrete the excess ions.) Potable water must also
be free of disease-causing microorganisms that can invade intestinal
tracts and result in serious problems in digestion and elimination.
Although people can survive with only a half gallon (1.9 L) per
day, many people typically use more than this for bathing and washing.
Businesses also consume a large amount of water during cleaning and
other operations. Another major use of water is crop irrigation, which
is essential in drier parts of the world. About a third of the water supply
in the United States gets used in farming, and this percentage is larger
in states such as California and Texas.
Earth is the only planet in the solar system with an abundance of
H
2
O in three phases—as a gas (water vapor), liquid (water), and solid
(ice). About 70 percent of the planet’s surface is water, and there is also
much water beneath the surface. e total volume of water on Earth is
326,000,000 cubic miles (1,360,000,000 km
3
). ese units are large—a
cubic mile (4.1 km
3
) is a cube having one mile (1.6 km) per side—and
millions of them add up to a great deal of water, enough to form a body
of water the area of the United States with a depth of 90 miles (145 km)!
Oceans and seas contain about 96 percent of this water, so only about 4
percent of Earth’s water is fresh, much of which is locked up in glaciers
and polar ice.
e total amount of water on Earth does not change much—some
molecules escape Earth’s gravity, and some get broken down into their
constituent elements, but new water arises from chemical reactions or
is brought by comet impacts. e overall quantity can change from time
to time but not by a lot. Water does move around a lot, though, and
change phases.
Where did all this water come from in the rst place? Geologists are
not yet sure of the answer. Some of Earth’s water was probably mixed in
with the material that originally formed the planet. Much of this water
would have been a component of aggregates and minerals; heat given
o during the planet’s creation melted the material and freed the water,
which rose to the surface through volcanic activity. But some of Earth’s
water may have arrived from space. For example, the impacts of comets,
Water Management—Conserving an Essential Resource
FOS_Earth Science_DC.indd 131 2/8/10 10:59:05 AM
earth ScienceS
132
which mostly consist of ice and frozen gases such as carbon dioxide,
may have brought some additional water to the planet. In either case,
the water is here to stay—little of it escapes or gets broken down.
But Earth’s water is not distributed equally.
Hydrology is the study
of the properties, distribution, and circulation of water. (Hydro comes
from a Greek term meaning “water.”) Some regions are dry, such as the
Sahara in Africa, parts of which receive an average of only about three
inches (7.5 cm) of rainfall a year. Other regions are wet, such as rain
forests around the Amazon River in South America, parts of which av
-
erage about 200 inches (500 cm) of rainfall a year. Rainfall can also vary
widely in the same region at dierent times of the year—some regions,
such as parts of Asia, experience a dry season and an extremely rainy
one. And rainfall usually varies considerably in the same region from
year to year.
As a result of variations in rainfall, people throughout history have
made concerted eorts to stabilize their water supply. Cities have oen
been founded near lakes or rivers, which have also provided useful means
of transportation. Springs can
also be an important source of water. When
none of these sources suce or they become too polluted, citizens must
turn to other strategies, as the Romans did when they built aqueducts.
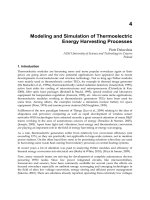
Rainfall in the United States for the first eight months of 2007—blue
and green indicate a higher than average rainfall whereas yellow and
orange indicate less than average. The Midwest was more wet than
usual in this period. (NASA image by Hal Pierce [SSAI/NASA GSFC])
FOS_Earth Science_DC.indd 132 2/8/10 10:59:06 AM
133
Traditional means of increasing the water supply include piping
water from the surrounding area, digging wells, and blocking rivers
with dams to create lakes. While eective, these methods have become
increasingly costly because expanding populations require ever larger
sources, oen at great distances from cities. ere are also environmen
-
tal concerns, such as when dams impede the ow of rivers and ood
important wildlife habitats.
tHE WatER CyClE
A fundamental concept of hydrology is the water cycle. Although the
total amount of water on the planet is relatively constant, water does
not stay in one place, or in one form, but cycles between various res
-
ervoirs—sites at which water is stored. (e largest water reservoirs
on Earth are the oceans.) Water moves from reservoir to reservoir; for
example, molecules of water evaporate, leaving the liquid phase to be
-
come water vapor, and then condense, the opposite process by which
gaseous molecules become a liquid. Water vapor, being a gas, is not vis
-
ible, but condensation oen occurs around small particles suspended
in the atmosphere, forming clouds that are visible because of the water
droplets or ice crystals, if the water droplets are cold enough to freeze.
is condensed water
eventually falls
as
precipitation—rain, snow, hail,
or sleet. In this manner, water molecules cycle from surface water to
atmospheric vapor to precipitation, at a rate that varies widely from
molecule to molecule. Some molecules may complete a cycle in a day or
two, others may take years.
e driving force of the water cycle is the Sun. Sunlight heats the
water surface, giving H
2
O molecules sucient energy to escape into
the air. (e water molecules escape, but most of the other substances,
such as salt in the ocean, stays behind.) is water vapor joins the at
-
mosphere, eventually to condense into water droplets of around 0.0004
inches (0.001 cm) in diameter, forming clouds. Clouds are white be
-
cause these droplets reect all of the wavelengths of sunlight; none of
the colors predominate, so the reection is white. ese tiny droplets
can remain suspended in the air, carried by winds, until they grow much
larger and fall to the ground as precipitation. Clouds become dark when
they thicken and block the sunlight—these are oen storm clouds that
cause a lot of precipitation.
Water Management—Conserving an Essential Resource
FOS_Earth Science_DC.indd 133 2/8/10 10:59:06 AM
earth ScienceS
134
Many people would like to control rainfall—for example, farmers
whose crops need watering. Although some engineers try to seed clouds
by dispersing tiny particles on which water can condense, this can only
FOS_Earth Science_DC.indd 134 2/8/10 10:59:09 AM
135
work if there is water vapor in the air. e amount of water vapor in the air
is called relative humidity, given as a percentage of the maximum amount
of water vapor that air can hold. is maximum depends on the air’s tem-
perature—warm air can hold more than cold air. If the temperature is
70°F (21°C), for example, and the relative humidity is 60 percent, then the
air is holding six-tenths the maximum at this temperature. Highly humid
conditions feel muggy. During the night and early morning, as tempera
-
tures cool, excess water vapor in the air condenses, forming dew.
Much of the water cycle takes place as water evaporates from the
warm, tropical regions of the oceans. is warm, humid air moves in
-
land, cooling as it encounters colder territory, particularly if it has to
rise over mountains. Cool air can hold less water, resulting in precipita
-
tion. e process is similar to a sponge—warm air absorbs water, and
cooler temperatures wring it out.
Precipitation falling on the ground meets one of two dierent
fates. Most of this precipitation is water or if ice or snow eventually
melts and becomes water. Some of the rain or snowmelt ows along
the ground or
in the gutters of cities, eventually reaching a stream or
river. Rivers ow into oceans, delivering the water back to where it
started for another cycle. e rainwater that ows over the surface is
known as runo. (In addition to contributing to the water cycle, run
-
ning water also plays an important role in shaping the surface of the
planet through erosion and weathering.) Water that accumulates in
ponds and lakes stays around for a while, although molecules on the
surface of these small bodies of water evaporate and continue to par
-
ticipate in the cycle. e gure opposite illustrates the water cycle.
e other possibility is that the water will be absorbed into the
ground in a process known as inltration. In this process, water mol
-
ecules seep between soil particles or through tiny pores or cracks in
rocks. About 1 percent of Earth’s water supply exists below the ground,
constituting a quarter of the planet’s freshwater; only a tiny fraction of
freshwater remains on the surface in the form of lakes and rivers.
(opposite page) Water molecules evaporate from the oceans and other
bodies of water and then fall as precipitation. The cycle starts anew as
water drains into lakes, rivers, and seas.
Water Management—Conserving an Essential Resource
FOS_Earth Science_DC.indd 135 2/8/10 10:59:09 AM
earth ScienceS
136
Some cities draw at least a portion of their freshwater from nearby
rivers or lakes. e faucets of people in Philadelphia, Pennsylvania, for
instance, deliver ltered and treated water taken from the Schuylkill
Aquifers—Underground Water Sources
Water can fl ow underground, as it does aboveground, but not
nearly as fast since it must seep through soil or rocks except
in rare cases when a tunnel or cave is present. Many under-
ground regions that have a lot of pores or crevices allow at least
some fl ow, so groundwater can seep into a well to replace some
of the water that has been pumped out. But if water is pumped
out faster than it seeps in, the water level drops. This drop may
be enhanced by a long dry spell, decreasing the amount of avail-
able groundwater. Even if the water table is close to the surface
in the region of the well, not enough water can seep in fast
enough to replace the large quantity that has been pumped out.
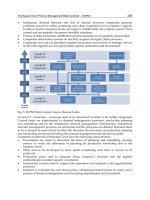
The well depresses the water table in the immediate vicinity, as
shown in the following fi gure, and can go dry.
Excessive pumping can also cause the surface around the
well to collapse. The reason for this collapse is the loss of water
in the pores and crevices, which creates empty spaces under
the ground. As sediment falls into these spaces, the volume
decreases—the material is more compact—and the surface
becomes lower. If the water loss opens up a signifi cant amount
of space, the material may not be able to support the weight of
the soil and rocks above. The result is a sinkhole or fi ssure.
When too much groundwater is pumped from a larger
area, such as around a large city, the land can subside—shift
downward. Subsidence is a big problem in cities that pump
groundwater to satisfy a substantial portion of their water
needs. In Mexico City, land subsidence caused by groundwater
withdrawal has resulted in warped roads and damaged build-
ings and has induced a slight lean in the beautiful Metropolitan
Cathedral.
FOS_Earth Science_DC.indd 136 2/8/10 10:59:09 AM
137
River and the Delaware River. Other communities rely on ground-
water, which is pumped from wells. For example, the majority of the
water supply in Mexico City, Mexico, comes from groundwater. An
When users pump a well faster than nearby sources can replenish
it, the water level drops around the well, forming a cone in which
the water table is depressed.
Water Management—Conserving an Essential Resource
FOS_Earth Science_DC.indd 137 2/8/10 10:59:12 AM
earth ScienceS
138
underground area that has enough water to supply a well is known as
an aquifer.
ere is a lot of water underground, but the big question is how far
well drillers need to go before they strike pay dirt (which is wet, in this
case). Gravity pulls down any water that inltrates the ground. Soil or
rock just beneath the surface is usually dry (except on a rainy day) and
is known as the unsaturated zone or
vadose zone. At some point below
this zone, water lls every pore and crevice, saturating the ground with
water—this is known as the
saturated zone. (But this zone only reaches
a short distance below the surface. e pressure of deeper depths is too
great for much water to collect in pores.) e separation between these
two zones is called the groundwater table or
water table; any hole with
a depth below the water table will ll with water creeping in from the
saturated zone, up to the level of the water table. In a manner of speak
-
ing, the water table is the surface of the underground water.
How far down is the water table? e water table tends to be deeper
below hills than
valleys, but to a large extent the depth depends on how
much rainwater has recently inltrated the surface. Warm, wet areas,
such as parts of Florida in the United States, have a water table only
about three feet (0.9 m) down. (If the water table reaches the surface, a
spring appears.) But water tables in the desert are many times this far
beneath the surface. Water is nearly always present if a driller is willing
to dig far enough, but deep drilling is extremely expensive and pumping
the water to the surface becomes an issue as well. In most climates, well
diggers succeed when they nd an area consisting of porous rock such
as sandstone, which allows a lot of water to seep through and collect
underneath.
Aquifers are vital to many communities, yet when people draw too
much water too quickly from an underground source, it might not be
replaced. As discussed in the sidebar on page 136, the rate that water is
discharged or exits the aquifer must be balanced by the rate at which
water recharges or ows into it. Otherwise, the well runs dry.
Groundwater is replenished by inltration, but aquifer overuse due
to increased demand causes water levels to fall dangerously low. All
reservoirs—groundwater,
lakes and rivers, glaciers and polar ice, and
the oceans—have inows and outows that, when balanced, maintain
a constant level. Imbalances arising from excessive withdrawal, sea
-
sonal variations, or climate change will exacerbate water scarcity and
FOS_Earth Science_DC.indd 138 2/8/10 10:59:12 AM
139
shortages. And although the planet’s total amount of water is rough-
ly constant—almost all water eventually returns to some reservoir or
another—a signicant portion may become polluted or end up in an
inaccessible location, magnifying the cost and diculty of quenching
civilization’s thirst.
FIndInG and uSInG FRESHWatER
Pollution has always been a serious threat to the freshwater supply of large
cities. Waste disposal becomes a problem under crowded conditions, and
sewage oen nds its way into the city’s streams, rivers, and groundwater.
Bacterial contamination causes serious and deadly diseases such as chol
-
era, which can spread rapidly. Civilizations as far back as ancient Rome
have had to invest considerable time and expense into nding solutions
to their water problems, which, in the case of the Romans, involved con
-
structing a number of aqueducts to bring water into the city.
Many communities tackle the pollution problem by carefully rout
-
ing their sanitation systems and by building sophisticated water puri-
cation and treatment systems. Water facilities disinfect and lter water
that is piped into homes and businesses, removing most of the contami
-
nants. But communities and villages in undeveloped areas of the world
lack access to treated and puried
water. A complete absence of water is
not necessarily the problem in these communities—the absence of safe
drinking water is what causes most of the trouble.
But sometimes rivers do run low and wells do go dry. ese water
shortages oen occur during droughts, which constitute another major
threat to water supplies. As described in the next section, prolonged dry
spells are dicult to predict and can come without warning, catching
ocials by surprise and preventing the stockpiling of additional quanti
-
ties of water. Droughts are common in arid regions such as deserts, but
can strike anywhere. e following sidebar discusses the drought and
its aereects that caused havoc in a large section of the United States
in the 1930s.
Digging wells to reach new sources of water is oen needed, but
nding the best place to dig is not simple. One way to nd out is to
guess—well diggers have more success in rocks like sandstone, so this
is a good place to start—and then drill a test hole. But guessing wrong
too oen is expensive.
Water Management—Conserving an Essential Resource
FOS_Earth Science_DC.indd 139 2/8/10 10:59:12 AM
earth ScienceS
140
Technology may soon be able to take some of the guesswork out
of the process. Radar creates images of distant objects by bouncing
electromagnetic radiation o them. Ground-penetrating radar (GPR)
is a tool to image subsurface regions in a similar process, since proper-
ties of the soil, including its water content, a ect the transmission of
electromagnetic radiation. When a lot of water is present in the soil,
the water tends to be more prominent than soil in determining the
propagation of radiation. GPR has been used in oil exploration and
The Dust Bowl of the 1930s
The United States fell on hard times in the 1930s after
the stock market crashed and the Great Depression con-
tracted the economy, leading to joblessness and poverty for
millions. For the lower Midwest states, a second disaster
struck at the same time—the dust bowl. A severe drought
beginning in 1931 parched millions of acres of land in Texas,
Oklahoma, Colorado, Kansas, and New Mexico. The surface
turned to dust, and winds kicked up the dry soil into furious
dust storms that blanketed much of the region in dark, gritty
clouds. People who got caught outside in these storms had
to grope their way home, even if they were close, since no
light could penetrate the murk. Chickens came home for
the night—in the middle of the day. On the PBS program
Surviving the Dust Bowl, which aired in 1998, an eyewitness
described the experience: “It kept getting darker and darker.
And the old house is just a-vibrating like it was going to blow
away. And I started trying to see my hand. And I kept bring-
ing my hand up closer and closer and closer and closer. And
I fi nally touched the end of my nose and I still couldn’t see my
hand. That’s how black it was.”
Bad farming practices contributed to the problem. In
the years leading up to the 1930s, farmers had used the
FOS_Earth Science_DC.indd 140 2/8/10 10:59:13 AM
141
glacier measurements, and scientists such as soil surveyors in Fairfax
County, Virginia, have used the technique to gauge soil layers and the
location of water tables.
e diculty with GPR is that it provides a clear image only under
certain conditions and at shallow depths. Data from this technique is
complicated and requires a great deal of analysis before the signals can
be correctly interpreted. At best, the tool is a suggestive guide, and if the
water table is deep, water-seekers can glean little useful information.
land extensively with little thought of conservation. Repeated
use of the same land for the same crop depleted the soil
and led to serious erosion. Widespread plowing killed grass
that trapped moisture and normally kept soil from blowing
away. As a result, the drought parched the soil and the wind
easily lifted it away, generating massive dust storms that
people called Black Blizzard or Black Roller. The term dust
bowl began to be used for the area after April 14, 1935,
known as Black Sunday, which featured a large number of
dust storms.
The consequences of the dust bowl have been long-
lasting. People in the affected region suffered considerable
health problems and economic hardships, and many people
moved away. The migration out of the dust bowl states was
the largest mass movement of people in U.S. history, with
several million Okies loading up their trucks and heading for
greener lands. (Although only about 20 percent of these
migrants were from Oklahoma, the term Okie was gener-
ally applied.) Due in part to the depression, many migrants
had trouble finding jobs, as dramatized in John Steinbeck’s
1939 novel, Grapes of Wrath. One of the few beneficial
aspects of the disaster, though, was the development and
implementation of improved farming practices. A repeat of
the dust bowl, even under severe drought conditions, is
unlikely.
Water Management—Conserving an Essential Resource
FOS_Earth Science_DC.indd 141 2/8/10 10:59:13 AM
earth ScienceS
142
Until researchers concoct a superior method to detect subsurface water,
people must rely on old-fashioned trial and error.
For people living near the coasts, nding water is as easy as going
to the beach. e water is salty, though, and undrinkable. Yet it need
not remain so. Enhancing the world’s freshwater supply can be accom
-
plished through desalination—the removal of salt from seawater.
Conversion from salt to freshwater is a natural process in the water
cycle, as H
2
O molecules evaporate from the ocean and later precipitate
as freshwater. e conversion can be produced articially by distilla-
tion or various other procedures. More than 100 countries worldwide
use some amount of desalination, but in several countries of the Middle
East, North Africa, and the Caribbean Islands, desalination is one of
the most important sources of potable water. (More than half of the
world’s desalination facilities are located in the Middle East.) Less than
1 percent of freshwater in the United States comes from desalination
Animals like camels adapt to living in deserts and retain water in their
digestive tracts. (Sean Randall/Stockphoto)
FOS_Earth Science_DC.indd 142 2/8/10 10:59:14 AM
143
processes, although in 2007 in Tampa Bay, Florida, a seawater distilla-
tion plant opened that can provide about 10 percent of the city’s water
supply when the plant is operating at full capacity.
e main disadvantage of desalination to produce freshwater is
cost—the process is usually around four to ve times more expensive
than other water supplies because it uses a lot of energy. But for cities
with little access to freshwater and abundant access to seawater, main
-
taining an adequate supply for its citizens is worth the extra cost.
Some countries could employ desalination to meet their needs but
do not have the funds to construct high-capacity systems. However, re
-
searchers are working on developing low-cost alternatives. For exam-
ple, Joachim Koschikowski at the Fraunhofer Institute for Solar Energy
Systems in Freiburg, Germany, and his colleagues have recently built
small desalination systems that use solar power. One of these systems
can generate about 32 gallons (120 L) of freshwater per day at a cost of
only a few dollars. Test generators in Jordan and at one of the Canary
Islands in the Atlantic Ocean have been successful.
Another important factor is conservation. Since nding or gener
-
ating freshwater is dicult and expensive and excessive pumping of
groundwater
leads to serious problems such as subsidence, consumers
must make optimal use of what they have.
In addition to obvious strategies such as avoiding waste, scientif
-
ic research and development will play an important role in optimiz-
ing water use. For example, greater eciency in crop irrigation, which
consumes a lot of water, would result in substantial savings. Biologists
and soil scientists have discovered that maximal growth for crops de
-
pends on temperature and water, which varies from species to species.
At the Agricultural Research Service, a research agency of the United
States Department of Agriculture (USDA), scientists are working on
water-saving feedback mechanisms, based on data obtained from
plants, to control crop irrigation. e researchers Steven Evett, Susan
O’Shaughnessy, and their colleagues at the Agricultural Research Ser
-
vice have recently attached sensors to crop plants; the sensors transmit
information concerning plant temperature and health to the irrigation
system. is information provides essential feedback to the irrigation
system so that it can adjust the water supply as needed, depending on
the crop status at any given moment. Such ne-tuning saves water be
-
cause the system only delivers water when it is necessary.
Water Management—Conserving an Essential Resource
FOS_Earth Science_DC.indd 143 2/8/10 10:59:15 AM
earth ScienceS
144
Information fed back to a crop irrigation controller permits greater
eciency, but researchers would also like to be able to predict specic
needs and supplies in advance. Shortages or excesses in all water use—
industrial, agricultural, and personal—could be minimized if people
knew about and could prepare for their future water situation. But to
predict the future, hydrologists need a great deal of data and a little bit
of luck.
HydRoloGIC ModElInG and
PREdICtIon
Weather and climate are extremely important factors in a region’s wa-
ter supply. Rain lls lakes, swells rivers, and replenishes aquifers, while
droughts diminish all of these water reservoirs. Hydrologists who de
-
velop models of the water cycle and the ebb and ow of supplies must
take into account the weather. But predictions are dicult, and this is
particularly true of weather.
e Massachusetts Institute of Technology (MIT) professor Edward
Lorenz (1917–2008) discovered one of the reasons why weather predic
-
tion is so frustrating. In the 1960s, Lorenz was developing mathemati-
cal models to forecast weather systems. e model started with a set
of initial conditions—temperature, wind speed, atmospheric pressure,
and so forth—that Lorenz provided as an input. en a set of equations
computed
the future course of weather starting from the initial condi
-
tions. But Lorenz noticed that the prediction was extremely sensitive to
the exact values of the initial conditions. Even if the values changed only
slightly, the model’s behavior changed drastically, which meant that a
small change in the values Lorenz inputted into the model resulted in a
major change in the model’s prediction.
Sensitivity to initial conditions is known as chaos. Chaos occurs in
certain systems, such as weather systems, that are governed by com
-
plicated interactions. Predicting the future of these systems is excep-
tionally dicult because tiny changes in the present state of the system
get magnied over time. e importance of small changes is sometimes
called the buttery eect, from the notion—perhaps only slightly exag
-
gerated—that the apping of a buttery’s wings in Texas can aect a
hurricane in the Atlantic Ocean.
FOS_Earth Science_DC.indd 144 2/8/10 10:59:15 AM
145
Values of the initial conditions are crucial, but there is always some
uncertainty about these values because they come from measurements
that can never be completely accurate. All measurements incur some
amount of error, some of which is unpreventable—a yard or meter
stick, for example, may provide accuracy only to the nearest eighth of
an inch or to the nearest millimeter. As a consequence, weather models
become wildly inaccurate aer a few days.
To improve the accuracy of their models, hydrologists need to col
-
lect large amounts of accurate data. Because small changes at one loca-
tion can inuence distant events, the data needs to be global in scope.
One of the best ways of gathering global data is from a position of great
altitude. is requirement calls for a satellite.
e National Aeronautics and Space Administration (NASA), the
U.S. government agency involved in space science and exploration,
launches many satellites to study Earth from space. NASA’s Earth Ob
-
serving System consists of a series of satellites designed to keep an eye
on the planet, and one of these satellites,
Aqua, is specically designed
for hydrology. (e term aqua is Latin for “water.”) Aqua, launched on
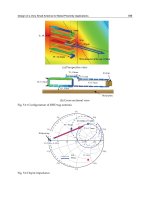
The image at left shows an Aqua satellite measurement of the
amount of reflected light (due mostly to clouds) over the United States
and the Gulf of Mexico. The image at right shows the amount of heat
leaving the surface, with the red areas losing the most. Energy flow
is critical to understanding the water cycle. Note the hurricane in the
center of the images. (CERES Science Team, NASA Langley Research
Center)
Water Management—Conserving an Essential Resource
FOS_Earth Science_DC.indd 145 2/8/10 10:59:15 AM
earth ScienceS
146
May 4, 2002, features six instruments to collect data on the water cycle,
water vapor in the atmosphere, clouds, snow and ice, rainfall, soil mois-
ture, and surface temperatures, among other variables. Data obtained
from Aqua has helped researchers at the National Oceanic and Atmo-
spheric Administration (NOAA) improve their forecasts, allowing bet-
ter accuracy farther into the future.
Weather predictions of NOAA and other weather service orga-
nizations enable communities to plan ahead. Contingency plans for
droughts are particularly important to preclude shortage crises. To
meet this need, the U.S. government established the National Integrat-
National Integrated Drought
Information System (NIDIS)
Widespread droughts in 2006 included many of the Great
Plains states of the U.S. Midwest, and in 2007 droughts in
the Great Plains as well as in the East cost more than $5 bil-
lion in agricultural and other losses. Severe water shortages
are not rare—at any given time, nearly a third of the United
States is affected. For example, in August 2007, nearly 40
percent of the country suffered from moderate to severe
drought conditions (fortunately, the percentage dropped to
20 percent by May 2008). The West and Midwest—the old
dust bowl region—experience droughts frequently, but other
areas of the country are not immune.
Prompted by governors of western states and other of-
fi cials, the United States established the National Integrated
Drought Information System (NIDIS) in 2006. NIDIS is a col-
laboration of several government agencies, including the De-
partment of Agriculture, Department of Commerce, Depart-
ment of the Interior, NASA, and others, led by NOAA. The goal
is to collect and integrate data from these agencies—satellite
data, crop yields, water levels, and so forth—to assess and
monitor drought conditions and develop increasingly accurate
FOS_Earth Science_DC.indd 146 2/8/10 10:59:16 AM
147
ed Drought Information System (NIDIS). As described in the sidebar
on page 146, NIDIS collects information from a spectrum of sources to
monitor the current drought situation in the United States and to high
-
light any trends that may indicate what the future has in store.
Gathering the right data is essential, but hydrologists also need to
understand how water moves and ows within its reservoirs. Vital to
many locales is the ow of groundwater. How water moves through
soil is critical to the maintenance of aquifers, but predicting this ow
is dicult because soil is not generally the same throughout a giv
-
en region—soil is usually heterogeneous, composed of a mixture of
models and forecasts. To spread their findings as widely as
possible, NIDIS launched a Web site, www.drought.gov, on
November 1, 2007. This Web site shows which parts of the
country are presently affected by drought and which parts
may be affected in the future.
Since weather plays a strong role in drought conditions
and local weather can be influenced by remote events, drought
forecasts are necessarily global in scope. For instance, an im-
portant factor in drought occurrences in the United States is
El Niño, a periodic warming of the waters off the west coast of
South America. (The name of this phenomenon derives from
the Spanish term for “the little boy,” a reference to Christ,
as the phenomenon is often observed around Christmas.) El
Niño and its corresponding atmospheric oscillation are as-
sociated with floods, storms, and droughts at a variety of
locations around the world, which occur following particularly
strong El Niño episodes. Researchers have found that El Niño
is strongly linked to rainfall amounts along the coastal areas
of the United States and weakly linked to the central areas
of the country. La Niña—a cooling of the waters off the west
coast of South America—seems much more important to the
situation in the central portion of the United States. (La Niña
is Spanish for “the little girl.”) The nature of these links, and
how they occur, are the subject of much ongoing research.
Water Management—Conserving an Essential Resource
FOS_Earth Science_DC.indd 147 2/8/10 10:59:16 AM