- Trang chủ >>
- Khoa Học Tự Nhiên >>
- Vật lý
The Earth’s Atmosphere Contents Part 2 pdf
Bạn đang xem bản rút gọn của tài liệu. Xem và tải ngay bản đầy đủ của tài liệu tại đây (1.34 MB, 47 trang )
22, the earth will have moved so that the sun is directly
above the equator. Except at the poles, the days and nights
throughout the world are of equal length. This day is
called the autumnal (fall) equinox, and it marks the as-
tronomical beginning of fall in the Northern Hemisphere.
At the North Pole, the sun appears on the horizon for 24
hours, due to the bending of light by the atmosphere. The
following day (or at least within several days), the sun dis-
appears from view, not to rise again for a long, cold six
months. Throughout the northern half of the world on
each successive day, there are fewer hours of daylight, and
the noon sun is slightly lower in the sky. Less direct sun-
light and shorter hours of daylight spell cooler weather for
the Northern Hemisphere. Reduced sunlight, lower air
temperatures, and cooling breezes stimulate the beautiful
pageantry of fall colors (see Fig. 2.20).
In some years around the middle of autumn, there
is an unseasonably warm spell, especially in the eastern
two-thirds of the United States. This warm period, re-
ferred to as Indian Summer, may last from several days
up to a week or more. It usually occurs when a large high
pressure area stalls near the southeast coast. The clock-
wise flow of air around this system moves warm air from
the Gulf of Mexico into the central or eastern half of the
nation. The warm, gentle breezes and smoke from a va-
riety of sources respectively make for mild, hazy days.
The warm weather ends abruptly when an outbreak of
polar air reminds us that winter is not far away.
On December 21 (three months after the autumnal
equinox), the Northern Hemisphere is tilted as far away
from the sun as it will be all year (see Fig. 2.17, p. 45).
Nights are long and days are short. Notice in Table 2.3
that daylight decreases from 12 hours at the equator to
0 (zero) at latitudes above 66
1
⁄
2
°N. This is the shortest
day of the year, called the winter solstice—the astro-
nomical beginning of winter in the northern world. On
this day, the sun shines directly above latitude 23
1
⁄
2
°S
(Tropic of Capricorn). In the northern half of the world,
the sun is at its lowest position in the noon sky. Its rays
pass through a thick section of atmosphere and spread
over a large area on the surface.
With so little incident sunlight, the earth’s surface
cools quickly. A blanket of clean snow covering the
ground aids in the cooling. In northern Canada and
Alaska, arctic air rapidly becomes extremely cold as it lies
poised, ready to do battle with the milder air to the south.
Periodically, this cold arctic air pushes down into the
northern United States, producing a rapid drop in tem-
perature called a cold wave, which occasionally reaches far
Incoming Solar Energy 47
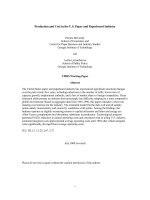
FIGURE 2.20
The pageantry of fall colors
along a country road in
Vermont. The weather most
suitable for an impressive
display of fall colors is warm,
sunny days followed by clear,
cool nights with temperatures
dropping below 7°C (45°F),
but remaining above freezing.
Contrary to popular belief, it is not the first frost that
causes the leaves of deciduous trees to change color.
The yellow and orange colors, which are actually in the
leaves, begin to show through several weeks before
the first frost, as shorter days and cooler nights cause
a decrease in the production of the green pigment
chlorophyll.
into the south. Sometimes, these cold spells arrive well
before the winter solstice—the “official” first day of win-
ter—bringing with them heavy snow and blustery winds.
(More information on this “official” first day of winter is
given in the Focus section on p. 49.)
Three months past the winter solstice marks the
astronomical arrival of spring, which is called the vernal
(spring) equinox. The date is March 20 and, once again,
the noonday sun is shining directly on the equator, days
and nights throughout the world are of equal length,
and, at the North Pole, the sun rises above the horizon
after a long six month absence.
At this point it is interesting to note that although
sunlight is most intense in the Northern Hemisphere on
June 21, the warmest weather in middle latitudes nor-
mally occurs weeks later, usually in July or August. This
situation (called the lag in seasonal temperature) arises
because although incoming energy from the sun is
greatest in June, it still exceeds outgoing energy from the
earth for a period of at least several weeks. When in-
coming solar energy and outgoing earth energy are in
balance, the highest average temperature is attained.
When outgoing energy exceeds incoming energy, the
average temperature drops. Because outgoing earth en-
ergy exceeds incoming solar energy well past the winter
solstice (December 21), we normally find our coldest
weather occurring in January or February.
Up to now, we have seen that the seasons are con-
trolled by solar energy striking our tilted planet, as it
makes its annual voyage around the sun. This tilt of the
earth causes a seasonal variation in both the length of
daylight and the intensity of sunlight that reaches the
surface. Because of these facts, high latitudes tend to lose
more energy to space each year than they receive from
the sun, while low latitudes tend to gain more energy
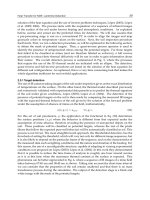
during the course of a year than they lose. From Fig. 2.21
we can see that only at middle latitudes near 37° does the
amount of energy received each year balance the amount
lost. From this situation, we might conclude that polar
regions are growing colder each year, while tropical re-
gions are becoming warmer. But this does not happen.
To compensate for these gains and losses of energy,
winds in the atmosphere and currents in the oceans cir-
culate warm air and water toward the poles, and cold air
and water toward the equator. Thus, the transfer of heat
energy by atmospheric and oceanic circulations prevents
low latitudes from steadily becoming warmer and high
latitudes from steadily growing colder. These circula-
tions are extremely important to weather and climate,
and will be treated more completely in Chapter 7.
SEASONS IN THE SOUTHERN HEMISPHERE On June
21, the Southern Hemisphere is adjusting to an entirely
different season. Because this part of the world is now
tilted away from the sun, nights are long, days are short,
and solar rays come in at an angle. All of these factors
keep air temperatures fairly low. The June solstice marks
the astronomical beginning of winter in the Southern
Hemisphere. In this part of the world, summer will not
“officially” begin until the sun is over the Tropic of Capri-
corn (23
1
⁄
2
°S)—remember that this occurs on December
21. So, when it is winter and June in the Southern Hemi-
sphere, it is summer and June in the Northern Hemi-
sphere. If you are tired of the hot June weather in your
Northern Hemisphere city, travel to the winter half of the
world and enjoy the cooler weather. The tilt of the earth
as it revolves around the sun makes all this possible.
We know the earth comes nearer to the sun in Janu-
ary than in July. Even though this difference in distance
amounts to only about 3 percent, the energy that strikes
the top of the earth’s atmosphere is almost 7 percent
greater on January 3 than on July 4. These statistics might
48 Chapter 2 Warming the Earth and the Atmosphere
Balance Balance
Deficit Deficit
Heat
transfer
90 60 30 0 30 60 90
°North Latitude °South
R
a
d
i
a
n
t
e
n
e
r
g
y
i
n
o
n
e
y
e
a
r
Surplus
Heat
transfer
37° 37°
FIGURE 2.21
The average annual incoming solar radiation (red line)
absorbed by the earth and the atmosphere along with the
average annual infrared radiation (blue line) emitted by the
earth and the atmosphere.
The origin of the term Indian Summer dates back to the
eighteenth century. Possibly it referred to the good
weather that allowed the Indians time to harvest their
crops. Today, a period of cool autumn weather, often
with below-freezing temperatures, must precede the
warm period for it to be called Indian Summer.
lead us to believe that summer should be warmer in the
Southern Hemisphere than in the Northern Hemisphere,
which, however, is not the case. A close examination of the
Southern Hemisphere reveals that nearly 81 percent of the
surface is water compared to 61 percent in the Northern
Hemisphere. The added solar energy due to the closeness
of the sun is absorbed by large bodies of water, becoming
well mixed and circulated within them. This process keeps
the average summer (January) temperatures in the South-
ern Hemisphere cooler than summer (July) temperatures
in the Northern Hemisphere. Because of water’s large heat
capacity, it also tends to keep winters in the Southern
Hemisphere warmer than we might expect.*
LOCAL SEASONAL VARIATIONS Figure 2.22 shows how
the sun’s position changes in the middle latitudes of the
Northern Hemisphere during the course of one year. Note
that, during the winter, the sun rises in the southeast and
sets in the southwest. During the summer, it rises in the
northeast, reaches a much higher position in the sky at
noon, and sets in the northwest. Clearly, objects facing
south will receive more sunlight during a year than those
facing north. This fact becomes strikingly apparent in
hilly or mountainous country.
Hills that face south receive more sunshine and,
hence, become warmer than the partially shielded
north-facing hills. Higher temperatures usually mean
greater rates of evaporation and slightly drier soil con-
ditions. Thus, south-facing hillsides are usually warmer
and drier as compared to north-facing slopes at the
same elevation. In many areas of the far west, only
sparse vegetation grows on south-facing slopes, while,
on the same hill, dense vegetation grows on the cool,
moist hills that face north (see Fig. 2.23).
In the mountains, snow usually lingers on the
ground for a longer time on north slopes than on the
warmer south slopes. For this reason, ski runs are built
facing north wherever possible. Also, homes and cabins
Incoming Solar Energy
49
On December 21 (or 22, depending
on the year) after nearly a month of
cold weather, and perhaps a snow-
storm or two, someone on the radio or
television has the audacity to proclaim
that “today is the first official day of
winter.” If during the last several weeks
it was not winter, then what season
was it?
Actually, December 21 marks the
astronomical first day of winter in the
Northern Hemisphere (NH), just as
June 21 marks the astronomical first
day of summer (NH). The earth is tilted
on its axis by 23
1
⁄
2
° as it revolves
around the sun. This fact causes the sun
(as we view it from earth) to move in
the sky from a point where it is directly
above 23
1
⁄
2
° South latitude on Decem-
ber 21, to a point where it is directly
above 23
1
⁄
2.
° North latitude on June
21. The astronomical first day of spring
(NH) occurs around March 20 as the
sun crosses the equator moving
northward and, likewise, the astronomi-
cal first day of autumn (NH) occurs
around September 22 as the sun
crosses the equator moving southward.
In the middle latitudes, summer is de-
fined as the warmest season and winter
the coldest season. If the year is
divided into four seasons with each
season consisting of three months, then
the meteorological definition of summer
over much of the Northern Hemisphere
would be the three warmest months of
June, July, and August. Winter would
be the three coldest months of Decem-
ber, January, and February. Autumn
would be September, October, and
November—the transition between
summer and winter. And spring would
be March, April, and May—the
transition between winter and summer.
So, the next time you hear someone
remark on December 21 that “winter
officially begins today,” remember that
this is the astronomical definition of the
first day of winter. According to the me-
teorological definition, winter has been
around for several weeks.
IS DECEMBER 21 REALLY THE FIRST DAY OF WINTER?
Focus on a Special Topic
*For a comparison of January and July temperatures see Figs. 3.8 and 3.9,
p. 61.
W
Sunset
4:30
7:30
June sun
December sun
SN
E
7:30
4:30
Sunrise
FIGURE 2.22
The changing position of the sun, as observed in middle
latitudes in the Northern Hemisphere.
built on the north side of a hill usually have a steep
pitched roof, as well as a reinforced deck to withstand
the added weight of snow from successive winter storms.
The seasonal change in the sun’s position during
the year can have an effect on the vegetation around the
home. In winter, a large two-story home can shade its
own north side, keeping it much cooler than its south
side. Trees that require warm, sunny weather should be
planted on the south side, where sunlight reflected
from the house can even add to the warmth.
The design of a home can be important in reduc-
ing heating and cooling costs. Large windows should
face south, allowing sunshine to penetrate the home in
winter. To block out excess sunlight during the summer,
a small eave or overhang should be built. A kitchen with
windows facing east will let in enough warm morning
sunlight to help heat this area. Because the west side
warms rapidly in the afternoon, rooms having small
windows (such as garages) should be placed here to act
as a thermal buffer. Deciduous trees planted on the west
side of a home provide shade in the summer. In winter,
they drop their leaves, allowing the winter sunshine to
warm the house. If you like the bedroom slightly cooler
than the rest of the home, face it toward the north. Let
nature help with the heating and air conditioning.
Proper house design, orientation, and landscaping can
help cut the demand for electricity, as well as for natural
gas and fossil fuels, which are rapidly being depleted.
50 Chapter 2 Warming the Earth and the Atmosphere
FIGURE 2.23
In areas where small tempera-
ture changes can cause major
changes in soil moisture,
sparse vegetation on the
south-facing slopes will often
contrast with lush vegetation
on the north-facing slopes.
Summary
In this chapter, we looked at the concepts of heat and
temperature and learned that latent heat is an impor-
tant source of atmospheric heat energy. We also learned
that the transfer of heat can take place by conduction,
convection, and radiation—the transfer of energy by
means of electromagnetic waves.
The hot sun emits most of its radiation as short-
wave radiation. A portion of this energy heats the earth,
and the earth, in turn, warms the air above. The cool
earth emits most of its radiation as longwave infrared
energy. Selective absorbers in the atmosphere, such as
water vapor and carbon dioxide, absorb some of the
earth’s infrared radiation and radiate a portion of it
back to the surface, where it warms the surface, produc-
ing the atmospheric greenhouse effect. The average
equilibrium temperature of the earth and the atmos-
phere remains fairly constant from one year to the next
because the amount of energy they absorb each year is
equal to the amount of energy they lose.
We examined the seasons and found that the earth
has seasons because it is tilted on its axis as it revolves
around the sun. The tilt of the earth causes a seasonal
variation in both the length of daylight and the intensity
of sunlight that reaches the surface. Finally, on a more
local setting, we saw that the earth’s inclination influ-
ences the amount of solar energy received on the north
and south side of a hill, as well as around a home.
Key Terms
The following terms are listed in the order they appear
in the text. Define each. Doing so will aid you in re-
viewing the material covered in this chapter.
Questions for Review
1. Distinguish between temperature and heat.
2. How does the average speed of air molecules relate to
the air temperature?
3. Explain how heat is transferred in our atmosphere by:
(a) conduction (b) convection (c) radiation
4. What is latent heat? How is latent heat an important
source of atmospheric energy?
5. How does the Kelvin temperature scale differ from the
Celsius scale?
6. How does the amount of radiation emitted by the earth
differ from that emitted by the sun?
7. How does the temperature of an object influence the
radiation it emits?
8. How do the wavelengths of most of the radiation emit-
ted by the sun differ from those emitted by the surface
of the earth?
9. When a body reaches a radiative equilibrium tempera-
ture, what is taking place?
10. Why are carbon dioxide and water vapor called selec-
tive absorbers?
11. Explain how the earth’s atmospheric greenhouse effect
works.
12. What gases appear to be responsible for the enhance-
ment of the earth’s greenhouse effect?
13. Why does the albedo of the earth and its atmosphere
average about 30 percent?
14. Explain how the atmosphere near the earth’s surface is
warmed from below.
15. In the Northern Hemisphere, why are summers
warmer than winters even though the earth is actually
closer to the sun in January?
16. What are the main factors that determine seasonal tem-
perature variations?
17. If it is winter and January in New York City, what is the
season and month in Sydney, Australia?
18. During the Northern Hemisphere’s summer, the daylight
hours in northern latitudes are longer than in middle lat-
itudes. Explain why northern latitudes are not warmer.
19. Explain why the vegetation on the north-facing side of
a hill is frequently different from the vegetation on the
south-facing side of the same hill.
Questions for Thought
and Exploration
1. If the surface of a puddle freezes, is heat energy released
to or taken from the air above the puddle? Explain.
2. In houses and apartments with forced-air furnaces, heat
registers are usually placed near the floor rather than
near the ceiling. Explain why.
3. Which do you feel would have the greatest effect on the
earth’s greenhouse effect: removing all of the CO
2
from
the atmosphere or removing all of the water vapor? Ex-
plain your answer.
4. How would the seasons be affected where you live if the
tilt of the earth’s axis increased from 23
1
⁄
2
° to 40°?
5. Use the Atmospheric Basics/Energy Balance section of
the Blue Skies CD-ROM to compare the solar energy
balance for Goodwin Creek, Mississippi, and Fort Peck,
Montana. What are the noontime albedos for each loca-
tion? Why are they different? Which component of the
albedo (earth’s surface, clouds, or atmosphere) domi-
nates in each case? Explain why.
6. Using the Atmospheric Basics/Energy Balance section of
the Blue Skies CD-ROM, compare the values of the win-
tertime earth-atmosphere energy balance components
for Penn State, Pennsylvania, and Desert Rock, Nevada.
Explain any differences you find.
7. The Aurora ( />dio/auroras/selfguide1.html): Compare the appearance of
auroras as viewed from earth and as viewed from space.
8. Ultraviolet Radiation Index ( />uvindex/index_e.cfm?xvz): On what information do you
think the UV Index is based? What are some of the ac-
tivities that you engage in that might put you at risk for
extended exposure to ultraviolet radiation?
For additional readings, go to InfoTrac College
Edition, your online library, at:
Questions for Thought and Exploration
51
kinetic energy
temperature
absolute zero
heat
Kelvin scale
Fahrenheit scale
Celsius scale
latent heat
sensible heat
conduction
convection
thermals
advection
radiant energy (radiation)
electromagnetic waves
micrometer
photons
visible region
ultraviolet radiation (UV)
infrared radiation (IR)
blackbody
radiative equilibrium
temperature
selective absorbers
greenhouse effect
atmospheric window
solar constant
scattering
reflected (light)
albedo
aurora
summer solstice
autumnal equinox
Indian summer
winter solstice
vernal equinox
Daily Temperature Variations
Daytime Warming
Nighttime Cooling
Cold Air Near the Surface
Focus on a Special Topic:
Record High Temperatures
Protecting Crops from the Cold
Night Air
Focus on a Special Topic:
Record Low Temperatures
The Controls of Temperature
Air Temperature Data
Daily, Monthly, and Yearly
Temperatures
Focus on a Special Topic:
When It Comes to Temperature,
What’s Normal?
The Use of Temperature Data
Air Temperature and Human Comfort
Focus on a Special Topic:
A Thousand Degrees and
Freezing to Death
Measuring Air Temperature
Focus on an Observation:
Thermometers Should Be
Read in the Shade
Summary
Key Terms
Questions for Review
Questions for Thought and Exploration
Contents
T
he sun shining full upon the field, the soil of which was
sandy, the mouth of a heated oven seemed to me to
be a trifle hotter than this ploughed field; it was almost impossi-
ble to breathe. . . . The weather was almost too hot to live in,
and the British troops in the orchard were forced by the heat to
shelter themselves from it under trees. . . . I presume everyone
has heard of the heat that day, but none can realize it that did
not feel it. Fighting is hot work in cool weather, how much
more so in such weather as it was on the twenty-eighth of
June 1778.
David M. Ludlum, The Weather Factor
Air Temperature
53
A
ir temperature is an important weather element.
It not only dictates how we should dress for the
day, but the careful recording and application of tem-
perature data are tremendously important to us all. For
without accurate information of this type, the work of
farmers, weather analysts, power company engineers,
and many others would be a great deal more difficult.
Therefore, we begin this chapter by examining the daily
variation in air temperature. Here, we will answer such
questions as why the warmest time of the day is nor-
mally in the afternoon, and why the coldest is usually in
the early morning. And why calm, clear nights are usu-
ally colder than windy, clear nights. After we examine
the factors that cause temperatures to vary from one
place to another, we will look at daily, monthly, and
yearly temperature averages and ranges with an eye to-
ward practical applications for everyday living. Near the
end of the chapter, we will see how air temperature is
measured and how the wind can change our perception
of air temperature.
Daily Temperature Variations
In Chapter 2, we learned how the sun’s energy coupled
with the motions of the earth produce the seasons. In a
way, each sunny day is like a tiny season as the air goes
through a daily cycle of warming and cooling. The air
warms during the morning hours, as the sun gradually
rises higher in the sky, spreading a blanket of heat en-
ergy over the ground. The sun reaches its highest point
around noon, after which it begins its slow journey to-
ward the western horizon. It is around noon when the
earth’s surface receives the most intense solar rays.
However, somewhat surprisingly, noontime is usually
not the warmest part of the day. Rather, the air contin-
ues to be heated, often reaching a maximum tempera-
ture later in the afternoon. To find out why this lag in
temperature occurs, we need to examine a shallow layer
of air in contact with the ground.
DAYTIME WARMING As the sun rises in the morning,
sunlight warms the ground, and the ground warms the
air in contact with it by conduction. However, air is
such a poor heat conductor that this process only takes
place within a few centimeters of the ground. As the sun
rises higher in the sky, the air in contact with the ground
becomes even warmer, and, on a windless day, a sub-
stantial temperature difference usually exists just above
the ground. This explains why joggers on a clear, wind-
less, hot summer afternoon may experience air temper-
atures of over 50°C (122°F) at their feet and only 35°C
(95°F) at their waists (see Fig. 3.1).
Near the surface, convection begins, and rising air
bubbles (thermals) help to redistribute heat. In calm
weather, these thermals are small and do not effectively
mix the air near the surface. Thus, large vertical tempera-
ture differences are able to exist. On windy days, however,
turbulent eddies are able to mix hot, surface air with the
cooler air above. This form of mechanical stirring, some-
times called forced convection, helps the thermals to trans-
fer heat away from the surface more efficiently. Therefore,
on sunny, windy days the temperature difference between
the surface air and the air directly above is not as great as
it is on sunny, calm days.
We can now see why the warmest part of the day is
usually in the afternoon. Around noon, the sun’s rays
are most intense. However, even though incoming solar
radiation decreases in intensity after noon, it still ex-
ceeds outgoing heat energy from the surface for a time.
This yields an energy surplus for two to four hours af-
ter noon and substantially contributes to a lag between
the time of maximum solar heating and the time of
maximum air temperature several feet above the surface
(see Fig. 3.2).
The exact time of the highest temperature reading
varies somewhat. Where the summer sky remains
cloud-free all afternoon, the maximum temperature
may occur sometime between 3:00 and 5:00
P.M. Where
there is afternoon cloudiness or haze, the temperature
maximum occurs an hour or two earlier. If clouds per-
54 Chapter 3 Air Temperature
90
100 110
120
35
40 45 50
Temperature
Air temperature
°C
°F
Altitude
Thermometer
1.5 m
(5.5 ft)
Shelter
FIGURE 3.1
On a sunny, calm day, the air near the surface can be substan-
tially warmer than the air a meter or so above the surface.
sist throughout the day, the overall daytime tempera-
tures are usually lower, as clouds reflect a great deal of
incoming sunlight.
Adjacent to large bodies of water, cool air moving
inland may modify the rhythm of temperature change
such that the warmest part of the day occurs at noon or
before. In winter, atmospheric storms circulating warm
air northward can even cause the highest temperature to
occur at night.
Just how warm the air becomes depends on such
factors as the type of soil, its moisture content, and veg-
etation cover. When the soil is a poor heat conductor (as
loosely packed sand is), heat energy does not readily
transfer into the ground. This allows the surface layer to
reach a higher temperature, availing more energy to
warm the air above. On the other hand, if the soil is
moist or covered with vegetation, much of the available
energy evaporates water, leaving less to heat the air. As
you might expect, the highest summer temperatures
usually occur over desert regions, where clear skies cou-
pled with low humidities and meager vegetation permit
the surface and the air above to warm up rapidly.
Where the air is humid, haze and cloudiness lower
the maximum temperature by preventing some of the
sun’s rays from reaching the ground. In humid Atlanta,
Georgia, the average maximum temperature for July is
30.5°C (87°F). In contrast, Phoenix, Arizona—in the
desert southwest at the same latitude as Atlanta—expe-
riences an average July maximum of 40.5°C (105°F).
(Additional information on high daytime temperatures
is given in the Focus section on p. 56.)
NIGHTTIME COOLING As the sun lowers, its energy is
spread over a larger area, which reduces the heat avail-
able to warm the ground. Observe in Fig. 3.2 that some-
time in late afternoon or early evening, the earth’s
surface and air above begin to lose more energy than
they receive; hence, they start to cool.
Both the ground and air above cool by radiating
infrared energy, a process called radiational cooling.
The ground, being a much better radiator than air, is
able to cool more quickly. Consequently, shortly after
sunset, the earth’s surface is slightly cooler than the air
directly above it. The surface air transfers some energy
to the ground by conduction, which the ground, in
turn, quickly radiates away.
As the night progresses, the ground and the air in
contact with it continue to cool more rapidly than the
air a few meters higher. The warmer upper air does
transfer some heat downward, a process that is slow due
to the air’s poor thermal conductivity. Therefore, by late
night or early morning, the coldest air is next to the
ground, with slightly warmer air above (see Fig. 3.3).
This measured increase in air temperature just
above the ground is known as a radiation inversion be-
cause it forms mainly through radiational cooling of the
surface. Because radiation inversions occur on most clear,
calm nights, they are also called nocturnal inversions.
COLD AIR NEAR THE SURFACE A strong radiation in-
version occurs when the air near the ground is much
colder than the air higher up. Ideal conditions for a
strong inversion and, hence, very low nighttime tem-
peratures exist when the air is calm, the night is long,
Daily Temperature Variations 55
Death Valley, California, had a high temperature of
38°C (100°F) on 134 days during 1974. During July,
1998, the temperature in Death Valley reached a scorch-
ing 54°C (129°F)—only 4°C (7°F) below the world
record high temperature of 58°C (136°F) measured in
El Azizia, Libya, in 1922.
12 2 4 6 8 10 Noon 2
Time
Sunrise
Outgoing
earth energy
Energy rate
4681012
Sunset
Incoming solar energy
Min
Daily temperature
Max
Temperature
FIGURE 3.2
The daily variation in air temperature is controlled by
incoming energy (primarily from the sun) and outgoing energy
from the earth’s surface. Where incoming energy exceeds
outgoing energy (orange shade), the air temperature rises.
Where outgoing energy exceeds incoming energy (blue shade),
the air temperature falls.
El Azizia, Libya 58 136 The world September 13, 1922
(32°N)
Death Valley, Calif. 57 134 Western July 10, 1913
(36°N) Hemisphere
Tirat Tsvi, Israel 54 129 Middle East June 21, 1942
(32°N)
Cloncurry, 53 128 Australia January 16, 1889
Queensland (21°S)
Seville, Spain (37°N) 50 122 Europe August 4, 1881
Rivadavia, Argentina 49 120 South December 11, 1905
(35°S) America
Midale, Saskatchewan 45 113 Canada July 5, 1937
(49°N)
Fort Yukon, Alaska 38 100 Alaska June 27, 1915
(66°N)
Pahala, Hawaii (19°N) 38 100 Hawaii April 27, 1931
Esparanza, Antarctica 14 58 Antarctica October 20, 1956
(63°S)
and the air is fairly dry and cloud-free. Let’s examine
these ingredients one by one.
A windless night is essential for a strong radiation
inversion because a stiff breeze tends to mix the colder air
at the surface with the warmer air above. This mixing,
along with the cooling of the warmer air as it comes in
contact with the cold ground, causes a vertical tempera-
ture profile that is almost isothermal (constant tempera-
ture) in a layer several feet thick. In the absence of wind,
the cooler, more-dense surface air does not readily mix
with the warmer, less-dense air above, and the inversion
is more strongly developed as illustrated in Fig. 3.3.
A long night also contributes to a strong inversion.
Generally, the longer the night, the longer the time of ra-
diational cooling and the better are the chances that the air
near the ground will be much colder than the air above.
56 Chapter 3 Air Temperature
Most people are aware of the
extreme heat that exists during the
summer in the desert southwest of the
United States. But how hot does it get
there? On July 10, 1913, Greenland
Ranch in Death Valley, California, re-
ported the highest temperature ever
observed in North America: 57°C
(134°F). Here, air temperatures are
persistently hot throughout the
summer, with the average maximum
for July being 47°C (116°F). During
the summer of 1917, there was an in-
credible period of 43 consecutive
days when the maximum temperature
reached 120°F or higher.
Probably the hottest urban area in
the United States is Yuma, Arizona.
Located along the California–Arizona
border, Yuma’s high temperature dur-
ing July averages 42°C (108°F). In
1937, the high reached 100°F or
more for 101 consecutive days.
In a more humid climate, the maxi-
mum temperature rarely climbs above
41°C (106°F). However, during the
record heat wave of 1936, the air
temperature reached 121°F near
Alton, Kansas. And during the heat
wave of 1983, which destroyed
about $7 billion in crops and
increased the nation’s air-conditioning
bill by an estimated $1 billion, Fayet-
teville reported North Carolina’s all-
time record high temperature when
the mercury hit 110°F.
These readings, however, do not
hold a candle to the hottest place in
the world. That distinction probably
belongs to Dallol, Ethiopia. Dallol is
located south of the Red Sea, near
latitude 12°N, in the hot, dry Danakil
Depression. A prospecting company
kept weather records at Dallol from
1960 to 1966. During this time, the
average daily maximum temperature
exceeded 38°C (100°F) every month
of the year, except during December
and January, when the average maxi-
mum lowered to 98°F and 97°F,
respectively. On many days, the air
temperature exceeded 120°F. The av-
erage annual temperature for the six
years at Dallol was 34°C (94°F). In
comparison, the average annual tem-
perature in Yuma is 23°C (74°F) and
at Death Valley, 24°C (76°F). The
highest temperature reading on earth
(under standard conditions) occurred
northeast of Dallol at El Azizia, Libya
(32°N), when, on September 13,
1922, the temperature reached a
scorching 58°C (136°F). Table 1
gives record high temperatures
throughout the world.
RECORD HIGH TEMPERATURES
Focus on a Special Topic
TABLE 1 Some Record High Temperatures Throughout the World
Record High
Location Temperature
(Latitude) (°C) (°F) Record for: Date
Consequently, winter nights provide the best conditions
for a strong radiation inversion, other factors being equal.
Finally, radiation inversions are more likely with a
clear sky and dry air. Under these conditions, the ground
is able to radiate its energy to outer space and thereby
cool rapidly. However, with cloudy weather and moist air,
much of the outgoing infrared energy is absorbed and
radiated to the surface, retarding the rate of cooling. Also,
on moist nights, condensation in the form of fog or dew
will release latent heat, which warms the air. So, radiation
inversions may occur on any night. But, during long win-
ter nights, when the air is still, cloud-free, and relatively
dry, these inversions can become strong and deep.
It should now be apparent that how cold the night
air becomes depends primarily on the length of the
night, the moisture content of the air, cloudiness, and
the wind. Even though wind may initially bring cold air
into a region, the coldest nights usually occur when the
air is clear and relatively calm. (Additional information
on very low nighttime temperatures is given in the
Focus section on p. 58.)
Look back at Fig. 3.2 (p. 55) and observe that the
lowest temperature on any given day is usually observed
around sunrise. However, the cooling of the ground and
surface air may even continue beyond sunrise for a half
hour or so, as outgoing energy can exceed incoming
energy. This situation happens because light from the
early morning sun passes through a thick section of at-
mosphere and strikes the ground at a low angle. Conse-
quently, the sun’s energy does not effectively warm the
surface. Surface heating may be reduced further when
the ground is moist and available energy is used for
evaporation. Hence, the lowest temperature may occur
shortly after the sun has risen.
Cold, heavy surface air slowly drains downhill dur-
ing the night and eventually settles in low-lying basins
and valleys. Valley bottoms are thus colder than the sur-
rounding hillsides (see Fig. 3.4). In middle latitudes, these
warmer hillsides, called thermal belts, are less likely to
experience freezing temperatures than the valley below.
This encourages farmers to plant on hillsides those trees
unable to survive the valley’s low temperature.
On the valley floor, the cold, dense air is unable to
rise. Smoke and other pollutants trapped in this heavy
air restrict visibility. Therefore, valley bottoms are not
only colder, but are also more frequently polluted than
nearby hillsides. Even when the land is only gently
sloped, cold air settles into lower-lying areas, such as
river basins and floodplains. Because the flat floodplains
are agriculturally rich areas, cold air drainage often
forces farmers to seek protection for their crops.
Protecting Crops from the Cold Night Air On cold
nights, many plants may be damaged by low tempera-
tures. To protect small plants or shrubs, cover them with
straw, cloth, or plastic sheeting. This prevents ground
heat from being radiated away to the colder surround-
ings. If you are a household gardener concerned about
outside flowers and plants during cold weather, simply
wrap them in plastic or cover each with a paper cup.
Fruit trees are particularly vulnerable to cold
weather in the spring when they are blossoming. The
protection of such trees presents a serious problem to
the farmer. Since the lowest temperatures on a clear, still
Daily Temperature Variations 57
Temperature
Air temperature
°C
°F
Altitude
Thermometer
Shelter
–2
30
0
35
2
4
40
1.5 m
(5.5 ft)
FIGURE 3.3
On a clear, calm night, the air near the surface can be much
colder than the air above. The increase in air temperature with
increasing height above the surface is called a radiation temper-
ature inversion.
When the surface air temperature dipped to its all-time
record low of –88°C (–127°F) on the Antarctic Plateau
of Vostok Station, a drop of saliva falling from the lips
of a person taking an observation would have frozen
solid before reaching the ground.
Talk about cold turkey! In Fairbanks, Alaska, on Thanks-
giving day in 1990, the air temperature plummeted to
–42°C (–44°F), only 3°C (5°F) above Fairbanks’ all-time
record low for November.
night occur near the surface, the lower branches of a
tree are the most susceptible to damage. Therefore, in-
creasing the air temperature close to the ground may
prevent damage. One way this can be done is to use or-
chard heaters, or “smudge pots,” which warm the air
around them by setting up convection currents close to
the ground (see Fig. 3.5).
Another way to protect trees is to mix the cold air
at the ground with the warmer air above, thus raising
the temperature of the air next to the ground. Such mix-
58 Chapter 3 Air Temperature
One city in the United States that
experiences very low temperatures
is International Falls, Minnesota,
where the average temperature for
January is –16°C (3°F). Located
several hundred miles to the south,
Minneapolis–St. Paul, with an
average temperature of –9°C (16°F)
for the three winter months, is the
coldest major urban area in the
nation. For duration of extreme cold,
Minneapolis reported 186 consecu-
tive hours of temperatures below 0°F
during the winter of 1911–1912.
Within the forty-eight adjacent states,
however, the record for the longest
duration of severe cold belongs to
Langdon, North Dakota, where the
thermometer remained below 0°F for
41 consecutive days during the winter
of 1936. The official record for the
lowest temperature in the forty-eight
adjacent states belongs to Rogers
Pass, Montana, where on the morning
of January 20, 1954, the mercury
dropped to –57°C (–70°F). The lowest
official temperature for Alaska, –62°C
(–80°F), occurred at Prospect Creek
on January 23, 1971.
The coldest areas in North
America are found in the Yukon and
Northwest Territories of Canada. Res-
olute, Canada (latitude 75°N), has
an average temperature of –32°C
(–26°F) for the month of January.
The lowest temperatures and cold-
est winters in the Northern Hemi-
sphere are found in the interior of
Siberia and Greenland. For example,
the average January temperature in
Yakutsk, Siberia (latitude 62°N), is
–43°C (–46°F). There, the mean
temperature for the entire year is a
bitter cold –11°C (12°F). At Eismitte,
Greenland, the average temperature
for February (the coldest month) is
–47°C (–53°F), with the mean annual
temperature being a frigid –30°C
(–22°F). Even though these temper-
atures are extremely low, they do not
come close to the coldest area of the
world: the Antarctic.
At the geographical South Pole,
over nine thousand feet above sea
level, where the Amundsen-Scott
scientific station has been keeping
records for more than thirty years, the
average temperature for the month of
July (winter) is –59°C (–74°F) and the
mean annual temperature is –49°C
(–57°F). The lowest temperature ever
recorded there (–83°C or –117°F)
occurred under clear skies with a
light wind on the morning of June 23,
1983. Cold as it was, it was not the
record low for the world. That
belongs to the Russian station at
Vostok, Antarctica (latitude 78°S),
where the temperature plummeted to
–89°C (–129°F) on July 21, 1983.
(See Table 2 for record low tempera-
tures throughout the world.)
RECORD LOW TEMPERATURES
Focus on a Special Topic
Vostok, Antarctica –89 –129 The world July 21, 1983
(78°S)
Verkhoyansk, Russia –68 –90 Northern February 7, 1892
(67°N) Hemisphere
Northice, Greenland –66 –87 Greenland January 9, 1954
(72°N)
Snag, Yukon (62°N) –63 –81 North America February 3, 1947
Prospect Creek, –62 –80 Alaska January 23, 1971
Alaska (66°N)
Rogers Pass, Montana –57 –70 U.S. (exclud- January 20, 1954
(47°N) ing Alaska)
Sarmiento, Argentina –33 –27 South America June 1, 1907
(34°S)
Ifrane, Morocco (33°N) –24 –11 Africa February 11, 1935
Charlotte Pass, –22 –8 Australia July 22, 1949
Australia (36°S)
Mt. Haleakala, Hawaii –10 14 Hawaii January 2, 1961
(20°N)
TABLE 2 Some Record Low Temperatures Throughout the World
Record Low
Location Temperature
(Latitude) (°C) (°F) Record for: Date
ing can be accomplished by using wind machines (see
Fig. 3.6), which are power-driven fans that resemble air-
plane propellers. Farmers without their own wind ma-
chines can rent air mixers in the form of helicopters.
Although helicopters are effective in mixing the air, they
are expensive to operate.
If sufficient water is available, trees can be pro-
tected by irrigation. On potentially cold nights, the or-
chard may be flooded. Because water has a high heat
capacity, it cools more slowly than dry soil. Conse-
quently, the surface does not become as cold as it would
if it were dry. Furthermore, wet soil has a higher ther-
mal conductivity than dry soil. Hence, in wet soil heat is
conducted upward from subsurface soil more rapidly,
which helps to keep the surface warmer.
So far, we have discussed protecting trees against the
cold air near the ground during a radiation inversion.
Farmers often face another nighttime cooling problem.
For instance, when subfreezing air blows into a region,
the coldest air is not found at the surface; the air actually
becomes colder with height. This condition is known as a
freeze.*A single freeze in California or Florida can cause
several million dollars damage to citrus crops.
*A freeze occurs over a widespread area when the surface air temperature re-
mains below freezing for a long enough time to damage certain agricultural
crops.
Daily Temperature Variations 59
Below freezing
01020304050
–15
–10
–5
0
5
10
Temperature
0
100
200
300
400
Altitude (m)
500
Temperature
profile
°C
°F
Above freezing
Below freezing
Thermal belt
0
1500
1000
500
Altitude (ft)
FIGURE 3.4
On cold, clear nights, the settling of cold air into valleys makes them colder than
surrounding hillsides. The region along the side of the hill where the air temperature is
above freezing is known as a thermal belt.
FIGURE 3.5
Orchard heaters circulate the air by setting up convection
currents.
Protecting an orchard from the damaging cold air
blown by the wind can be a problem. Wind machines
will not help because they would only mix cold air at the
surface with the colder air above. Orchard heaters and
irrigation are of little value as they would only protect
the branches just above the ground. However, there is
one form of protection that does work: An orchard’s
sprinkling system may be turned on so that it emits a
fine spray of water. In the cold air, the water freezes
around the branches and buds, coating them with a thin
veneer of ice (see Fig. 3.7). As long as the spraying con-
tinues, the latent heat—given off as the water changes
into ice—keeps the ice temperature at 0°C (32°F). The
ice acts as a protective coating against the subfreezing
air by keeping the buds (or fruit) at a temperature
higher than their damaging point. Care must be taken
since too much ice can cause the branches to break. The
fruit may be saved from the cold air, while the tree itself
may be damaged by too much protection.
Brief Review
Up to this point we have examined temperature varia-
tions on a daily basis. Before going on, here is a review
of some of the important concepts and facts we have
covered:
■ During the day, the earth’s surface and air above will
continue to warm as long as incoming energy (mainly
sunlight) exceeds outgoing energy from the surface.
■ At night, the earth’s surface cools, mainly by giving up
more infrared radiation than it receives—a process
called radiational cooling.
■ The coldest nights of winter normally occur when the
air is calm, fairly dry (low water-vapor content), and
cloud free.
■ The highest temperatures during the day and the low-
est temperatures at night are normally observed at the
earth’s surface.
■ Radiation inversions exist usually at night when the
air near the ground is colder than the air above.
The Controls of Temperature
The main factors that cause variations in temperature
from one place to another are called the controls of
temperature. In the previous chapter, we saw that
the greatest factor in determining temperature is the
amount of solar radiation that reaches the surface. This,
of course, is determined by the length of daylight hours
and the intensity of incoming solar radiation. Both of
these factors are a function of latitude; hence, latitude is
considered an important control of temperature. The
main controls are listed below.
1. latitude
2. land and water distribution
3. ocean currents
4. elevation
We can obtain a better picture of these controls by
examining Figs. 3.8 and 3.9, which show the average
monthly temperatures throughout the world for Janu-
ary and July. The lines on the map are isotherms—lines
connecting places that have the same temperature.
60 Chapter 3 Air Temperature
FIGURE 3.6
Wind machines mix cooler surface air with warmer air above.
FIGURE 3.7
A coating of ice protects these almond trees from damaging low
temperatures, as an early spring freeze drops air temperatures
well below freezing.
The Controls of Temperature 61
90 180 90 0
Longitude
60
30
0
30
60
Latitude
60
30
0
30
60
90
90 180 90 0
90
–30
–20
–10
0
10
20
30
40
50
60
70
80
80
70
60
50
40
30
–50
–40
–30
–20
–10
0
10
20
30
40
50
60
70
80
90
70
60
50
40
30
90
FIGURE 3.8
Average air temperature
near sea level in January
(°F).
Longitude
90 180 90 0
60
30
0
30
60
Latitude
60
30
0
30
60
90
90
180 90 0 90
40
50
60
70
80
70
60
50
30
20
10
0
–10
–20
–30
40
30
50
40
60
70
80
80
70
60
50
40
30
20
10
0
–10
100
90
90
FIGURE 3.9
Average air temperature
near sea level in July
(°F).
Because air temperature normally decreases with height,
cities at very high elevations are much colder than their
sea level counterparts. Consequently, the isotherms in
Figs. 3.8 and 3.9 are corrected to read at the same hori-
zontal level (sea level) by adding to each station above
sea level an amount of temperature that would corre-
spond to an average temperature change with height.*
Figures 3.8 and 3.9 show the importance of latitude
on temperature. Note that, on the average, temperatures
decrease poleward from the tropics and subtropics in
both January and July. However, because there is a
greater variation in solar radiation between low and
high latitudes in winter than in summer, the isotherms
in January are closer together (a tighter gradient)† than
they are in July. This means that if you travel from New
Orleans to Detroit in January, you are more likely to ex-
perience greater temperature variations than if you
make the same trip in July. Notice also in Figs. 3.8 and
3.9 that the isotherms do not run horizontally; rather, in
many places they bend, especially where they approach
an ocean-continent boundary.
On the January map, the temperatures are much
lower in the middle of continents than they are at the
same latitude near the oceans; on the July map, the re-
verse is true. The reason for these temperature varia-
tions can be attributed to the unequal heating and
cooling properties of land and water. For one thing, so-
lar energy reaching land is absorbed in a thin layer of
soil; reaching water, it penetrates deeply. Because water
is able to circulate, it distributes its heat through a much
deeper layer. Also, some of the solar energy striking the
water is used to evaporate it rather than heat it.
Another important reason for the temperature
contrasts is that water has a higher specific heat than
land. The specific heat of a substance is the amount of
heat needed to raise the temperature of one gram of a sub-
stance by one degree Celsius. It takes a great deal more
heat (about five times more) to raise the temperature of
a given amount of water by one degree than it does to
raise the temperature of the same amount of soil or rock
by one degree. Consequently, water has a much higher
specific heat than either of these substances. Water not
only heats more slowly than land, it cools more slowly
as well, and so the oceans act like huge heat reservoirs.
Thus, mid-ocean surface temperatures change relatively
little from summer to winter compared to the much
larger annual temperature changes over the middle of
continents.
Along the margin of continents, ocean currents of-
ten influence air temperatures. For example, along the
eastern margins, warm ocean currents transport warm
water poleward, while, along the western margins, they
transport cold water equatorward. As we will see in
Chapter 7, some coastal areas also experience upwelling,
which brings cold water from below to the surface.
Even large lakes can modify the temperature around
them. In summer, the Great Lakes remain cooler than the
land. As a result, refreshing breezes blow inland, bringing
relief from the sometimes sweltering heat. As winter ap-
proaches, the water cools more slowly than the land. The
first blast of cold air from Canada is modified as it crosses
the lakes, and so the first freeze is delayed on the eastern
shores of Lake Michigan.
Air Temperature Data
In the previous sections, we considered how air temper-
ature varies on a daily basis and from one place to an-
other. We will now focus on the ways temperature data
are organized and used.
DAILY, MONTHLY, AND YEARLY TEMPERATURES The
greatest variation in daily temperature occurs at
the earth’s surface. In fact, the difference between the
daily maximum and minimum temperature—called
the daily (diurnal) range of temperature—is greatest
next to the ground and becomes progressively smaller as
we move away from the surface (see Fig. 3.10). This
daily variation in temperature is also much larger on
clear days than on cloudy ones.
The largest diurnal range of temperature occurs on
high deserts, where the air is fairly dry, often cloud-free,
and there is little water vapor to radiate much infrared
energy back to the surface. By day, clear summer skies
allow the sun’s energy to quickly warm the ground
which, in turn, warms the air above to a temperature
sometimes exceeding 35°C (95°F). At night, the ground
cools rapidly by radiating infrared energy to space, and
the minimum temperature in these regions occasionally
dips below 5°C (41°F), thus giving a daily temperature
range of more than 30°C (54°F).
62 Chapter 3 Air Temperature
*The amount of change is usually less than the standard temperature lapse
rate of 3.6°F per 1000 feet (6.5°C per 1000 meters). The reason is that the
standard lapse rate is computed for altitudes above the earth’s surface in the
“free” atmosphere. In the less-dense air at high elevations, the absorption of
solar radiation by the ground causes an overall slightly higher temperature
than that of the free atmosphere at the same level.
†Gradient represents the rate of change of some quantity (in this case, tem-
perature) over a given distance.
In humid regions, the diurnal temperature range is
usually small. Here, haze and clouds lower the maxi-
mum temperature by preventing some of the sun’s en-
ergy from reaching the surface. At night, the moist air
keeps the minimum temperature high by absorbing the
earth’s infrared radiation and radiating a portion of it to
the ground. An example of a humid city with a small
summer diurnal temperature range is Charleston,
South Carolina, where the average July maximum tem-
perature is 32°C (90°F), the average minimum is 22°C
(72°F), and the diurnal range is only 10°C (18°F).
Cities near large bodies of water typically have
smaller diurnal temperature ranges than cities further
inland. This phenomenon is caused in part by the addi-
tional water vapor in the air and by the fact that water
warms and cools much more slowly than land.
Moreover, cities whose temperature readings are
obtained at airports often have larger diurnal tempera-
ture ranges than those whose readings are obtained in
downtown areas. The reason for this fact is that night-
time temperatures in cities tend to be warmer than
those in outlying rural areas. This nighttime city
warmth—called the urban heat island—is due to indus-
trial and urban development, a topic that will be treated
more completely in Chapter 12.
The average of the highest and lowest temperature
for a 24-hour period is known as the mean daily tem-
perature. Most newspapers list the mean daily temper-
ature along with the highest and lowest temperatures for
the preceding day. The average of the mean daily temper-
atures for a particular date averaged for a 30-year period
gives the average (or “normal”) temperatures for that
date. The average temperature for each month is the av-
erage of the daily mean temperatures for that month. Ad-
ditional information on the concept of “normal”
temperature is given in the Focus section on p. 64.
At any location, the difference between the average
temperature of the warmest and coldest months is called
the annual range of temperature. Usually the largest an-
nual ranges occur over land, the smallest over water.
Hence, inland cities have larger annual ranges than
coastal cities. Near the equator (because daylight length
varies little and the sun is always high in the noon sky),
annual temperature ranges are small, usually less than
3°C (5°F). Quito, Ecuador—on the equator at an eleva-
tion of 2850 m (9350 ft)—experiences an annual range
of less than 1°C. In middle and high latitudes, large sea-
sonal variations in the amount of sunlight reaching the
surface produce large temperature contrasts between
winter and summer. Here, annual ranges are large, espe-
cially in the middle of a continent. Yakutsk, in north-
eastern Siberia near the Arctic Circle, has an extremely
large annual temperature range of 62°C (112°F).
The average temperature of any station for the en-
tire year is the mean (average) annual temperature,
which represents the average of the twelve monthly av-
erage temperatures.* When two cities have the same
mean annual temperature, it might first seem that their
Air Temperature Data 63
One of the greatest temperature ranges ever recorded in
the Northern Hemisphere (56°C or 100°F) occurred at
Browning, Montana, on January 23, 1916, when the air
temperature plummeted from 7°C (44°F) to –49°C
(–56°F) in less than 24 hours. This huge temperature
range, however, would represent a rather typical day on
the planet Mars, where the average high temperature
reaches about –12°C (10°F) and the average low drops
to –79°C (–110°F), producing a daily temperature
range of 67°C, or 120°F.
Daily
maximum (
°
C)
Daily
range (
°
C)
Daily
minimum (
°
C)
300
200
100
17
°
18.5
°
19.5
°
021
°
13
°
13.5
°
14
°
13
°
980
650
330
0
Altitude (m)
Altitude (ft)
4
°
5
°
5.5
°
8
°
FIGURE 3.10
The daily range of temperature decreases as we climb away
from the earth’s surface. Hence, there is less day-to-night
variation in air temperature near the top of a high-rise
apartment complex than at the ground level.
*The mean annual temperature may be obtained by taking the sum of the 12
monthly means and dividing that total by 12, or by obtaining the sum of the
daily means and dividing that total by 365.
temperatures throughout the year are quite similar.
However, often this is not the case. For example, San
Francisco, California, and Richmond, Virginia, are at
the same latitude (37°N). Both have similar hours of
daylight during the year; both have the same mean an-
nual temperature—14°C (57°F). Here, the similarities
end. The temperature differences between the two cities
are apparent to anyone who has traveled to San Fran-
cisco during the summer with a suitcase full of clothes
suitable for summer weather in Richmond.
Figure 3.11 summarizes the average temperatures
for San Francisco and Richmond. Notice that the coldest
month for both cities is January. Even though January in
Richmond averages only 8°C (14°F) colder than January
in San Francisco, people in Richmond awaken to an av-
erage January minimum temperature of –6°C (21°F),
which is much colder than the lowest temperature ever
recorded in San Francisco. Trees that thrive in San Fran-
cisco’s weather would find it difficult surviving a winter
in Richmond. So, even though San Francisco and Rich-
mond have the same mean annual temperature, the be-
havior and range of their temperatures differ greatly.
THE USE OF TEMPERATURE DATA An application of
daily temperature developed by heating engineers in es-
timating energy needs is the heating degree-day. The
heating degree-day is based on the assumption that
people will begin to use their furnaces when the mean
64 Chapter 3 Air Temperature
When the weathercaster reports
that “the normal high temperature
for today is 68°F” does this mean
that the high temperature on this
day is usually 68°F? Or does it
mean that we should expect a
high temperature near 68°F?
Actually, we should expect neither
one.
Remember that the word normal,
or norm, refers to weather data
averaged over a period of 30
years. For example, Fig. 1 shows
the high temperature measured for
30 years in a southwestern city on
March 15. The average (mean)
high temperature for this period is
68°F; hence, the normal high
temperature for this date is 68°F
(dashed line). Notice, however, that
only on one day during this 30-year
period did the high temperature ac-
tually measure 68°F (large red dot).
In fact, the most common high
temperature (called the mode) was
60°F, and occurred on 4 days (blue
dots).
So what would be considered a
typical high temperature for this
date? Actually, any high temperature
that lies between about 47°F and
89°F (two standard deviations* on
either side of 68°F) would be consid-
ered typical for this day. While a
high temperature of 80°F may be
quite warm and a high temperature
of 47°F may be quite cool, they are
both no more uncommon (unusual)
than a high temperature of 68°F,
which is the normal high temperature
for the 30-year period. This same
type of reasoning applies to normal
rainfall, as the actual amount of
precipitation will likely be greater or
less than the 30-year average.
WHEN IT COMES TO TEMPERATURE, WHAT’S NORMAL?
Focus on a Special Topic
100
90
80
70
60
50
40
Temperature (°F)
1970 1975 1980 1985 1990 1995 2000
Year
FIGURE 1
The high temperature measured (for 30 years) on March 15 in a city located in the south-
western United States. The dashed line represents the normal temperature for the 30-year
period.
*A standard deviation is a statistical measure of the
spread of the data. Two standard deviations for this
set of data mean that 95 percent of the time the
high temperature occurs between 47°F and 89°F.
daily temperature drops below 65°F. Therefore, heating
degree-days are determined by subtracting the mean
temperature for the day from 65°F. Thus, if the mean
temperature for a day is 64°F, there would be 1 heating
degree-day on this day.*
On days when the mean temperature is above 65°F,
there are no heating degree-days. Hence, the lower the
average daily temperature, the more heating degree-
days and the greater the predicted consumption of fuel.
When the number of heating degree-days for a whole
year is calculated, the heating fuel requirements for any
location can be estimated. Figure 3.12 shows the yearly
average number of heating degree-days in various loca-
tions throughout the United States.
As the mean daily temperature climbs above 65°F,
people begin to cool their indoor environment. Conse-
quently, an index, called the cooling degree-day, is used
during warm weather to estimate the energy needed to
cool indoor air to a comfortable level. The forecast of
mean daily temperature is converted to cooling degree-
days by subtracting 65°F from the mean. The remaining
value is the number of cooling degree-days for that day.
For example, a day with a mean temperature of 70°F
would correspond to (70–65), or 5 cooling degree-days.
High values indicate warm weather and high power
production for cooling (see Fig. 3.13).
Knowledge of the number of cooling degree-days
in an area allows a builder to plan the size and type of
equipment that should be installed to provide adequate
air conditioning. Also, the forecasting of cooling de-
gree-days during the summer gives power companies a
way of predicting the energy demand during peak en-
ergy periods. A composite of heating plus cooling de-
gree-days would give a practical indication of the energy
requirements over the year.
Farmers use an index, called growing degree-days,
as a guide to planting and for determining the approxi-
mate dates when a crop will be ready for harvesting. A
growing degree-day for a particular crop is defined as a
day on which the mean daily temperature is one degree
above the base temperature (also known as the zero tem-
perature)—the minimum temperature required for
growth of that crop. For sweet corn, the base tempera-
ture is 50°F and, for peas, it is 40°F.
On a summer day in Iowa, the mean temperature
might be 80°F. From Table 3.1, we can see that, on this
day, sweet corn would accumulate (80–50), or 30 grow-
ing degree-days. Theoretically, sweet corn can be har-
vested when it accumulates a total of 2200 growing de-
gree-days. So, if sweet corn is planted in early April and
each day thereafter averages about 20 growing degree-
days, the corn would be ready for harvest about 110
days later, or around the middle of July.
At one time, corn varieties were rated in terms of
“days to maturity.” This rating system was unsuccessful
because, in actual practice, corn took considerably
longer in some areas than in others. This discrepancy
was the reason for defining “growing degree-days.”
Hence, in humid Iowa, where summer nighttime tem-
peratures are high, growing degree-days accumulate
much faster. Consequently, the corn matures in consid-
erably fewer days than in the drier west, where summer
nighttime temperatures are lower, and each day accu-
mulates fewer growing degree-days. Although moisture
and other conditions are not taken into account, grow-
ing degree-days nevertheless serve as a useful guide in
forecasting approximate dates of crop maturity.
Air Temperature Data 65
*In the United States, the National Weather Service and the Department of
Agriculture use degrees Fahrenheit in their computations.
Richmond
San Francisco
°FJFMAMJJASOND°C
30
25
20
15
10
5
0
80
70
60
50
40
30
Mean annual
temperature
Annual temperature
range
Record high
Record low
°C
14
6
39
–3
°F
57
11
103
27
°F
57
40
105
–12
°C
14
22
41
–24
SAN FRANCISCO
RICHMOND
FIGURE 3.11
Temperature data for San Francisco, California (37°N) and
Richmond, Virginia (37°N)—two cities with the same mean
annual temperature.
Air Temperature and Human Comfort
Probably everyone realizes that the same air temperature
can feel differently on different occasions. For example, a
temperature of 20°C (68°F) on a clear, windless March
afternoon in New York City can almost feel balmy after a
long, hard winter. Yet, this same temperature may feel
uncomfortably cool on a summer afternoon in a stiff
breeze. The human body’s perception of temperature ob-
viously changes with varying atmospheric conditions.
The reason for these changes is related to how we ex-
change heat energy with our environment.
The body stabilizes its temperature primarily by
converting food into heat (metabolism). To maintain a
constant temperature, the heat produced and absorbed
66 Chapter 3 Air Temperature
10
8
8
10
10
10
8
6
4
6
6
6
4
4
8
8
8
2
2
1.5
2
1.5
11
2
2
1.5
1
0.5
1
0.5
6
4
6
6
FIGURE 3.12
Mean annual total heating degree-
days in thousands of °F, where the
number 4 on the map represents
4000 (base 65°F).
0
0
0
0.5
0.5
0.5
0
0.5
1
2
3
4
3
3
0.5
3
2
2
0.5
0
0
2
4
1
2
3
3
4
2
0.5
1
1
0.5
0.5
0.5
0.5
0.5
FIGURE 3.13
Mean annual total cooling degree-
days in thousands of °F, where the
number 1 on the map represents
1000 (base 65°F).
Beans (Snap/South 50 1200–1300
Carolina)
Corn (Sweet/Indiana) 50 2200–2800
Cotton (Delta Smooth 60 1900–2500
Leaf/Arkansas)
Peas (Early/Indiana) 40 1100–1200
Rice (Vegold/Arkansas) 60 1700–2100
Wheat (Indiana) 40 2100–2400
TABLE 3.1 Estimated Growing Degree-Days for Certain
Agricultural Crops to Reach Maturity
Base Growing
Crop (Variety, Temperature Degree-Days
Location) (°F) to Maturity
by the body must be equal to the heat it loses to its sur-
roundings. There is, therefore, a constant exchange of
heat—especially at the surface of the skin—between the
body and the environment.
One way the body loses heat is by emitting infrared
energy. But we not only emit radiant energy, we absorb
it as well. Another way the body loses and gains heat is
by conduction and convection, which transfer heat to
and from the body by air motions. On a cold day, a thin
layer of warm air molecules forms close to the skin, pro-
tecting it from the surrounding cooler air and from the
rapid transfer of heat. Thus, in cold weather, when the
air is calm, the temperature we perceive—called the
sensible temperature—is often higher than a ther-
mometer might indicate. (Could the opposite effect oc-
cur where the air temperature is very high and a person
might feel exceptionally cold? If you are unsure, read the
Focus section above.)
Once the wind starts to blow, the insulating layer
of warm air is swept away, and heat is rapidly removed
from the skin by the constant bombardment of cold
air. When all other factors are the same, the faster the
wind blows, the greater the heat loss, and the colder we
feel. How cold the wind makes us feel is usually ex-
pressed as a wind-chill factor. The wind-chill charts
(Tables 3.2 and 3.3) translate the ability of the air to
take heat away from the human body with wind (its
cooling power) into a wind-chill equivalent tempera-
ture with no wind. For example, notice that, in Table
3.2, an air temperature of 20°F with a wind speed of
30 mi/hr produces a wind-chill equivalent tempera-
ture of –18°F. This means that exposed skin would lose
as much heat in one minute in air with a temperature
of 20°F and a wind speed of 30 mi/hr as it would in
calm air with a temperature of –18°F. Of course, how
cold we feel actually depends on a number of factors,
including the fit and type of clothing we wear, and the
amount of exposed skin.*
High winds, in below-freezing air, can remove heat
from exposed skin so quickly that the skin may actually
freeze and discolor. The freezing of skin, called frostbite,
usually occurs on the body extremities first because they
are the greatest distance from the source of body heat.
Air Temperature and Human Comfort 67
*There is concern among some scientists that the current derived wind-chill
temperatures are usually lower than they should be. Consequently, a revised
wind-chill table may be used by the National Weather Service in the future.
Is there somewhere in our atmos-
phere where the air temperature can
be exceedingly high (say above
500°C or 900°F) yet a person might
feel extremely cold? There is a
region, but it’s not at the earth’s
surface.
You may recall from Chapter 1
that in the upper reaches of our
atmosphere (in the middle and
upper thermosphere), air temper-
atures may exceed 500°C. How-
ever, a thermometer shielded from
the sun in this region of the atmo-
sphere would indicate an extremely
low temperature. This apparent
discrepancy lies in the meaning of
air temperature and how we
measure it.
In Chapter 2, we learned that the
air temperature is directly related to
the average speed at which the air
molecules are moving—faster
speeds correspond to higher temper-
atures. In the middle and upper ther-
mosphere, air molecules are zipping
about at speeds corresponding to
extremely high temperatures.
However, in order to transfer
enough energy to heat something up
by conduction (exposed skin or a
thermometer bulb), an extremely
large number of molecules must
collide with the object. In the “thin”
air of the upper atmosphere, air
molecules are moving
extraordinarily fast, but there are
simply not enough of them bouncing
against the thermometer bulb for it to
register a high temperature. In fact,
when properly shielded from the sun,
the thermometer bulb loses far more
energy than it receives and indicates
a temperature near absolute zero.
This explains why an astronaut, when
space walking, will not only survive
temperatures exceeding 500°C, but
will also feel a profound coldness
when shielded from the sun’s radiant
energy. At these high altitudes, the
traditional meaning of air
temperature (that is, regarding how
“hot” or “cold” something feels) is no
longer applicable.
A THOUSAND DEGREES AND FREEZING TO DEATH
Focus on a Special Topic
During the Korean War, over one-quarter of the United
States’ troop casualties were caused by frostbite during
the winter campaign of 1950–1951.
In cold weather, wet skin can be a factor in how
cold we feel. A cold, rainy day (drizzly, or even foggy)
often feels colder than a “dry” one because water on ex-
posed skin conducts heat away from the body better
than air does. In fact, in cold, wet, and windy weather a
person may actually lose body heat faster than the body
can produce it. This may even occur in relatively mild
weather with air temperatures as high as 10°C (50°F).
The rapid loss of body heat may lower the body tem-
perature below its normal level and bring on a condi-
tion known as hypothermia—the rapid, progressive
mental and physical collapse that accompanies the low-
ering of human body temperature.
The first symptom of hypothermia is exhaustion. If
exposure continues, judgment and reasoning power be-
gin to disappear. Prolonged exposure, especially at tem-
peratures near or below freezing, produces stupor,
collapse, and death when the internal body temperature
drops to about 26°C (79°F).
In cold weather, heat is more easily dissipated
through the skin. To counteract this rapid heat loss, the
peripheral blood vessels of the body constrict, cutting off
the flow of blood to the outer layers of the skin. In hot
weather, the blood vessels enlarge, allowing a greater loss
of heat energy to the surroundings. In addition to this
we perspire. As evaporation occurs, the skin cools. When
the air contains a great deal of water vapor and it is close
to being saturated, perspiration does not readily evapo-
rate from the skin. Less evaporational cooling causes
most people to feel hotter than it really is, and a number
of people start to complain about the “heat and humid-
ity.” (A closer look at how we feel in hot weather will be
given in Chapter 4, after we have examined the concepts
of relative humidity and wet-bulb temperature.)
Measuring Air Temperature
Thermometers were developed to measure air tempera-
ture. Each thermometer has a definite scale and is cali-
brated so that a thermometer reading of 0°C in
Vermont will indicate the same temperature as a ther-
mometer with the same reading in North Dakota. If a
68 Chapter 3 Air Temperature
5
32 27 22 16 11 6 0 –5 –10 –15 –21 –26 –31 –36 –42 –47 –52
10 22 16 10 3 –3 –9 –15 –22 –27 –34 –40 –46 –52 –58 –64 –71 –77
15 16 9 2 –5 –11 –18 –25 –31 –38 –45 –51 –58 –65 –72 –78 –85 –92
20 12 4 –3 –10 –17 –24 –31 –39 –46 –53 –60 –67 –74 –81 –88 –95 –103
25 8 1 –7 –15 –22 –29 –36 –44 –51 –59 –66 –74 –81 –88 –96 –103 –110
30 6 –2 –10 –18 –25 –33 –41 –49 –56 –64 –71 –79 –86 –93 –101 –109 –116
35 4 –4 –12 –20 –27 –35 –43 –52 –58 –67 –74 –82 –89 –97 –105 –113 –120
40 3 –5 –13 –21 –29 –37 –45 –53 –60 –69 –76 –84 –92 –100 –107 –115 –123
45 2 –6 –14 –22 –30 –38 –46 –54 –62 –70 –78 –85 –93 –102 –109 –117 –125
TABLE 3.2 Wind-Chill Equivalent Temperature (°F). A 20-mi/hr Wind Combined with
an Air Temperature of 10°F Produces a Wind-Chill Equivalent Temperature of –24°F
Air Temperature (°F)
35 30 25 20 15 10 5 0 –5 –10 –15 –20 –25 –30 –35 –40 –45
Wind Speed (mi/hr)
Calm 8 4 0 –4 –8 –12 –16 –20 –24 –28 –32 –36 –40 –44
10 5 0 –4 –8 –13 –17 –22 –26 –31 –35 –40 –44 –49 –53
20 0 –5 –10 –15 –21 –26 –31 –36 –42 –47 –52 –57 –63 –68
30 –3 –8 –14 –20 –25 –31 –37 –43 –48 –54 –60 –65 –71 –77
40 –5 –11 –17 –23 –29 –35 –41 –47 –53 –59 –65 –71 –77 –83
50 –6 –12 –18 –25 –31 –37 –43 –49 –56 –62 –68 –74 –80 –87
60 –7 –13 –19 –26 –32 –39 –45 –51 –58 –64 –70 –77 –83 –89
TABLE 3.3 Wind-Chill Equivalent Temperature (°C)
Air Temperature (°C)
8 4 0 –4 –8 –12 –16 –20 –24 –28 –32 –36 –40 –44
Wind Speed (km/hr)
particular reading were to represent different degrees of
hot or cold, depending on location, thermometers
would be useless.
Liquid-in-glass thermometers are often used for
measuring surface air temperature because they are easy
to read and inexpensive to construct. These thermome-
ters have a glass bulb attached to a sealed, graduated
tube about 25 cm (10 in.) long. A very small opening, or
bore, extends from the bulb to the end of the tube. A
liquid in the bulb (usually mercury or red-colored alco-
hol) is free to move from the bulb up through the bore
and into the tube. When the air temperature increases,
the liquid in the bulb expands, and rises up the tube.
When the air temperature decreases, the liquid con-
tracts, and moves down the tube. Hence, the length of
the liquid in the tube represents the air temperature. Be-
cause the bore is very narrow, a small temperature
change will show up as a relatively large change in the
length of the liquid column.
Maximum and minimum thermometers are liq-
uid-in-glass thermometers used for determining daily
maximum and minimum temperatures. The maxi-
mum thermometer looks like any other liquid-in-glass
thermometer with one exception: It has a small con-
striction within the bore just above the bulb (see Fig.
3.14). As the air temperature increases, the mercury ex-
pands and freely moves past the constriction up the
tube, until the maximum temperature occurs. However,
as the air temperature begins to drop, the small con-
striction prevents the mercury from flowing back into
the bulb. Thus, the end of the stationary mercury col-
umn indicates the maximum temperature for the day.
The mercury will stay at this position until either the air
warms to a higher reading or the thermometer is reset
by whirling it on a special holder and pivot. Usually, the
whirling is sufficient to push the mercury back into the
bulb past the constriction until the end of the column
indicates the present air temperature.*
A minimum thermometer measures the lowest
temperature reached during a given period. Most min-
imum thermometers use alcohol as a liquid, since it
freezes at a temperature of –130°C compared to –39°C
for mercury. The minimum thermometer is similar to
other liquid-in-glass thermometers except that it con-
tains a small barbell-shaped index marker in the bore
(see Fig. 3.15). The small index marker is free to slide
back and forth within the liquid. It cannot move out of
the liquid because the surface tension at the end of the
liquid column (the meniscus) holds it in.
A minimum thermometer is mounted horizon-
tally. As the air temperature drops, the contracting liq-
uid moves back into the bulb and brings the index
marker down the bore with it. When the air tempera-
ture stops decreasing, the liquid and the index marker
stop moving down the bore. As the air warms, the alco-
hol expands and moves freely up the tube past the sta-
tionary index marker. Because the index marker does
not move as the air warms, the minimum temperature
is read by observing the upper end of the marker.
To reset a minimum thermometer, simply tip it
upside down. This allows the index marker to slide to
the upper end of the alcohol column, which is indicat-
ing the current air temperature. The thermometer is
then remounted horizontally, so that the marker will
move toward the bulb as the air temperature decreases.
Highly accurate temperature measurements may
be made with electrical thermometers, such as the
thermistor and the electrical resistance thermometer. Both
Measuring Air Temperature 69
*Thermometers that measure body temperature are maximum thermome-
ters, which is why they are shaken both before and after you take your tem-
perature.
Constriction
Liquid
Bulb
Bore
Temperature scale
FIGURE 3.14
A section of a maximum thermometer.
Minimum temperature (56°)
Current temperature (61°)
50 60
Bore
Index marker Meniscus
FIGURE 3.15
A section of a minimum thermometer showing both the
current air temperature and the minimum temperature.
of these instruments measure the electrical resistance of
a particular material. Since the resistance of the material
chosen for these thermometers changes as the temper-
ature changes, a meter can measure the resistance and
be calibrated to represent air temperature.*
Air temperature may also be obtained with instru-
ments called infrared sensors, or radiometers. Radiom-
eters do not measure temperature directly; rather, they
measure emitted radiation (usually infrared). By mea-
suring both the intensity of radiant energy and the
wavelength of maximum emission of a particular gas
(either water vapor or carbon dioxide), radiometers in
orbiting satellites are now able to estimate the air tem-
perature at selected levels in the atmosphere.
A bimetallic thermometer consists of two different
pieces of metal (usually brass and iron) welded together
to form a single strip. As the temperature changes, the
brass expands more than the iron, causing the strip to
bend. The small amount of bending is amplified through
a system of levers to a pointer on a calibrated scale. The
bimetallic thermometer is usually the temperature-sens-
ing part of the thermograph, an instrument that mea-
sures and records temperature (see Fig. 3.16). (Chances
are, you may have heard someone exclaim something
like, “Today the thermometer measured 90 degrees in the
shade!” Does this mean that the air temperature was
higher in the sun? If you are unsure of the answer, read
the Focus section above before reading the next section,
on instrument shelters.)
Thermometers and other instruments are usually
housed in an instrument shelter (see Fig. 3.17). The
shelter completely encloses the instruments, protecting
them from rain, snow, and the sun’s direct rays. It is
70 Chapter 3 Air Temperature
When we measure air temperature
with a common liquid thermometer,
an incredible number of air mole-
cules bombard the bulb, transferring
energy either to or away from it.
When the air is warmer than the
thermometer, the liquid gains
energy, expands, and rises up the
tube; the opposite will happen when
the air is colder than the ther-
mometer. The liquid stops rising (or
falling) when equilibrium between
incoming and outgoing energy is es-
tablished. At this point, we can read
the temperature by observing the
height of the liquid in the tube.
It is impossible to measure air
temperature accurately in direct sun-
light because the thermometer
absorbs radiant energy from the sun
in addition to energy from the air
molecules. The thermometer gains
energy at a much faster rate than it
can radiate it away, and the liquid
keeps expanding and rising until
there is equilibrium between incom-
ing and outgoing energy. Because of
the direct absorption of solar energy,
the level of the liquid in the ther-
mometer indicates a temperature
much higher than the actual air tem-
perature, and so a statement that
says “today the air temperature mea-
sured 100 degrees in the sun” has
no meaning. Hence, a thermometer
must be kept in a shady place to
measure the temperature of the air
accurately.
THERMOMETERS SHOULD BE READ IN THE SHADE
Focus on an Observation
12
2
46
8
10
2
4
0
–2
–4
Pen
6
8
Record paper
on cylinder
Ink trace
Protective case
Exposed
metallic
strip
Amplifying
levers
FIGURE 3.16
The thermograph with a bimetallic
thermometer.
*Electrical resistance thermometers are the type of thermometer used in
measuring air temperature in the over 900 fully automated surface weather
stations (known as ASOS, for Automated Surface Observing System) that ex-
ist at airports and military facilities throughout the United States.
painted white to reflect sunlight, faces north to avoid
direct exposure to sunlight, and has louvered sides, so
that air is free to flow through it. This construction
helps to keep the air inside the shelter at the same tem-
perature as the air outside.
The thermometers inside a standard shelter are
mounted about 1.5 to 2 m (5 to 6 ft) above the ground.
Because air temperatures vary considerably above dif-
ferent types of surfaces, shelters are usually placed over
grass to ensure that the air temperature is measured at
the same elevation over the same type of surface. Un-
fortunately, some shelters are placed on asphalt, others
sit on concrete, while others are located on the tops of
tall buildings, making it difficult to compare air tem-
perature measurements from different locations. In fact,
if either the maximum or minimum air temperature in
your area seems suspiciously different from those of
nearby towns, find out where the instrument shelter is
situated.
Summary
The daily variation in air temperature near the earth’s
surface is controlled mainly by the input of energy from
the sun and the output of energy from the surface. On a
clear, calm day, the surface air warms, as long as heat in-
put (mainly sunlight) exceeds heat output (mainly con-
vection and radiated infrared energy). The surface air
cools at night, as long as heat output exceeds input. Be-
cause the ground at night cools more quickly than the air
above, the coldest air is normally found at the surface
where a radiation inversion usually forms. When the air
temperature in agricultural areas drops to dangerously
low readings, fruit trees and grape vineyards can be pro-
tected from the cold by a variety of means, from mixing
the air to spraying the trees and vines with water.
The greatest daily variation in air temperature occurs
at the earth’s surface. Both the diurnal and annual range of
temperature are greater in dry climates than in humid
ones. Even though two cities may have similar average an-
nual temperatures, the range and extreme of their tem-
peratures can differ greatly. Temperature information
influences our lives in many ways, from deciding what
clothes to take on a trip to providing critical information
for energy-use predictions and agricultural planning. We
reviewed some of the many types of thermometers in use:
maximum, minimum, bimetallic, electrical, radiometer.
Those designed to measure air temperatures near the sur-
face are housed in instrument shelters to protect them
from direct sunlight and precipitation.
Key Terms
The following terms are listed in the order they appear
in the text. Define each. Doing so will aid you in re-
viewing the material covered in this chapter.
Key Terms
71
FIGURE 3.17
An instrument shelter protects the instruments inside from the
weather elements.
radiational cooling
radiation inversion
thermal belt
orchard heater
wind machine
freeze
controls of temperature
isotherm
specific heat
daily (diurnal) range of
temperature
mean (average) daily
temperature
annual range of
temperature
mean annual
temperature
heating degree-day
cooling degree-day
growing degree-day
sensible temperature
wind-chill factor