- Trang chủ >>
- Khoa Học Tự Nhiên >>
- Vật lý
Fundamentals Of Geophysical Fluid Dynamics Part 7 pdf
Bạn đang xem bản rút gọn của tài liệu. Xem và tải ngay bản đầy đủ của tài liệu tại đây (513.25 KB, 29 trang )
5.3 Turbulent Baroclinic Zonal Jet 203
Reynolds stress, R, divergence redistributes the zonal momentum in y,
increasing the eastward momentum in the jet core and decreasing it at
the jet edges (a.k.a. negative eddy viscosity since the Reynolds stress is
an up-gradient momentum flux relative to the mean horizontal shear).
However, R it cannot have any integrated effect since
L
y
0
dy
∂R
∂y
= R
L
y
0
= 0 (5.89)
due to the meridional boundary conditions (cf., Sec. 5.4). In the bottom
layer eastward momentum is transmitted downward by the isopycnal
form stress (i.e., +D
2.5
), and it is balanced almost entirely by the to-
pographic and turbulent bottom stress because the abyssal R
N
is quite
weak. The shape for R(y) can be interpreted either in terms of radi-
ating Rossby waves (Sec. 5.4) or as a property of the linearly unstable
eigenmodes for
u
n
(y) (not shown here; cf., Sec. 3.3.3 for barotropic
eigenmodes). When L
y
, L
τ
L
β
R, multiple jet cores can occur
through the up-gradient fluxes by R, each with a meridional scale near
L
β
. The scale relation, L
y
L
β
, is only marginally satisfied for the
westerly winds, but it is more likely true for the ACC, and some obser-
vational evidence indicates persistent multiple jet cores there.
5.3.4 Potential Vorticity Homogenization
From (5.27), (5.84), and (5.88), the mean zonal momentum balance
(5.82) can be rewritten more concisely as
∂u
n
∂t
[ = 0 ] =
v
n
q
QG,n
+
ˆ
x ·
F
n
, (5.90)
after doing zonal integrations by parts. This shows that the eddy–mean
interaction for a baroclinic zonal-channel flow is entirely captured by
the meridional eddy potential vorticity flux that combines the Reynolds
stress and isopycnal form stress divergences:
v
n
q
QG,n
= −
D
1.5
H
1
−
∂R
1
∂y
, n = 1
=
D
n−.5
− D
n+.5
H
n
−
∂R
n
∂y
, 2 ≤ n ≤ N −1
=
D
N−.5
− D
bot
H
N
−
∂R
N
∂y
, n = N . (5.91)
In the vertical interior where
F
n
is small, (5.90) indicates that v
n
q
QG,n
204 Baroclinic and Jet Dynamics
is also small. Since q
QG
is approximately conserved following parcels
in (5.26), a fluctuating Lagrangian meridional parcel displacement, r
y
,
generates a potential vorticity fluctuation,
q
QG
≈ −r
y
d
q
QG
dy
, (5.92)
since potential vorticity is approximately conserved along trajectories
(cf., Sec. 3.5). For nonzero r
y
, due to nonzero v
, the required small-
ness of the eddy potential vorticity flux can be accomplished if q
QG
is
small as a consequence of d
y
q
QG
being small. This is an explanation for
the homogenized structure for the mid-depth potential vorticity profile,
q
QG,2
(y), seen in the second-row plots in Fig. 5.14. Furthermore, the
variance for q
QG,2
(not shown) is also small even though the variances
of other interior quantities are not small (Fig. 5.15).
Any other material tracer, τ, that is without either significant interior
source or diffusion terms, S
(τ)
in (2.8), or boundary fluxes that maintain
a mean gradient,
τ(y), will be similarly homogenized by eddy mixing in
a statistical equilibrium state.
5.3.5 Meridional Overturning Circulation and Mass Balance
The relation (5.22), which expresses the movement of the interfaces as
material surfaces, is single-valued in w at each interface because of the
quasigeostrophic approximation (Sec. 5.1.2). In combination with the
Ekman pumping at the interior edges of the embedded turbulent bound-
ary sub-layers (Secs. 5.3.1 and 6.1), w is a vertically continuous, piece-
wise linear function of depth within each layer. The time and zonal
mean vertical velocity at the interior interfaces is
w
n+.5
=
∂
∂y
v
g, n+.5
η
n+.5
= −
1
f
0
∂
∂y
D
n+.5
(5.93)
for 1 ≤ n ≤ N − 1 (i.e., ,
w is forced by the isopycnal form stress
in the interior). The vertical velocities at the vertical boundaries are
determined from the kinematic conditions. At the rigid lid (Sec. 2.2.3),
w = 0, and at the bottom,
w = u
N
· ∇∇∇B ≈
∂
∂y
v
g, N
B = −
1
f
0
∂
∂y
D
bot
,
5.3 Turbulent Baroclinic Zonal Jet 205
from (5.86). Substituting the mean vertical velocity into the mean con-
tinuity relation (5.81) and integrating in y yields
v
a, 1
= −
D
1.5
f
0
H
1
v
a, n
=
D
n−.5
− D
n+.5
f
0
H
n
, 2 ≤ n ≤ N −1
v
a, N
=
D
N−.5
− D
bot
f
0
H
N
. (5.94)
From the structure of the D
n+.5
(y) in Fig. 5.17, the meridional over-
turning circulation can be deduced. Because D(y) has a positive ex-
tremum at the jet center, (5.93) implies that
w(y) is upward on the
southern side of the jet and downward on the northern side. Mass con-
servation for the meridional overturning circulation is closed in the sur-
face layer with a strong northward flow. In (5.94) this ageostrophic
flow,
v
a, 1
> 0, is related to the downward isopycnal form stress, but in
the zonal momentum balance for the surface layer (5.82) combined with
(5.83) and (5.99), it is closely tied to the eastward surface stress as an
Ekman transport (Sec. 6.1). Depending upon whether D(z) decreases
or increases with depth, (5.94) implies that
v
a
is southward or north-
ward in the interior. In the particular solution in Fig. 5.17, D weakly
increases between interfaces n + .5 = 1.5 and 2.5 because R
n
decreases
with depth in the middle of the jet. So
v
a, 2
is weakly northward in
the jet center. Because D
N−1
> 0, the bottom layer flow is southward,
v
a, N
< 0. Furthermore, since the bottom-layer zonal flow is eastward,
u
N
> 0, the associated bottom stress in (5.94) provides an augmenta-
tion to the southward
v
a, N
(n.b., this contribution is called the bottom
Ekman transport; Sec. 6.1). Collectively, this structure accounts for the
clockwise Deacon Cell depicted in Figs. 5.13-5.14.
In a layered model the pointwise continuity equation is embodied in
the layer thickness equation (5.18) that also embodies the parcel conser-
vation of density. Its time and zonal mean reduces to
∂
∂y
h
n
v
n
= 0 =⇒ h
n
v
n
= 0 , (5.95)
using a boundary condition for no flux at some (remote) latitude to
determine the meridional integration constant. In equilibrium there is
no meridional mass flux within each isopycnal layer in an adiabatic fluid
because the layer boundaries (bottom, interfaces, and lid) are material
206 Baroclinic and Jet Dynamics
surfaces. This relation can be rewritten as
h
n
v
n
= H
n
v
a, n
+ (h
n
− H
n
) v
g,n
= 0 (5.96)
(cf., (5.83)). There is an exact cancelation between the mean advective
mass flux (the first term) and the eddy-induced mass transport (the
second term) within each isopycnal layer. The same conclusion about
cancellation between the mean and eddy transports could be drawn for
any non-diffusing tracer that does not cross the material interfaces.
Re-expressing the eddy mass flux in terms of a meridional eddy-induced
transport velocity or bolus velocity defined by
V
∗
n
=
1
H
n
(h
n
− H
n
) v
g,n
, (5.97)
the cancellation relation (5.96) becomes simply
v
a, n
= −V
∗
n
.
There is a companion vertical component to the eddy-induced velocity,
W
∗
n+.5
, that satisfies a continuity equation with the horizontal compo-
nent, analogous to the 2D mean continuity balance (5.81). In a zonally
symmetric channel flow, the eddy-induced velocity is 2D, as is its conti-
nuity balance:
∂V
∗
n
∂y
+
1
H
n
W
∗
n−.5
− W
∗
n+.5
= 0 . (5.98)
U
∗
= (0, V
∗
, W
∗
) has zero normal flow at the domain boundaries (e.g.,
W
∗
.5
= 0 at the top surface). Together these components of the eddy-
induced meridional overturning circulation exactly cancel the Eulerian
mean Deacon Cell circulation, (0,
v
a
, w). One can interpret U
∗
as a
Lagrangian mean circulation induced by the eddies that themselves have
a zero Eulerian mean velocity. It is therefore like a Stokes drift (Sec.
4.5), but one caused by the mesoscale eddy velocity field rather than the
surface or inertia-gravity waves. The mean fields for both mass and other
material concentrations move with (i.e., are advected by) the sum of the
Eulerian mean and eddy-induced Lagrangian mean velocities. Here the
fact that their sum is zero in the meridional plane is due to the adiabatic
assumption.
Expressing h in terms of the interface displacements, η, from (5.19)
and D from (5.87), the mass balance (5.96) can be rewritten as
(h
n
− H
n
) v
g,n
= − H
n
v
a, n
5.3 Turbulent Baroclinic Zonal Jet 207
=
1
f
0
D
1.5
, n = 1
= −
1
f
0
(D
n−.5
− D
n+.5
) , 2 ≤ n ≤ N −1
= −
1
f
0
(D
N−.5
− D
bot
) , n = N . (5.99)
This demonstrates an equivalence between the vertical isopycnal form
stress divergence and the lateral eddy mass flux within an isopycnal
layer.
5.3.6 Meridional Heat Balance
The buoyancy field, b, is proportional to η in (5.23). If the buoyancy
is controlled by the temperature, T (e.g., as in the simple equation of
state used here, b = αgT ), then the interfacial temperature fluctuation
is defined by
T
n+.5
= −
2g
n+.5
αg(H
n
+ H
n+1
)
η
n+.5
. (5.100)
With this definition the meridional eddy heat flux is equivalent to the in-
terfacial form stress (5.87), hence layer mass flux (5.99), by the following
relation:
vT
n+.5
=
f
0
N
2
n+.5
αg
D
n+.5
. (5.101)
The mean buoyancy frequency is defined by
N
2
n+.5
=
2g
n+.5
H
n
+ H
n+1
analogous to (4.17). Since D > 0 in the jet (Fig. 5.17),
vT < 0; i.e.,
the eddy heat flux is poleward in the ACC (cf., Sec. 5.2.3). The profile
for
T
n+.5
(y) (Fig. 5.14) indicates that this is a down-gradient eddy heat
flux associated with release of mean available potential energy. These
behaviors are hallmarks of baroclinic instability (Sec. 5.2).
The equilibrium heat balance at the layer interfaces is obtained by a
reinterpretation of (5.93), replacing η by T from (5.100):
∂
∂t
T
n+.5
[ = 0 ] = −
∂
∂y
[
vT
n+.5
] −w
n+.5
∂
z
T
n+.5
. (5.102)
The background vertical temperature gradient, ∂
z
T
n+.5, z
= N
2
n+.5
/αg,
is the mean stratification expressed in terms of temperature. Thus, the
208 Baroclinic and Jet Dynamics
horizontal eddy heat-flux divergence is balanced by the mean vertical ad-
vection of the background temperature stratification in the equilibrium
state.
5.3.7 Maintenance of the General Circulation
In summary, the eddy fluxes for momentum, mass, and heat play essen-
tial roles in the equilibrium dynamical balances for the jet. In particular,
D is the most important eddy flux, accomplishing the essential transport
to balance the mean forcing. For the ACC the mean forcing is a surface
stress, and D is most relevantly identified as the interfacial form stress
that transfers the surface stress downward to push against the bottom
(cf., 5.85). For the atmospheric westerly winds, the mean forcing is the
differential heating with latitude, and D plays the necessary role as the
balancing poleward heat flux. Of course, both roles for D are played
simultaneously in each case. The outcome in each case is an upward-
intensified, meridionally sheared zonal mean flow, with associated slop-
ing isopycnal and isothermal surfaces in thermal wind balance. It is also
true that the horizontal Reynolds stress, R, contributes to the zonal
mean momentum balance and thereby influences the shape of
u
n
(y) and
its geostrophically balancing geopotential and buoyancy fields, most im-
portantly by sharpening the core jet profile. But R does not provide the
essential equilibrating balance to the overall forcing (i.e., in the merid-
ional integral of (5.82)) in the absence of meridional boundary stresses
(cf., (5.89) and Sec. 5.4).
Much of the preceding dynamical analysis is a picture drawn first in
the 1950s and 1960s to describe the maintenance of the atmospheric
jet stream (e.g., Lorenz, 1967). Nevertheless, for many years afterward
it remained a serious challenge to obtain computational solutions that
exhibit this behavior. This GFD problem has such central importance,
however, that its interpretation continues to be further refined. For
example, it has recently become a common practice to diagnose the
eddy effects in terms of the Eliassen-Palm flux defined by
E =
u
v
ˆ
y + f
0
η
v
ˆ
z = R
ˆ
y − D
ˆ
z . (5.103)
(Nb., E has a 3D generalization beyond the zonally symmetric channel
flow considered here.) The ingredients of E are the eddy Reynolds stress,
R, and isopycnal form stress, D. The mean zonal acceleration by the
eddy fluxes in (5.90) is reexpressable as minus the divergence of the
5.4 Rectification by Rossby Wave Radiation 209
Eliassen-Palm flux, i.e.,
v
q
QG
= −∇∇∇· E = −∂
y
R + ∂
z
D ,
with all the associated dynamical roles in the maintenance of the tur-
bulent equilibrium jet that have been discussed throughout this section.
(An analogous perspective for wind-driven oceanic gyres is in Sec. 6.2.)
The principal utility of a General Circulation Model — whether for
the atmosphere, the ocean, or their coupled determination of climate
— is in mediating the competition among external forcing, eddy fluxes,
and non-conservative processes with as much geographical realism as is
computationally feasible.
5.4 Rectification by Rossby Wave Radiation
A mechanistic interpretation for the shape of R
n
(y) in Fig. 5.17 can
be made in terms of the eddy–mean interaction associated with Rossby
waves radiating meridionally away from a source in the core region for
the mean jet and dissipating after propagating some distance away from
the core. For simplicity this analysis will be made with a barotropic
model (cf., Sec. 3.4), since barotropic, shallow-water, and baroclinic
Rossby waves are all essentially similar in their dynamics. The pro-
cess of generating a mean circulation from transiently forced fluctuating
currents is called rectification. In coastal oceans tidal rectification is
common.
A non-conservative, barotropic, potential vorticity equation on the
β-plane is
Dq
Dt
= F
− r∇
2
ψ
q = ∇
2
ψ + βy
D
Dt
=
∂
∂t
+
ˆ
z · ∇∇∇ψ × ∇∇∇ (5.104)
(cf., (3.27)). For the purpose of illustrating rectification behavior, F
is
a transient forcing term with zero time mean (e.g., caused by Ekman
pumping from fluctuating winds), and r is a damping coefficient (e.g.,
Ekman drag; cf., (5.80) and (6.53) with r =
bot
/H). For specificity
choose
F
= F
∗
(x, y) sin[ωt] ,
with a localized F
∗
that is nonzero only in a central region in y (Fig.
5.18).
210 Baroclinic and Jet Dynamics
u’v’ > 0
k
c
g
(y)
c
(y)
p
<0, <0 >0,
u’v’ < 0
k
c
(y)
p
c
g
(y)
>0,
>0, <0
∂
∂
R
y
1
r
y
x
constant phase lines
constant phase lines
y
R = u’v’ (y)
u(y) = −
y
F = 0
*
F = 0
*
F
*
= 0
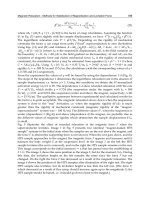
Fig. 5.18. Sketch of radiating Rossby waves from a zonal strip of transient forc-
ing, F
∗
(x, y, t) (shaded area); the pattern of Rossby wave crests and troughs
(i.e., lines of constant wave phase) consistent with the meridional group ve-
locity, c
y
g
, oriented away from the forcing strip (top); the resulting Reynolds
stress, R(y) (middle); and the rectified mean zonal flow,
u(y) (bottom). By
the dispersion relation (5.105), the signs for k and c
y
p
on either side of the
forcing region are consequences of outward energy propagation.
Rossby waves with frequency ω will be excited and propagate away
from the source region. Their dispersion relation is
ω = −
βk
k
2
+
2
, (5.105)
5.4 Rectification by Rossby Wave Radiation 211
with (k, ) the horizontal wavenumber vector. The associated meridional
phase and group speeds are
c
y
p
= ω/ = −
βk
(k
2
+
2
)
c
y
g
=
∂ω
∂
=
2βk
(k
2
+
2
)
2
(5.106)
(Sec. 4.7). To the north of the source region, the group speed must be
positive for outward energy radiation. Since without loss of generality
k > 0, the northern waves must have > 0. This implies c
(y)
p
< 0
and a NW-SE alignment of the constant-phase lines, hence
u
v
< 0
since motion is parallel to the constant-phase lines. In the south the
constant-phase lines have a NE-SW alignment, and
u
v
> 0. This
leads to the
u
v
(y) profile in Fig. 5.18. Note the decay as |y| → ∞,
due to damping by r. In the vicinity of the source region the flow can
be complicated, depending upon the form of F
∗
, and here the far-field
relations are connected smoothly across it without too much concern
about local details.
This Reynolds stress enters in the time-mean, zonal momentum bal-
ance consistent with (5.104):
r
u = −
∂
∂y
u
v
(5.107)
since
F = 0 (cf., Sec. 3.4). The mean zonal flow generated by wave rec-
tification has the pattern sketched in Fig. 5.18, eastward in the vicinity
of the source and westward to the north and south. This a simple model
for the known behavior of eastward acceleration by the eddy horizontal
momentum flux in an baroclinically unstable eastward jet (e.g., in the
Jet Stream and ACC; Sec. 5.3.3), where the eddy generation process
by baroclinic instability has been replaced heuristically by the transient
forcing F
. The mean flow profile in Fig. 5.18 is proportional to −∂
y
R,
and it has a shape very much like the one in Fig. 5.17. Note that
this rectification process does not act like an eddy diffusion process in
the generation region since
u
v
generally has the same sign as u
y
(and
here it could, misleadingly, be called a negative eddy-viscosity process),
although these quantities do have opposite signs in the far-field where
the waves are being dissipated. So the rectification is not behaving like
eddy mixing in the source region, in contrast to the barotropic instabil-
ity problems discussed in Secs. 3.3-3.4. The eddy process here is highly
non-local, with the eddy generation site (within the jet) distant from
212 Baroclinic and Jet Dynamics
the dissipation site (outside the jet). Since
∞
−∞
u(y) dy = 0 (5.108)
from (5.107), the rectification process can be viewed as a conservative
redistribution of the ambient zonal-mean zonal momentum, initially zero
everywhere, through wave radiation stresses.
There are many other important examples of non-local transport of
momentum by waves in nature. The momentum is taken away from
where the waves are generated and deposited where they are dissipated.
For example, this happens for internal gravity lee waves generated by a
persistent flow (even by tides; Fig. 4.2) over a bottom topography on
which they exert a mean form stress. The gravity lee waves propagate
upward away from the solid boundary with a dominant wavenumber vec-
tor, k
∗
, determined from their dispersion relation and the mean wind
speed in order to be stationary relative to solid Earth. The waves finally
break and dissipate mostly at critical layers (i.e., , where c
p
(k
∗
) =
u(z)),
and the associated Reynolds stress divergence, −∂
z
u
w
, acts to re-
tard the mean flow aloft. This process is an important influence on
the strength of the tropopause Jet Stream, as well as mean zonal flows
at higher altitudes. Perhaps it may be similarly important for the ACC
as well, but the present observational data do not allow a meaningful
test of this hypothesis.
6
Boundary-Layer and Wind-Gyre Dynamics
Boundary layers arise in many situations in fluid dynamics. They occur
where there is an incompatibility between the interior dynamics and the
boundary conditions, and a relatively thin transition layer develops with
its own distinctive dynamics in order to resolve the incompatibility. For
example, nonzero fluxes of momentum, tracers, or buoyancy across a
fluid boundary almost always instigate an adjacent boundary layer with
large normal gradients of the fluid properties. Boundary-layer motions
typically have smaller spatial scales than the dominant interior flows.
If their Re value is large, they have stronger fluctuations (i.e., eddy
kinetic energy) than the interior because they almost always are turbu-
lent. Alternatively, in a laminar flow with a smaller Re value, but still
with interior dynamical balances that are nearly conservative, boundary
layers develop where non-conservative viscous or diffusive effects are sig-
nificant because the boundary-normal spatial gradients are larger than
in the interior.
In this chapter two different types of boundary layers are examined.
The first type is a planetary boundary layer that occurs near the solid
surface at the bottoms of the atmosphere and ocean and on either side of
the ocean-atmosphere interface. The instigating vertical boundary fluxes
are a momentum flux — the drag of a faster moving fluid against slower
(or stationary) material at the boundary — or a buoyancy flux — heat
and water exchanges across the boundary. The second type is a lateral
boundary layer that occurs, most importantly, at the western side of an
oceanic wind gyre in an extra-tropical basin with solid boundaries in the
zonal direction. It occurs in order to satisfy the constraint of zonally
integrated mass conservation (i.e., zero total meridional transport in
steady state) that the interior meridional currents by themselves do not.
213
214 Boundary-Layer and Wind-Gyre Dynamics
6.1 Planetary Boundary Layer
The planetary boundary layer is a region of strong, 3D, nearly isotropic
turbulence associated with motions of relatively small scale (1-10
3
m)
that, nevertheless, are often importantly influenced by Earth’s rotation.
Planetary boundary layers are found near all solid-surface, air-sea, air-
ice, and ice-sea boundaries. The primary source of the turbulence is
the instability of the
ρ(z) and u(z) profiles that develop strong verti-
cal gradients in response to the boundary fluxes. For example, either a
negative buoyancy flux (e.g., cooling) at the top of a fluid layer or a pos-
itive buoyancy flux at the bottom generates a gravitationally unstable
density profile and induces convective turbulence (cf., Sec. 2.3.3). Sim-
ilarly, a boundary stress caused by drag on the adjacent flow generates
a strongly sheared, unstable velocity profile, inducing shear turbulence
(cf., Sec. 3.3.3). In either case the strong turbulence leads to an effi-
cient buoyancy and momentum mixing that has the effect of reducing
the gradients in the near-boundary profiles. This sometimes happens to
such a high degree that the planetary boundary layer is also called a
mixed layer, especially with respect to the weakness in material tracer
gradients.
A typical vertical thickness, h, for the planetary boundary layer is 50
m in the ocean and 500 m in the atmosphere, although wide ranges of
h occur even on a daily or hourly basis (Fig. 6.1) as well as climatolog-
ically. The largest h values occur for a strongly destabilizing boundary
buoyancy flux, instigating convective turbulence, where h can penetrate
through most or all of either the ocean or the troposphere eg, deep sub-
polar oceanic convection in the Labrador and Greenland Seas or deep
tropical atmospheric convection above the Western Pacific Warm Pool.
More often convective boundary layers do not penetrate throughout the
fluid because their depth is limited by stable stratification in the interior
(e.g., 6.1), which is sometimes called a capping inversion or inversion
layer in the atmosphere or a pycnocline in the ocean.
6.1.1 Boundary-Layer Approximations
The simplest example of a shear planetary boundary layer is a uniform-
density fluid that is generated in response to the stress (i.e., momentum
flux through the boundary) on an underlying flat surface at z = 0.
The incompressible, rotating, momentum and continuity equations with
6.1 Planetary Boundary Layer 215
5 10 15 20
0
1
2
3
0900
1030
1200
1330
Virtual potential temperature, C
Height AGL, km
0 5 10 15 20 25
0
1
2
3
Water vapor mixing ratio, g/kg
Height AGL, km
8 9 10 11 12 13 14 15 16 17
0
0.5
1
1.5
2
2.5
3
Reflectivity, PBL height, and cloud base
Time (CST)
Height AGL, km
Day 266 1995
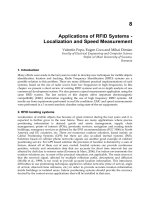
Fig. 6.1. Example of reflectivities (bottom) observed in the cloud-free con-
vective boundary layer in central Illinois on 23 Sep 1995: (top left) virtual
temperature profiles and (top right) vertical profiles of water vapor mixing
ratio. Note the progressive deepening of the layer through the middle of the
day as the ground warms. (Gage & Gossard, 2003.)
ρ = ρ
0
are
Du
Dt
− fv = −
∂φ
∂x
+ F
x
Dv
Dt
+ fu = −
∂φ
∂y
+ F
y
Dw
Dt
+ g = −
∂φ
∂z
+ F
z
∂u
∂x
+
∂v
∂y
+
∂w
∂z
= 0 . (6.1)
This partial differential equation system has solutions with both tur-
bulent fluctuations and a mean velocity component, where the mean
216 Boundary-Layer and Wind-Gyre Dynamics
is distinguished by an average over the fluctuations. So the planetary
boundary layer is yet another geophysically important example of eddy–
mean interaction.
Often, especially from a large-scale perspective, the mean boundary-
layer flow and tracer profiles are the quantities of primary interest, and
the turbulence is viewed as a distracting complexity, interesting only as
a necessary ingredient for determining the mean velocity profile. From
this perspective the averaged equations that express the mean-field bal-
ances are the most important ones. In the context of, e.g., a General
Circulation Model, the mean-field balances are part of the model formu-
lation with an appropriate parameterization for the averaged transport
effects by the turbulent eddies. In the shear planetary boundary layer,
the transport is expressed as the averaged eddy momentum flux, i.e., the
Reynolds stress (Sec. 3.4).
To derive the mean-field balances for (6.1), all fields are decomposed
into mean and fluctuating components,
u =
u + u
, etc. (6.2)
For a boundary layer in the z direction, the overbar denotes an average
in x, y, t over the scales of the fluctuations, so that, e.g.,
u
= 0. (6.3)
This technique presumes a degree of statistical symmetry in these aver-
aging coordinates, at least on the typical space and time scales of the
fluctuations. No average is taken in the z direction since both fluctuation
and mean variables will have strong z gradients and not be translation-
ally symmetric in z. Alternatively, the average may be viewed as over an
ensemble of many planetary boundary layer realizations with the same
mean stress and different initial conditions for the fluctuations, count-
ing on the sensitive dependence of the solutions to (6.1) spanning the
range of possible fluctuation behaviors. If there is a separation of space
and/or time scales between the mean and fluctuating components (e.g.,
as assumed in Sec. 3.5), and if there is a meaningful typical statistical
equilibrium state for all members of the ensemble, then it is usually pre-
sumed that the symmetry-coordinate and ensemble averages give equiva-
lent answers. This presumption is called ergodicity. For highly turbulent
flows in GFD, the ergodicity assumption is usually valid.
The momentum advection term can be rewritten as a momentum flux
divergence, viz.,
(u · ∇∇∇)u = ∇∇∇· (u u) , (6.4)
6.1 Planetary Boundary Layer 217
with a 3D vector notation here. This equivalence is valid since the dif-
ference between the two sides of the equation, u(∇∇∇·u), vanishes by the
incompressible continuity relation. An average of the quadratic momen-
tum flux yields two types of contributions,
∇∇∇· (
u u) = ∇∇∇· (u u) + ∇∇∇·(u
u
) , (6.5)
since terms that are linear in the fluctuations vanish by (6.3) while those
that are quadratic do not. (6.5) is an expression for the divergence of the
mean momentum flux. The averaged advective flux thus has contribu-
tions both from the mean motions (the first term, the mean momentum
flux) and the fluctuations (the second term, the eddy momentum flux
or Reynolds stress).
Insert (6.2) into (6.1) and take the average. The result is
∂
u
∂t
+ ∇∇∇·(
u u) −fv = −
∂
φ
∂x
− ∇∇∇· (
u
u
) + F
x
∂
v
∂t
+ ∇∇∇·(
u v) + f u = −
∂
φ
∂y
− ∇∇∇· (
u
v
) + F
y
∂
w
∂t
+ ∇∇∇·(
u w) + g = −
∂
φ
∂z
− ∇∇∇· (
u
w
) + F
z
∂
u
∂x
+
∂
v
∂y
+
∂
w
∂z
= 0 . (6.6)
The mean linear terms simply match those in the unaveraged equations
(6.1), and the quadratic terms additionally contain the Reynolds stress.
Now make assumptions about the dynamical balances in (6.6) that
comprise the boundary-layer approximation. Assume that (x, y, t) deriva-
tives are small when applied to mean fields (including the eddy flux,
which is a “mean” field since it is an averaged quantity) compared to
vertical derivatives. The vertical scales of the turbulence and mean flow
are both assumed to be on the scale of h, the boundary-layer thick-
ness. Further assume that the mean and turbulent horizontal velocity
magnitudes are comparable in size,
u, v ∼ u
, v
. (6.7)
These assumptions imply that
∂
u
∂x
,
∂
u
∂y
,
∂
v
∂x
,
∂
v
∂y
∂u
∂x
,
∂u
∂y
,
∂v
∂x
,
∂v
∂y
, (6.8)
and
w w
. (6.9)
218 Boundary-Layer and Wind-Gyre Dynamics
These conclusions follow from the premises that both the mean and
fluctuations satisfy a fully 3D continuity balance and that the flow is
approximately horizontally isotropic (i.e., the x and y scales and u
and v
amplitudes are similar on average). If the horizontal scale of
u
, v
is comparable to h, the vertical scale, then the same consideration
implies that w
is of comparable intensity to the horizontal velocities,
and the turbulent motions are 3D isotropic. For dynamical consistency,
the mean horizontal pressure gradient, ∇∇∇
φ, is assumed to be of the
same size as the leading-order terms in the mean momentum balance,
e.g., the Coriolis force, f
u
h
. In the boundary-layer approximation, the
fluctuations are assumed to be statistically invariant in their horizontal
and time dependences on the scales over which the mean flow varies.
These approximations are called homogeneity (in the horizontal) and
stationarity (in time), referring to the respective statistical properties of
the fluctuations.
Next make a further approximation that the eddy flux divergences are
much larger than the mean non-conservative force,
F. Since
F = ν∇
2
u (6.10)
for Newtonian viscous diffusion (with ν the viscosity), then a scale es-
timate for the ratio of the eddy terms to the viscous diffusion terms in
(6.6) is
Re =
V L
ν
, (6.11)
the Reynolds number previously defined in (2.5). It can be estimated
for atmospheric / oceanic planetary boundary layers, respectively, with
characteristic scales of V ∼ 10 / 0.1 m s
−1
, L ∼ h = 10
3
/ 10
2
m, and ν = 10
−5
/ 10
−6
m
2
s
−1
, yielding the quite large values of
Re = 10
9
/ 10
7
. Thus, the mean viscous diffusion,
F, can be neglected
in the mean-field balance (6.6).
Of course, F
= ν∇
2
u
cannot be neglected in (6.1) since a character-
istic of turbulence is that the advective cascade of variance dynamically
connects the large-scale fluctuations on the scale of h with small-scale
fluctuations and molecular dissipation (cf., Secs. 3.7 and 5.3). In the
case of three-dimensional turbulence in general, and boundary-layer tur-
bulence in particular, the fluctuation kinetic energy and enstrophy are
both cascaded in the forward direction to the small, viscously controlled
scales where it is dissipated — like the enstrophy cascade but unlike the
energy cascade in 2D turbulence (Sec. 3.7).
6.1 Planetary Boundary Layer 219
The consequence of this boundary-layer approximation is a simplified
form of the mean-field balances compared to (6.6), viz.,
−f
v +
∂
φ
∂x
+
∂
∂z
(
w
u
) = 0
f
u +
∂
φ
∂y
+
∂
∂z
(
w
v
) = 0
∂
φ
∂z
+ g +
∂
∂z
(
w
2
) = 0
∂
u
∂x
+
∂
v
∂y
+
∂
w
∂z
= 0 . (6.12)
The equilibrium shear planetary boundary layer has a mean geostrophic,
hydrostatic balance augmented by vertical eddy momentum flux diver-
gences.
6.1.2 The Shear Boundary Layer
For a shear planetary boundary layer next to a solid lower boundary,
the following boundary conditions for the eddy fluxes are assumed:
w
u
= −
1
ρ
o
τ
x
s
,
w
v
= −
1
ρ
o
τ
y
s
,
w
2
= 0, z = 0 , (6.13)
and
w
u
, w
v
, w
2
→ 0, z → ∞ . (6.14)
The mean boundary stress, τττ
s
, is conveyed toward the interior by the
Reynolds stress that varies across the boundary layer but decays away
into the interior. Of course, the eddy flux cannot truly carry the stress
very near the boundary since the velocity fluctuations, hence the Reynolds
stress, must vanish there by the boundary condition of no-slip. In reality
a very thin viscous sub-layer lies next to the boundary, and within it the
value of Re, expressed in terms of the local velocity and sub-layer thick-
ness, is not large. In this sub-layer the important averaged momentum
flux is the viscous one, ν∂
z
u. So (6.13) represents a simplification by
not resolving the sub-layer’s viscous stress contribution. Thus, the more
general expression for the averaged vertical flux of horizontal momentum
is
−
w
u
h
+ ν
∂
u
∂z
.
220 Boundary-Layer and Wind-Gyre Dynamics
Here τττ
s
is defined as the boundary stress exerted by the fluid on the un-
derlying boundary or, equivalently, as the negative of the stress exerted
by the solid boundary on the fluid.
Real boundary layers often have rather sharp vertical transitions in
the fluctuation intensity and mean shear across the interior edge at z ≈
h as a consequence of the stable stratification there (e.g., a capping
inversion). In (6.14) without stratification effects, the transition between
the planetary boundary layer and interior regions is more gradual, and
this interior edge has been identified with z → ∞ for mathematical
convenience.
Next decompose the solution of (6.12) into boundary-layer (with su-
perscript b) and interior (with i) parts. The interior solutions satisfy
geostrophic and hydrostatic balances since the eddy fluxes vanish by
(6.14). Since the horizontal density gradients are zero here, the result-
ing thermal-wind balance (2.105) implies that the horizontal velocities
are independent of depth,
∂
u
i
h
∂z
= 0 . (6.15)
This result is sometimes called the Taylor-Proudman Theorem. The
associated interior geopotential function and vertical velocity in the in-
terior are therefore linear functions of z. So the structure of the mean
flow solution is
u = u
b
(z) + u
i
v = v
b
(z) + v
i
w = w
b
(z) + w
i
(z)
φ = x X
i
+ y Y
i
+ φ
o
− gz + φ
b
(z) , (6.16)
making the z dependences explicit. (
X
i
, Y
i
) is minus the mean hori-
zontal pressure-gradient force, and φ
o
is a reference constant for φ equal
to its surface value. All of these mean-flow quantities can be viewed as
having “slow” (x, y, t) variations on scales much larger than the scales
of the boundary-layer fluctuations, although here this dependence is no-
tationally suppressed.
The interior horizontal momentum balance is particularly simple:
f
v
i
≈ fv
i
g
= X
i
f
u
i
≈ fu
i
g
= −Y
i
. (6.17)
The associated mean interior continuity balance implies that
w
i
is triv-
6.1 Planetary Boundary Layer 221
ial with this geostrophic flow if we neglect the spatial variation in f
(i.e., f -plane approximation). A nontrivial balance for
w
i
only oc-
curs at a higher order of approximation, involving β and the horizontal
ageostrophic interior flow, u
i
a
. The vertical integral of the continuity
equation for the interior variables yields
w
i
=
z
∂
x
Y
i
f
− ∂
y
X
i
f
− ∇∇∇
h
·
u
i
a
dz
=
β
f
2
X
i
z −
z
0
∇∇∇
h
·
u
i
a
dz
, (6.18)
with use of the surface boundary condition,
w
i
(0) = 0, in the second
line. Since
u
i
a
is undetermined at the level of approximation used in
(6.12), the formula for
w
i
cannot be explicitly evaluated at this point
(and it is not the focus of this boundary-layer analysis).
Subtracting (6.17) from (6.12) yields the shear boundary-layer prob-
lem,
f
v
b
(z) =
∂
∂z
(
w
u
)
f
u
b
(z) = −
∂
∂z
(
w
v
)
φ
b
(z) = − w
2
∂
w
b
∂z
= −
∂
u
b
∂x
−
∂
v
b
∂y
, (6.19)
with the vertical boundary conditions,
u
b
= −u
i
, w
b
= 0 , z = 0
u
b
, v
b
→ 0 , z → ∞ , (6.20)
appropriate for no slip and no normal flow at z = 0 and for vanishing
horizontal boundary-layer velocities outside the layer. The third equa-
tion in (6.19) can be viewed as a auxiliary, diagnostic relation for the
boundary-layer pressure correction to hydrostatic balance, since
φ
b
does
not influence the horizontal mean flow in these equations. Similarly, w
b
is diagnostically determined from
u
b
using the fourth equation in (6.19).
So the central problem for the boundary layer is solving for
u
b
h
using the
first and second equations.
w differs from (u, v) in its interior and boundary-layer decomposition
because
w
b
does not vanish as z → ∞ and because the vertical boundary
condition,
w(0) = 0, has, without loss of generality, been presumed to
222 Boundary-Layer and Wind-Gyre Dynamics
apply to each of
w
b
and w
i
separately. The dynamical consistency of the
latter presumption requires consistency with the boundary condition on
w at the top of the fluid, z = H. From (6.18) this in turn is controlled
by a consistent prescription for
u
i
a
, not explicitly considered here.
The quantity w
u
(z) is called the vertical Reynolds stress because
of its vertical flux direction for vector momentum (i.e., its first velocity
component is w
). If it were known, then (6.19)-(6.20) could be solved to
evaluate
u
b
, v
b
, w
b
z
, and φ
b
. However, the Reynolds stress is not known
a priori, and at a fundamental dynamical level the eddy fluxes must be
solved for simultaneously with the mean profiles; this requires looking
beyond the mean-field balances (6.6). Seeking a way to avoid the full
burden of the requirement of solving (6.1) completely is referred to as
the turbulence closure problem, which if solved permits the consideration
of (6.6) or (6.19)-(6.20) by themselves.
Even without specifying the closure, however, the horizontal momen-
tum equations in (6.19)-(6.20) can be integrated across the boundary
layer, eliminating the unknown Reynolds stress in place of the boundary
stress using (6.13):
T
x
=
∞
0
u
b
dz = −
1
ρ
o
f
τ
y
s
T
y
=
∞
0
v
b
dz =
1
ρ
o
f
τ
x
s
. (6.21)
This says that the bottom boundary-layer, horizontal transport (i.e.,
depth-integrated velocity increment from the interior flow), T, is 90
o
to
the left (right) of the stress exerted by the fluid on the boundary in the
northern (southern) hemisphere. The term transport is used both for
depth-integrated horizontal velocity (i.e., a vertical-column area trans-
port with units of m
2
s
−1
) and for the normal component of horizontal
velocity integrated over a vertical plane (i.e., a cross-section volume
transport with units of m
3
s
−1
, or when multiplied by ρ, a mass trans-
port with units of kg s
−1
).
The preceding boundary-layer analysis has neglected the horizontal
derivatives of averaged quantities. The boundary-layer problem for
(
u
b
, v
b
) in (6.19)-(6.20) and its associated transport (6.21) can be viewed
as locally valid at each horizontal location. But by looking across differ-
ent locations, the continuity equation in (6.19) can be integrated verti-
6.1 Planetary Boundary Layer 223
cally with the kinematic condition in (6.20) to yield
w
b
(z → ∞) = −
∞
0
∂
u
b
∂x
+
∂
v
b
∂y
dz
=⇒
w
b
(∞) = w
ek, bot
=
ˆ
z · ∇∇∇×
τττ
s
ρ
o
f
. (6.22)
Since
u
b
h
→ 0 going into the interior, w
b
approaches a value independent
of height, which is how w
ek
should be understood. Notice that w
ek
, like
T in (6.21), depends only on the surface stress and is independent of the
Reynolds stress profile, hence its closure.
Planetary boundary-layer flows that satisfy (6.19)-(6.22) are called
Ekman layers. The vertical velocity that reaches into the interior, w
ek
in (6.22), is called Ekman pumping, and it is caused by the horizontal
gradients in τττ
s
and f(y) on a spatial scale much larger than h (i.e., the
boundary-layer approximation in Sec. 6.1.1).
The surface boundary conditions on
w
u
and u
b
in (6.13) and (6.20)
are generally redundant for general
u
i
, although this viewpoint is based
on the resolution of the closure problem alluded to above so that
w
u
h
and τττ
s
are mutually consistent.
• For the bottom planetary boundary layers in both the ocean and at-
mosphere,
u
i
is locally viewed (i.e., from the perspective of the slowly
varying (x, y, t) values) as determined from the interior dynamics in-
dependent of the details of the boundary-layer flow, and the planetary
boundary-layer dynamics resolves the incompatibility between
u
i
(z)
and the surface no-slip boundary condition,
u(0) = 0. This resolution
determines the boundary-layer Reynolds stress profile, and the surface
stress, τττ
s
, is diagnostically calculated using (6.20) (Sec. 6.1.4).
• In contrast, for the oceanic surface planetary boundary layer (with
z = 0 the top surface and z → −∞ going into the oceanic interior),
the overlying wind locally determines the surface stress, τττ
s
, and the
surface oceanic velocity,
u
b
(0) + u
i
(0), is not constrained to be zero;
in fact, the approximation is often made that the oceanic planetary
boundary-layer dynamics are independent of the oceanic interior flow.
Thus, (6.13) is the controlling boundary condition in the oceanic sur-
face planetary boundary layer (Sec. 6.1.5).
(The more general perspective would be that the fluid dynamics of the
interior and boundary layer, as well as the boundary stress, must all be
determined together.)
For simplicity in this Ekman layer analysis, the assumptions ρ = ρ
0
224 Boundary-Layer and Wind-Gyre Dynamics
and ∂
z
u
i
= 0 have been made. In general the lower atmosphere and
ocean are stratified, so these assumptions are not correct. However, they
need not be precisely true to have planetary boundary-layer behavior
very much like an Ekman layer, if the density variations and interior-
flow baroclinicity (i.e., vertical shear) are weak enough near z = 0 on
the scale δz ∼ h for both the turbulence and mean boundary-layer shear.
Frequently the largest effect of stable stratification on a shear boundary
layer is a compression of its vertical extent (i.e., reduction in h) by a
strong pycnocline or inversion layer at its interior edge (cf., Fig. 6.1b).
6.1.3 Eddy-Viscosity Closure
The preceding analysis is incomplete because the turbulence closure
problem has not been resolved yet. One way to proceed is to adopt
what is probably the most widely used closure hypothesis of eddy vis-
cosity. It states that the Reynolds stress acts to transport momentum
the same way that molecular viscosity does in (6.10), albeit with an en-
hanced eddy viscosity magnitude, ν
e
ν, whenever Re 1 (Sec. 3.4).
Specifically, in order to close (6.19)-(6.20), assume the following relation
between the eddy momentum flux and the mean shear,
w
u
= −ν
e
∂
u
∂z
. (6.23)
ν
e
> 0 implies that the flux is acting in a down-gradient direction. Using
the closure (6.23), the laminar Ekman layer equations are obtained from
(6.19)-(6.20) for a boundary layer above a solid level surface:
f
v = −ν
e
∂
2
u
∂z
2
f
u = ν
e
∂
2
v
∂z
2
w = −
z
0
∂
u
∂x
+
∂
v
∂y
dz
u
h
= −u
i
h
, z = 0
u
h
→ 0, z → ∞ . (6.24)
For brevity the superscript on u
b
h
has now been deleted, and the accom-
panying diagnostic relation for
φ
b
is ignored.
This laminar boundary-layer problem is called a parameterized plan-
etary boundary layer in the sense that there is no explicitly turbulent
6.1 Planetary Boundary Layer 225
component in its solution, as long as ν
e
is large enough that its corre-
sponding eddy Reynolds number, Re
e
= V L/ν
e
, is below some critical
threshold value for instability of the mean boundary-layer velocity pro-
file. (This reflects a general view that Re is a control parameter that
regulates the transition from stable, laminar flow when Re is small,
through transitional instabilities as Re increases, to fully developed tur-
bulence when Re is large enough; cf., Sec. 5.3.1.) Nevertheless, the
parameterized planetary boundary layer is implicitly a representation
of (or model for) the intrinsically turbulent boundary-layer dynamics.
The transport and Ekman pumping relations (6.21) and (6.22) are fully
applicable to (6.24) since they do not depend on the Reynolds stress
profile or closure choice.
It is quite feasible to use a closure relation like (6.23) in a General Cir-
culation Model and implicitly solve for
u
b
h
and w
b
as part of the model’s
time integration procedure, and broadly speaking this approach is the
common practice for incorporating planetary boundary-layer processes
in General Circulation Models.
6.1.4 Bottom Ekman Layer
Now solve the problem (6.24) analytically. The simplest way to do so is
to define a complex horizontal velocity combination of the real velocity
components,
U =
u + iv. (6.25)
In terms of U, (6.24) becomes
ν
e
∂
2
U
∂z
2
= ifU
U(0) = −U
i
U(∞) = 0 . (6.26)
This is a complex, second-order, ordinary differential equation boundary-
value problem (rather than the equivalent, coupled pair of second-order
equations, or a fourth-order system, for (
u, v)). This homogeneous prob-
lem has elemental solutions,
U ∝ e
kz
for k
2
= i
f
ν
e
,
226 Boundary-Layer and Wind-Gyre Dynamics
or
k = (iS
f
)
1/2
|f|
ν
e
, (6.27)
where S
f
= f /|f| is equal to +1 in the northern hemisphere and −1 in
the southern hemisphere. To satisfy U(∞) = 0, the real part of k must
be negative. This occurs for the k root,
(iS
f
)
1/2
= −
1 + iS
f
√
2
, (6.28)
and the other root,
(iS
f
)
1/2
= +
1 + iS
f
√
2
,
is excluded. The fact the k has an imaginary part implies an oscillation
of U with z, in addition to the decay in z. Thus,
U(z) = −U
i
e
− λ(1+iS
f
)z
, (6.29)
with a vertical decay rate, λ, that can be identified with the inverse
boundary-layer depth by the relation,
h
ek
= λ
−1
=
2ν
e
f
. (6.30)
This solution can be rewritten in terms of its real-valued velocity
components from (6.25) as
u = Real(U) = e
−λz
−u
i
cos [λz] − S
f
v
i
sin [λz]
v = Imag(U) = e
−λz
S
f
u
i
sin [λz] − v
i
cos [λz]
. (6.31)
The Ekman spiral is the curved plot of (6.31) that is evident on its
hodograph, which is a plot of
u(z) in a (u, v) plane (Fig. 6.2). In the
northern hemisphere the boundary layer velocity weakens and turns in
a clockwise manner ascending from the surface, and the total velocity,
u
i
+ u
b
, increases from zero and also turns clockwise as it approaches
the interior velocity. In the southern hemisphere the direction of the
ascending Ekman spiral is counterclockwise. The hodograph’s spiral
pattern is equivalent to the vertical decay and oscillation implied by k
in (6.27)-(6.28).
Next evaluate the surface stress by differentiation of (6.31) using the
eddy viscosity closure relation (6.23) evaluated at the bottom boundary:
1
ρ
o
τ
x
s
= ν
e
∂
u
∂z
(0) =
ek, bot
u
i
− S
f
v
i
6.1 Planetary Boundary Layer 227
z=∞
z=0
v
u
u
u
i
b
(z)
Fig. 6.2. Bottom Ekman layer hodograph in the northern hemisphere: u
i
is
the interior flow, and
u
b
(z) is the boundary-layer anomaly that brings the
total flow to zero at the surface, z = 0.
1
ρ
o
τ
y
s
= ν
e
∂
v
∂z
(0) =
ek, bot
S
f
u
i
+ v
i
, (6.32)
with a bottom damping coefficient defined by
ek, bot
=
|f|ν
e
2
=
fh
ek
2
(6.33)
that has units of m s
−1
(cf., (5.80) and Sec. 6.2.1). These relations
indicate that the stress of the fluid on the boundary is rotated by 45
o
relative to the interior flow, and the rotation is to the left (right) in the
northern (southern) hemisphere.
The transport (6.21) is evaluated by a direct vertical integration of
(6.31) (with a result that necessarily must be consistent the general