SolidWorks 2010 bible phần 8 docx
Bạn đang xem bản rút gọn của tài liệu. Xem và tải ngay bản đầy đủ của tài liệu tại đây (3.32 MB, 118 trang )
Part V: Creating Drawings
782
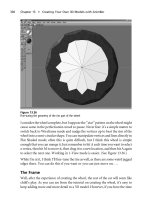
FIGURE 24.14
The Combine Same Tags option used with a Hole Table that includes a slot
Using Revision Tables
You can use Revision Tables in SolidWorks in conjunction with SolidWorks Workgroup PDM, but
this integration goes beyond the scope of this book. The Revision Table uses a table anchor, which
is used in exactly the same way as the BOM table. Revision Tables also use templates in the same
way as the other table types, and it is recommended to move customized templates to a library
location and specify the location in Tools ➪ Options ➪ File Locations.
Figure 24.15 shows the Revision Table PropertyManager interface where you can create and con-
trol the settings for the table. You can find the default settings for Revision Tables by choosing
Tools ➪ Options ➪ Document Properties ➪ Drafting Standard ➪ Tables ➪ Revision.
The settings are now contained in a single PropertyManager; a toolbar and a RMB menu were for-
merly contained in five PropertyManager pages.
The image in the upper left of Figure 24.15 is the PropertyManager interface that displays when
you initially create the Revision Table. The upper-right image is the RMB menu for the Revision
Table, and the bottom toolbar is the formatting toolbar that displays when you select the Revision
Table.
You can initiate the Revision Table function through the menus or the Tables toolbar. However,
this function simply creates the table; it does not populate it. You must set the table anchor in the
format in order for the Table Anchor to work. Additional columns may be added or formatted to
accept other data. Once you have created the columns or formatting, you can save the changes to a
template, which is also available through the RMB menu.
You can add a revision to the table by right-clicking the table and choosing Revisions ➪ Add
Revision. This includes control over whether the revision uses numerical or alphabetical revision
levels, but does not provide for more complex revisioning schemes.
Chapter 24: Working with Tables and Drawings
783
FIGURE 24.15
The Revision Table PropertyManager interface
Immediately after you have created the revision, if the option is enabled, you are prompted to
place a balloon that contains the revision level to identify what has been changed. To finish placing
symbols, you can press Esc. When you are finished placing the balloons, you can fill in the
description of the revision by double-clicking in the Description cell where you want to add text.
Figure 24.16 shows a Revision Table with balloon symbols placed on the drawing.
Revision Tables work by creating a Revision custom property in the drawing document, and by
incrementing this revision each time a revision is added to the table. Additional columns linked to
custom properties can be added to Revision Tables and Revision Table templates.
Cross-Reference
Gauge Tables and Bend Tables are specific to sheet metal parts and are covered in detail in Chapter 29.
Weldment Cut Lists are a special type of table that closely resembles a BOM table in many ways. These are
discussed in Chapter 31, which covers Weldments.
n
Part V: Creating Drawings
784
FIGURE 24.16
A Revision Table with balloon symbols
Using General Tables
General Tables can be used for any type of tabulated data. Column headers can be filled with either
text labels or custom property links. Regular Excel OLE objects can also be used for the same pur-
pose, and depending on the application, you may prefer this.
The General Table uses the filename extension
*.sldtbt. You can create it without a template, as
a simple block of four empty cells, or you can use a template that has a set of pre-created headers.
Using Tables in Models
Proponents of solid modeling have been saying for years that 2D drawings are going to disappear.
I’m not convinced. Paper drawings will continue to be useful until all old manufacturing methods
are abandoned, and I don’t see that happening in my lifetime. People who use modern manufac-
turing methods have already eliminated drawings, but it may never happen across the board.
But because some companies rely on 2D and paper drawings less, the industry is developing new
ways to create 2D-type documentation inside a 3D document. The ANSI Y14.41 standard is pri-
marily about this transition.
SolidWorks is responding to this type of requirement by adding features that enable you to docu-
ment the 3D data. Placing BOMs in assembly files is one way of doing this. Placing 2D type data
Chapter 24: Working with Tables and Drawings
785
into 3D model documents can reduce the need for paper or even electronic 2D documentation.
Figure 24.17 shows a BOM inside an assembly model document.
FIGURE 24.17
Displaying BOM data inside an assembly document
It is a little tricky to get the relative scale correct between the table and the model. To do this, you
have to adjust the zoom state of the model until it is fairly small within the screen, then place the
table. After the table is placed, the assembly and the table zoom together. Most users get around
this issue by viewing the table in a separate window.
Another type of table that you can use within a 3D model document is the Title Block table. You
can use Title Block tables inside parts and assemblies. You can use them in the drawing to fill in
information about the part or assembly, while avoiding creating a full 2D drawing.
Tutorial: Using BOMs
Rather than having tutorials for every table type, this chapter has tutorials only for the BOM, Hole
Table, and Revision Table. You can transfer the skills you use with these types to the other types.
This tutorial guides you through the steps that are necessary to prepare an assembly for the draw-
ing and BOM. Configurations and custom properties are used in this example. Remember that if a
drawing view is cross-hatched and you cannot see the geometry, then you may have to press
Ctrl+Q to rebuild it. Follow these steps:
1. Begin this tutorial with SolidWorks closed and Windows Explorer open.
2. If you have not already done so, create a folder for a library that is not in your
SolidWorks installation folder. Call it
D:\Library\ or something similar. Make a
folder inside this folder called Drawing Templates. Copy the files from the CD-ROM
named
inch B.drwdot and inch B (no views).drwdot to this new folder.
Part V: Creating Drawings
786
3. Launch SolidWorks and choose Tools ➪ Options ➪ File Locations ➪ Document
Template. Click the Add button and add the new library path to the list. Shut down
SolidWorks and restart it.
4. Open the assembly Chapter 24 – BOM Assy.sldasm from the CD-ROM.
5. Click the Make Drawing From Part/Assembly button, make a new drawing of the
assembly from the drawing template in the folder created in Steps 2 and 3.
6. Delete the isometric view, and in its place make a new drawing view using the
named model view “exploded.” If prompted to use true dimensions in an isometric
view, click Accept.
7. Edit the sheet format. Right-click the sketch point at the location indicated in
Figure24.18. In the popup menu that appears, select Set as Anchor and then select
Billof Materials.
8. Exit Edit Sheet Format mode by selecting Edit Sheet from the RMB menu.
9. Select the new view and show it in the exploded state (right-click, Properties, Show
in Exploded State). Then choose Insert ➪ Table ➪ Bill of Materials or click the Bill of
Materials button in the Tables toolbar. Use the default selections, except in the panels
shown in Figure 24.19.
FIGURE 24.18
Setting the Table Anchor
RMB on this point
Chapter 24: Working with Tables and Drawings
787
FIGURE 24.19
Creating the Bill of Materials
10. Click inside the exploded view, but not on any part geometry, and then select the
Autoballoon tool from the Annotations toolbar. Toggle through the available options
to see whether any of the possible autoballoon configurations meets your needs. If not,
use the standard Balloon tool to select the part and place the balloon. This gives you
more control over the attachment points and placement of the balloons.
11. Change the balloon for the short pin to be a circular split-line balloon (do this by
clicking the balloon and then switching the style in the PropertyManager). Notice
that the quantity appears in the bottom of the balloon. The drawing view and the BOM
should now look like Figure 24.20.
Add a second leader to the balloon for the short pin by Ctrl-dragging the attachment
point for the first leader from one pin to the other.
12. Notice that several of the parts use a default description of “description.” Edit each
of these parts by right-clicking the part’s row in the BOM table and selecting Open <file-
name> from the menu. Change the Description custom property in each part. Keep in
mind that this may be handled differently for configured parts.
13. The Bracket part is listed twice using the configuration name because of the way the
configurations are set up for the parts. To list the bracket only once using the filename,
open the bracket, RMB+click one of the configuration names in the
ConfigurationManager, and select Properties. In the Bill of Materials Options panel, select
Document Name from the drop-down list. Do this for the other configuration, as well.
Notice also that the Description field holds the configuration-specific custom property for
Description, which is used in the BOM.
Part V: Creating Drawings
788
FIGURE 24.20
The drawing view and the BOM after Step 11
14. Toggle back to the drawing (pressing Ctrl+Tab), select anywhere on the BOM table,
and then select Table Properties from the PropertyManager. Expand the Part
Configuration Grouping panel, and select the Display all configurations of the same part
as one item option. This changes how the bracket displays, as well as the pins.
15. Now add a column to the BOM that calls on an existing custom property that is
already in all the parts. Place the cursor over the last column on the right and
RMB+click it. Choose Insert ➪ Column Right. This places a new column to the right of
the last one and displays a pop-up menu that enables you to set the column to be driven
by a custom property , as shown in Figure 24.21.
16. In the first drop-down selection box, select the Weight custom property. Click the
green check mark icon to accept the changes. If the popup menu disappears and you
need to get it back, double-click the column header, and it will reappear.
17. You can save the BOM with the additional column as a BOM template by right-click-
ing anywhere in the BOM and selecting Save As. You can then set the type to a BOM
template and the directory to the library location for BOM templates.
Chapter 24: Working with Tables and Drawings
789
FIGURE 24.21
Adding a column to the BOM
If you would like to compare your results against mine, the finished drawing is called Chapter 24 –
BOM Tutorial Finished.slddrw.
Tutorial: Using Hole Tables
This tutorial guides you through creating and using setting changes that are common in
SolidWorks Hole Tables. Follow these steps:
1. Create a new drawing from the inch B (no views).drwdot template. If you have not
done the BOM tutorial, then move the drawing template named
inchB.drwdot from
the Chapter 24 materials on the CD-ROM to your library location for drawing templates.
Then create the drawing from the template.
2. Click the Model View button on the Drawings toolbar, and browse to the part
named
Chapter 24 - Hole Table Part.sldprt.
3. Place a Front view and project a Left view and an isometric view. Then press Esc to
quit the command. Finally, delete the four pre-defined views.
4. There is not an anchor in this template for a Hole Table. If you would like to create
one, this would be a good time to do so. Follow the steps in the BOM tutorial for specify-
ing the anchor point.
5. Click the Hole Table button in the Tables toolbar. Figure 24.22 shows a section of
theHole Table PropertyManager with the selections that you need to make for this Hole
Table.
6. Once you have completed the selections, click the Next View button at the bottom
of the PropertyManager, and make similar selections in the Left view. The holes for
both views are added to a single Hole Table.
Part V: Creating Drawings
790
FIGURE 24.22
The Hole Table PropertyManager and selections
Select this vertex
to go into the Origin box
Select these two faces
to go into the Edges/Faces box
7. The table is created using the default settings established in Tools ➪ Options ➪
Document Properties ➪ Tables, but you can change them here for this specific table.
Click anywhere in the table, and then select Table Properties at the bottom of the
PropertyManager. Changing from numerical to alphabetical assigns a letter to each hole
type and a number to each instance of the type. Make this change and update the table.
Figure 24.23 shows the table before and after the changes.
FIGURE 24.23
Using numerical and alphabetical hole tag identification
Chapter 24: Working with Tables and Drawings
791
8. Change the number of decimal places used in the Hole Table from two places to
three. You can do this in the PropertyManager.
9. Deselect the Hide Hole Centers option in the Visibility panel.
10. Select the Combine same sizes option in the PropertyManager. This demonstrates a
much cleaner table and would be a good thing to have in the tutorial.
11. Save the drawing.
Tutorial: Using Revision Tables
In this tutorial, you create a basic Revision Table and make a template. Follow these steps:
1. Using a drawing that you completed in one of the previous tutorials, make sure that
a Revision Table Anchor has been placed in the upper-right corner of the Sheet
Format. You must edit the Sheet Format to do this by RMB+clicking the point that you
want to use for the anchor. Remember to select Edit Sheet from the RMB menu to exit
Edit Sheet Format mode.
Note
Ideally, the anchors for all table types should be set in templates and formats, but it is set up here to give you
some practice creating the anchors.
n
2. Click the Revision Table button on the Tables toolbar. Select the Attach to Anchor
option in the PropertyManager. Click the green check mark icon to accept the table.
Figure 24.24 shows the initial stub of the Revision Table.
FIGURE 24.24
The initial stub of the Revision Table
Tip
Drawing templates can be saved with the Revision Table stub if it also has a format. The Revision Table is not
saved with the format because it has to go on the drawing sheet.
n
3. To initiate a new revision level in the Revision Table, RMB+click the table and
choose Revisions ➪ Add Revision.
4. Depending on the default settings in Tools ➪ Options ➪ Document Properties ➪
Drafting Standard ➪ Tables ➪ Revision, the first revision will be either A or 1. If
youare using PDMWorks Workgroup, then you may have other options.
Part V: Creating Drawings
792
5. Depending on your options settings, you may immediately be prompted to place a
balloon that contains the new revision level. You can place balloons with or without
leaders. The balloons are meant to indicate areas of the drawing that are affected by the
revision. Press Esc when you are finished placing the balloons.
Note
Be careful when using balloons on assembly drawings or other drawings that already have balloons on them for
other purposes. It may be a good idea to use a distinctively shaped balloon for Revision Tables.
n
6. To add text to the Description field, simply click in the field and start typing. The
text automatically wraps to fit the box.
7. Practice by adding a couple of revisions, balloons, and descriptions.
8. After you have added a couple of revisions, check the custom properties by choos-
ing File ➪ Properties ➪ Custom. Notice that a revision property has been added, and the
latest revision is represented by the value of the custom property.
Note
The number of revisions kept in the Revision Table is no longer an option as it was in previous releases, but in
its place you can now control how Revision Tables interact with multiple sheets.
n
9. You can add columns in the same way that they were added to the BOM. You can
merge and unmerge cells, and link properties to cells. With the cursor over the last col-
umn (Approved), RMB+click and choose Insert ➪ Column Left. In the Column
Properties, select Custom, and from the Properties drop-down menu, select DrawnBy.
If DrawnBy is not a property in this template, create it through the interface at
File ➪ Properties. Accept the changes by clicking the green check mark icon.
10. Save the template by right-clicking anywhere in the Revision Table and choosing
Save As ➪ Rev Table Templates. Then save it to the appropriate location outside the
SolidWorks installation directory.
Summary
SolidWorks enables you to work with both tables that are highly specialized for particular uses,
and General Tables, which are available for any type of tabulated data. The most frequently used
types are BOMs, Hole Tables, and Revision Tables. Design Tables that drive part and assembly
configurations can also be placed on a 2D drawing, but in these cases, some formatting is usually
necessary to make the Design Table presentable and the information on it easy to read.
Other types of tables, such as Gauge Tables and Bend Tables, and Weldment Cut Lists are special-
ized for sheet metal and weldment parts, respectively, and are discussed in chapters that cover
those topics.
793
CHAPTER
Using Layers, Line
Fonts, and Colors
IN THIS CHAPTER
Using layers
Specifying line format settings
Hiding edges in drawing views
Using drawing display tools
tutorial
A
utoCAD has left its mark on CAD users of all kinds in the form of the
default expectations users have about CAD software. A few common
expectations are that layers, the Command Line, and paper space/
model space need to exist in order for graphical software to be considered
CAD, and printing should be really difficult.
When former AutoCAD users make the switch to SolidWorks, the questions
start: Where is the Command Line? How do I put parts on layers? How do I
change the background color to black? And my personal favorite, Where is
the zero-radius trim?
This chapter addresses AutoCAD-like functions in the SolidWorks drawing
environment. The goal is not to make the functions look or work or compare
in any way to AutoCAD, but to simply to make them useful in the context of
the SolidWorks software. It is never productive to try to use SolidWorks as if
it were AutoCAD. If you are making the transition, you will be much further
ahead if you just embrace SolidWorks for what it is, and accept that it does
not work like AutoCAD. You will be even further ahead if you do not assume
that AutoCAD functionality is universal.
Controlling Layers
Layers are only available in SolidWorks drawing documents, not in 3D
modeling or even sketching at all. Even in drawings, layers do not see a lot of
use. This is not to say that they serve no purpose, just that the software does
not depend on them.
Part V: Creating Drawings
794
Layers in imported 2D data
When you import data through DXF (Data eXchange Format) or DWG format files, the layers that
exist in the original data are brought forward into SolidWorks, and you can use them in a similar
way to the original AutoCAD usage. For example, you can select and deselect layers (visible or
hidden), and you can change layer names, descriptions, color, line thickness, and line style.
The way you intend to use the imported data determines how you should open the file. If you only
intend to view and print the drawing, then I would suggest using DWG Editor, which is installed
with SolidWorks and enables you to do almost anything you can do with basic AutoCAD. It also
has the advantage of having a familiar interface for the AutoCAD user. DWG editor is available
from the Start menu, by choosing Programs ➪ SolidWorks ➪ DWGeditor.
If you need to integrate data from the imported document into a native SolidWorks drawing, you
can open the DWG file from the normal Open dialog box in SolidWorks.
Tip
If you want to make a 3D part from the 2D data in the DWG file, you may want to import the drawing into the
part sketch environment. This usually leads to some speed issues. If you prefer, sketch entities can also be
copied from the drawing to the model sketch. You can even copy entities from DWG Editor to the SolidWorks
sketch. The sketch needs to be open in order to paste the sketch entities. In the case where imported 2D data is
brought into the model sketch, you lose all the layer information because part and assembly documents do not
allow layers.
n
The colors assigned to layers in data coming from AutoCAD are often based on a black background,
and so they can be difficult to see on a white background. The two ways of dealing with this are to
change the SolidWorks drawing sheet color to something dark or to change the individual layer
colors to something dark. Either method is easy, although if you have to send the 2D data back to
its source, it may be best to temporarily change the drawing sheet color.
Figure 25.1 shows the layer interface with an imported drawing in the background. To open the
Layers dialog box, click the Layer Properties button, which is found on both the Layer and Line
Format toolbars.
Be aware that many items in an imported drawing may come into SolidWorks as blocks. These
items may need to be exploded before you can work with them. This is often the case with the
drawing border, title block, or format.
Layers on the sheet format
One of the most obvious uses of layers is for the drawing border sketch lines on the sheet format.
The sketch lines used to create the border often have a heavier line weight and a different color
that easily distinguishes them from model geometry.
Chapter 25: Using Layers, Line Fonts, and Colors
795
FIGURE 25.1
The Layers dialog box and the Layer toolbar
You can assign layers in one of three ways:
l
Select existing items, and then select a layer from the drop-down list on the Layer toolbar.
l
Set the active layer and create new items.
l
While creating items such as sketch entities and annotations, select the layer for the new
entity directly from the PropertyManager.
To set a layer to the active layer, double-click it from the Layers dialog box, as shown in Figure
25.1, or change it from the drop-down list on the Layer toolbar. When you assign an active layer,
other newly created entities are also placed on the layer, not just sketch entities. Symbols, annotations,
blocks, and other elements can also be put onto layers. If you are not particular about the layering
scheme on a drawing, then it may be advisable to set the active layer to None, which is a valid
option in the Layer toolbar drop-down list.
When you create a new layer in SolidWorks, the new layer becomes the active layer, and any new
items that are added are automatically placed on that layer.
Another option when building a sheet format, or any other drawing function that requires sketching,
is to use a special layer for construction geometry. This enables you to hide the layer when it is not
being used, but it still maintains its relations. Hidden layers can be used in several other ways (for
example, as standard notes on the drawing) and they can be easily turned on or off.
Part V: Creating Drawings
796
Dimensions and notes on layers
SolidWorks drawings have a tendency to be drab black-and-white drawings in contrast to
AutoCAD drawings, which often seem to take on a plethora of contrasting colors. Still, drawings
are often a little easier to comprehend when different types of items are colored differently, but in
order for to do this, you must apply the coloring scheme consistently. Dimensions and annotations
can also be placed on layers in the three ways described in the previous section (active layer, from
the PropertyManager during creation, and through the drop-down list on the Layer toolbar).
However, the line styles do not affect dimensions and notes, only the color and visibility settings.
Components on layers
Assembly drawings probably suffer the most from the monochromatic nature of most SolidWorks
drawings because individual components can be difficult to identify when everything is the same
color. This is why SolidWorks users typically color parts in the shaded model assembly window. It
only makes sense that they would want to do the same thing on the drawing.
An intuitive and easy workaround for this problem would seem to be to simply turn the drawing
view to a wireframe mode just as you can change a drawing view to a shaded mode to show the
parts in color. Unfortunately, wireframe on drawings always defaults to black edges. Even if you
set a Display State using some wireframe parts where the wireframe displays in the same color as
the shaded part in the assembly window, this still appears in black and white on the drawing.
Your only option to display the components of an assembly in different colors while using a
wireframe display mode is to set the Component Line Font options. (Line Fonts are covered in the
next section.) The Component Line Font dialog box contains a Layer setting, which you can use to
put a part on a layer. If the layer is set up with a color, then the part displays with that color in all
views of the drawing or in just the current view, depending on your settings. While it does take a
little time to set up the individual layers for each part and then to set the parts to the layers, it is
better than the alternative, which is to do nothing.
You can access the Component Line Font dialog box by right-clicking a component in a drawing
view. The Component Line Font dialog box is shown in Figure 25.2.
In normal use, the Use document defaults option is selected and all the settings in the dialog box
are grayed out. To gain access to these settings, you must deselect the Use document defaults
option, as shown in Figure 25.2.
Chapter 25: Using Layers, Line Fonts, and Colors
797
FIGURE 25.2
The Component Line Font dialog box
Controlling Line Format
The Line Format toolbar contains the Layer tool and four additional tools that control lines: Line
Color, Line Thickness, Line Style, and Color Display Mode. These settings can be controlled
separately from layers; therefore, they can be used in model sketches as well as on drawings. In the
model, the line font can only be displayed for inactive sketches. Any sketch that is both closed and
shown can be displayed with the Line Format settings.
Cross-Reference
For more information on using line styles in the model, see Chapter 6.
n
Figure 25.3 shows the Line Format toolbar along with the interfaces for Line Color, Line
Thickness, and Line Style.
Part V: Creating Drawings
798
FIGURE 25.3
The Line Format toolbar and related interface options
Note
The term line font refers to a combination of style, end cap, and thickness. To set line fonts, choose
Tools ➪ Options ➪ Document Properties ➪ Line Font and use the document-specific settings.
n
Using the Line Format settings
You can specify the Line Format settings using two different methods. In the first method, you can
set them with nothing selected, in which case they function like System Options (the new setting
takes effect for all documents that are opened on the current computer). In the second method, if
they are set with sketch entities or edges selected, then the settings apply only to the selected
entities.
Caution
If you change these settings with nothing selected, then the Line Format settings for color, thickness, and style
function as system options.
n
End Cap Style
Another option for the Line Font settings is the End Cap Style. This offers an important option,
especially for thick lines. The three options are flat, round, and square. Of these, the square style is
usually most appropriate. In the past, flat was the default style. To find this setting, choose
Tools ➪ Options ➪ Document Properties ➪ Line Font. You may want to change this setting and
update your drawing template files.
Figure 25.4 shows the difference between the three options of End Cap Style.
Chapter 25: Using Layers, Line Fonts, and Colors
799
FIGURE 25.4
The End Cap Style setting options
Line Thickness settings
The Line Thickness settings are Default, Custom, and eight width settings. Interestingly, the
different thicknesses are named in the interface where you set the actual thicknesses, but not in
the interface where you set lines to thicknesses. Figure 25.5 shows the Line Thickness page
(Tools ➪ Options ➪ Document Properties ➪ Line Thickness).
FIGURE 25.5
The Line Thickness settings in Tools ➪ Options
The way the line thickness is shown in the drawing does not have anything to do with the
numerical width that is assigned to it. For example, in Figure 25.5, notice that Thick(2) is set to
0.1 inch, which is much wider than Thick(3). Changing the numbers only affects printed line
thickness; it does not affect the display at all.
Caution
The Line Thickness settings are document options, not system options. As a result, two drawings with the same
line type assignments may have different numerical widths; thus, the two drawings would print differently on
the same computer.
n
Part V: Creating Drawings
800
Line Style setting
You can create custom line styles using the syntax shown on the Line Style page (Tools ➪
Options ➪ Document Properties ➪ Line Style). This is a document-specific setting; therefore, if you
make a custom line style and want to use it in another document, you have to save it out (as a
*.sldlin file) and load it into the other document. Also, if you save your templates with this line
style loaded, then you will not have to load the styles for any document made from that template.
Color Display mode
Color Display mode toggles between the display of assigned colors and standard sketch state
colors. This is primarily used in drawings when you are making sketches where sketch relations
are important.
Hiding and Showing Edges
Sometimes, for illustrative purposes, it is desirable to hide certain edges in drawing views. The
Hide/Show Edge toolbar button is on the Line Format toolbar, although it may not be on the
toolbar by default. You can choose Tools ➪ Customize to put it on a toolbar.
To use the Hide Edge tool, simply select the edges that you would like to hide, and click the Hide
Edge toolbar button. To show the edges, click the Show Edge toolbar button; the cursor will now
be able to select the hidden edges.
Be aware that if your view is in Draft Mode, edges that you hide will still be shown until the view is
made into a High Quality view.
Note
Hide/Show Edges was formerly two separate toolbar buttons. In SolidWorks 2010, they are in a single button.
n
Tutorial: Using Drawing Display Tools
Some of the functions described in this chapter are difficult to understand until you actually use
them. This tutorial guides you through the functions step by step so that you can see them in
action. Start here:
1. From the CD-ROM, open the drawing called Chapter 25 – Tutorial.slddrw.
Make sure that the Layer and Line Format toolbars are active and that the Hide/Show
Edges buttons are available on the Line Format toolbar.
2. Right-click a blank space and select Edit Sheet Format from the menu.
Chapter 25: Using Layers, Line Fonts, and Colors
801
3. Window+select everything on the format and use the drop-down list on the Layers
toolbar to assign the selection to the Border layer. Notice that this changes the color
and the thickness of the sketch lines.
4. Right-click a blank space and select Edit Sheet.
5. Click the Layer Properties button on either the Layer or Line Format toolbar. Add
new layers for each of the part groups, bracket, clevis, pins, and blocks, assigning
different colors to each layer. Figure 25.6 shows the Layers dialog box with these layers
created.
FIGURE 25.6
The Layers dialog box
Caution
Be aware that creating new layers leaves the last layer that you created active, as indicated by the yellow
arrow in Figure 25.6. There is no way to set the active layer to None from the Layers dialog box; you have to
do this using the drop-down list in the Layer toolbar.
n
6. Set the active layer to None in the Layer toolbar drop-down list.
7. Right-click the Bracket part in one of the views and select Component Line Font.
Deselect the Use Document Defaults option, and select the Bracket layer from the
drop-down list in the lower-right corner of the dialog box, as shown in Figure 25.7.
Make sure that the Drawing View option is set to All views.
8. Repeat Step 7 for all the components, assigning each component to its own layer.
Notice how this makes the parts easier to identify.
Note
Alternatively, you could simply change the line style and thickness for each component. This saves you creating
the layers, but you lose the color settings. The way SolidWorks handles line thickness and thickness values has
changed significantly in SolidWorks 2010. The line thickness assignments in the Print dialog are still the old
format.
n
Part V: Creating Drawings
802
FIGURE 25.7
The Component Line Font dialog box
9. Open the Component Line Font dialog box for the Bracket part again. This time, set
the Line thickness to 0.0787, and click OK. You may have to rebuild the drawing to
show the change (Ctrl+B or Ctrl+Q). Figure 25.8 shows a detail of the corners that are
created by the thick lines. Notice the notches created at the corners.
FIGURE 25.8
Applying thick edges
10. These notches are supposed to be fixed using the End Cap setting at Tools ➪
Options ➪ Document Properties ➪ Line Font. Set the End Cap Style to Square. Click
OK to exit the Document Properties. In the drawing, select inside the view where you are
working and make sure that it is set to High Quality. (The setting is found in the
PropertyManager for the view in the Display Style panel. If it is already set to High
Quality, then there will be no other view option; if it is not, then there will be an option
that is set to Draft Quality.)
Chapter 25: Using Layers, Line Fonts, and Colors
803
The image to the left in Figure 25.8 is the old setting with the draft quality view, and the
image to the right is the new setting with the high quality view.
11. In the Component Line Font dialog box, set the Line Weight setting back to Default
for the Bracket part, but keep it on the Bracket layer.
12. In the isometric view, Ctrl+click all the tangent edges on the Bracket part, as shown
in Figure 25.9. Click the Hide/Show Edges toolbar button on the Line Format toolbar.
FIGURE 25.9
Hiding edges
Before After
13. Click the Hide/Show Edges toolbar button. The PropertyManager message changes to
indicate that you can now select hidden edges, and the hidden edges are shown.
Ctrl+select the hidden edges and right-click when you are done.
Summary
While SolidWorks is not primarily built around the strength of its 2D drawing functionality, it
offers more capabilities than most users take advantage of. Layers in SolidWorks offer adequate
functionality, but could be improved by some automation to put parts on layers automatically; this
would enable SolidWorks to show the parts in wireframe with the same colors assigned to the
solid.
Other line and edge display functionality is sometimes difficult to find or access, or may have
obscure functions. Creating drawings that use color to make them easier to read should be easier
in SolidWorks than it is in AutoCAD.
T
he techniques on display in Part VI certainly fall
into the advanced category. Not everyone needs
these tools, but for those who do, advice on them
can be difficult to find from other sources. I encourage you
to explore the tools available here. All three chapters go
together, so it is most beneficial to read them all in order.
Multi-body modeling is a technique that can open up new
methods for you and help you realize the full potential of
the software. Surfacing enables you to unlock the complete
potential of SolidWorks and is as much for reference geom-
etry as it is for complex shape creation. Master Model tech-
niques enable you to drive several parts from a single part
without using in-context assemblies.
IN THIS PART
Chapter 26
Modeling Multi-bodies
Chapter 27
Working with Surfaces
Chapter 28
Employing Master Model
Techniques
Using Advanced
Techniques
Part VI