A Guide to MATLAB for Beginners and Experienced Users phần 10 pps
Bạn đang xem bản rút gọn của tài liệu. Xem và tải ngay bản đầy đủ của tài liệu tại đây (275.87 KB, 39 trang )
Solutions to Practice Set C: Developing Your MATLAB Skills
273
(d)
Next we halve both:
f2 = @(V) f(V, 1.5, 1000, 10ˆ(-5)/2, .0025/2);
fzero(f2, [0, 0.5])
ans =
0.0071
The voltage is less than in part (b) but more than in part (c).
(e)
X = 10.ˆ(0:-1:-5);
f3 = @(V, x) f(V, 1.5, 1000, 10ˆ(-5)*x, .0025*x);
VD = 0:5; % initialize vector of VD-values
for j = 1:6
f4 = @(V) f3(V, X(j));
VD(j) = fzero(f4, [0, X(j)/10]);
end
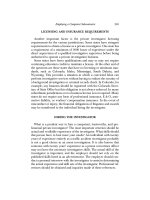
loglog(10ˆ(-5)*X, VD, ’x-’)
xlabel ’I_0’
ylabel ’V_D’
10
−10
10
−5
10
−8
10
−6
10
−4
10
−2
10
0
I
0
V
D
The loglog plot appears linear. This suggests that VD is roughly a constant times a
power of I0.
11.
(a)
dsolve(’Dx = x - xˆ2’)
274
Solutions to the Practice Sets
ans =
1/(1+exp(-t)*C1)
syms x0; sol = dsolve(’Dx = x - xˆ2’, ’x(0) = x0’)
sol =
1/(1-exp(-t)*(-1+x0)/x0)
Note that this includes the zero solution; indeed,
bettersol = simplify(sol)
bettersol =
-x0/(-x0-exp(-t)+exp(-t)*x0)
subs(bettersol, x0, 0)
ans =
0
(b)
We have already solved the equation in (a) above, so all we need to do is to substitute
the initial conditions in for x0 and plot the results. We increase the LineWidth
from its default value so that the zero solution stands out better.
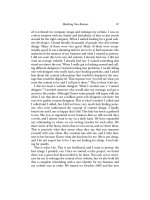
T = 0:0.1:5;
cla reset; hold on
solcurves = @(t,x0) eval(vectorize(bettersol));
for initval = 0:0.25:2.0
plot(T, solcurves(T, initval), ’LineWidth’, 1.5)
end
axis tight
title ’Solutions of Dx = x - xˆ2, with x(0) = 0, 0.25, , 2’
xlabel ’t’
ylabel ’x’
hold off
Solutions to Practice Set C: Developing Your MATLAB Skills
275
0 1 2 3 4 5
0
0.5
1
1.5
2
Solutions of Dx = x − x
2
, with x(0) = 0, 0.25, , 2
t
x
The graphical evidence suggests that the solution that starts at zero stays there; all the
others tend toward the constant solution 1.
(c)
To use ode45, we want to write the differential equations as a single equation in a
vector variable x. Its two components represent the two populations x and y.
cla reset; hold on
f = @(t,x) [x(1) - x(1)ˆ2 - 0.5*x(1)*x(2);
x(2) - x(2)ˆ2 - 0.5*x(1)*x(2)];
for a = 0:1/12:13/12
for b = 0:1/12:13/12
[t, xa] = ode45(f, [0 3], [a, b]);
plot(xa(:, 1), xa(:, 2))
end
end
axis([0 13/12 0 13/12]); hold off
0 0.2 0.4 0.6 0.8 1
0
0.2
0.4
0.6
0.8
1
276
Solutions to the Practice Sets
(d)
The endpoints on the curves are the start points. So clearly any curve that starts inside
the first quadrant, that is one that corresponds to a situation in which both populations
are present at the outset, tends toward a unique point – which from the graph appears
to be about (2/3, 2/3). In fact, if x = y =2/3, then the right-hand sides of both
equations in (C.4) vanish, so the derivatives are zero and the values of x(t) and y(t)
remain constant – they don’t depend on t. If only one species is present at the outset,
that is you start out on one of the axes, then the solution tends toward either (1, 0)
or (0, 1) depending on whether x or y is the species present. That is precisely the
behavior we saw in part (b).
(e)
cla reset; hold on
f = @(t,x) [x(1) - x(1)ˆ2 - 2*x(1)*x(2);
x(2) - x(2)ˆ2 - 2*x(1)*x(2)];
for a = 0:1/12:13/12
for b = 0:1/12:13/12
[t, xa] = ode45(f, [0 3], [a, b]);
plot(xa(:, 1), xa(:, 2))
end
end
axis([0 13/12 0 13/12]); hold off
0 0.2 0.4 0.6 0.8 1
0
0.2
0.4
0.6
0.8
1
This time most of the curves seem to be tending toward one of the points (1, 0) or
(0, 1) – in particular, any solution curve that starts on one of the axes (corresponding
to no initial population for the other species) does so. It seems that whichever species
has a greater population at the outset will eventually take over all the population –
the other will die out. But there is a delicate balance in the middle – it appears that,
if the two populations are about equal at the outset, then they tend to the unique
population distribution at which, if you start there, nothing happens. That value looks
like (1/3, 1/3). In fact, that is the value that renders both sides of (C.5) zero – which
is analogous to the role (2/3, 2/3) hadinpart(d).
Solutions to Practice Set C: Developing Your MATLAB Skills
277
(f)
It makes sense to refer to the model (C.4) as “peaceful coexistence,” since whatever
initial populations you have – provided that both are present – you wind up with equal
populations eventually. “Doomsday” is an appropriate name for model (C.5) since, if
you start out with unequal populations, then the smaller group becomes extinct. The
lower coefficient 0.5 means relatively small interaction between the species, allowing
their coexistence. The larger coefficient 2 means stronger interaction and competition
precluding the survival of both.
12.
Here is a Simulink model for redoing the pendulum application from Chapter 9:
open_system pendulum
sin x
XY Graph
sin
Trigonometric
Function
Scope
1
s
Integrator1
1
s
Integrator
−K−
Gravity
0.5
Friction
x"
x
x
x
x’
x’
x’
With the initial conditions x(0) = 0 and ˙x(0) = 10, the XY Graph block shows the
following phase portrait of x versus ˙x.
[t, x] = sim(’pendulum’);
0 5 10
−4
−2
0
2
4
6
8
10
X Axis
Y Axis
X Y Plot
Meanwhile, the Scope block gives the following graph of x as a function of t.
278
Solutions to the Practice Sets
simplot(t, x(:,1))
axis([0 30 0 15])
0 5 10 15 20 25 30
0
5
10
15
Time
13.
Here is a Simulink model for studying the equation of motion of a baseball.
open_system baseball
y vs. t
magnitude
of velocity
[80,80]
initial
velocity
XY Graph
sqrt
Math
Function
1
s
x
o
Integrate
x’’ to get x’
1
s
Integrate
x’ to get x
−C−
Gravity
0
Gain
Dot Product
e
m
Compute
acceleration
due to drag
|x’|
The way this works is fairly straightforward. The Integrator block in the upper left
integrates the acceleration (a vector quantity) to get the velocity (also a vector). This
block requires the initial value of the velocity as an initial condition; we define it in
the “initial velocity” Constant block. Output from the first Integrator goes into the
second Integrator, which integrates the velocity to get the position (also a vector).
The initial condition for the position, [0, 4], is stored in the parameters of this
second Integrator. The position vector is fed into a Demux block, which splits off
the horizontal and vertical components of the position. These are fed into the XY
Graph block, and also the vertical component is fed into a scope block so that we can
see the height of the ball as a function of time. The hardest part is the computation
of the right-hand side of (C.7). This is computed by adding the two terms on the
Solutions to Practice Set C: Developing Your MATLAB Skills
279
right with the Sum block near the lower left. The value of [0, -g] is stored in the
“gravity” Constant block. The second term on the right is computed in the Product
block labeled “Compute acceleration due to drag,” which multiplies the velocity (a
vector) by −c times the speed (a scalar). We compute the speed by taking the dot
product of the velocity with itself and then taking the square root; then we multiply
by −c in the Gain block in the middle bottom of the model. The Scope block in the
lower right plots the ball’s speed as a function of time.
(a)
With c set to 0 (no air resistance) and the initial velocity set to [80, 80], the ball follows
a familiar parabolic trajectory, as seen in the following picture.
[t, x] = sim(’baseball’);
0 100 200 300 400 500
0
50
100
150
X Axis
Y Axis
X Y Plot
Note that the ball travels about 400 feet before hitting the ground, so the trajectory
is just about what is required for a home run in most ballparks. We can read off the
flight time and final speed from the other two scopes:
simplot(t, x(:,2))
axis([0 10 0 150])
title ’Height versus Time’
280
Solutions to the Practice Sets
0 2 4 6 8 10
0
50
100
150
Time
Height versus Time
simplot(t, sqrt(x(:,3).ˆ2 + x(:,4).ˆ2))
axis([0 10 50 300])
title ’Speed versus Time’
0 2 4 6 8 10
50
100
150
200
250
300
Time
Speed versus Time
Thus the ball stays in the air about 5.0 seconds and is traveling at about 115 ft/sec
when it hits the ground. (Notice that the simulation continues beyond this time; since
the model doesn’t take into account hitting the ground, the height continues to de-
crease and the velocity continues to increase as if the ball had been batted off a cliff.)
Now let’s see what happens when we factor in air resistance, again with the initial
velocity set to [80, 80]. First we take c =0.0017. The trajectory now looks like this:
set_param(’baseball/Gain’, ’Gain’, ’-0.0017’)
[t, x] = sim(’baseball’);
Solutions to Practice Set C: Developing Your MATLAB Skills
281
0 100 200 300 400 500
0
50
100
150
X Axis
Y Axis
X Y Plot
Note the enormous difference air resistance makes; the ball travels only about 270
feet. We can also investigate the flight time and speed with the other two scopes:
simplot(t, x(:,2))
axis([0 10 0 150])
title ’Height versus Time’
0 2 4 6 8 10
0
50
100
150
Time
Height versus Time
simplot(t, sqrt(x(:,3).ˆ2 + x(:,4).ˆ2))
axis([0 10 50 300])
title ’Speed versus Time’
282
Solutions to the Practice Sets
0 2 4 6 8 10
50
100
150
200
250
300
Time
Speed versus Time
So the ball is about 80 feet up in the air at its peak, and hits the ground in about 4.5
seconds.
(b)
Let’s now redo exactly the same calculation with c =0.0014 (corresponding to play-
ing in Denver). The ball’s trajectory is now
set_param(’baseball/Gain’, ’Gain’, ’-0.0014’)
[t, x] = sim(’baseball’);
0 100 200 300 400 500
0
50
100
150
X Axis
Y Axis
X Y Plot
The ball goes about 285 feet, or about 15 feet further than when playing at sea level.
This particular ball is probably an easy play, but, with some hard-hit balls, those extra
15 feet could mean the difference between an out and a home run. If we look at the
height scope for the Denver calculation, we see:
simplot(t, x(:,2))
axis([0 10 0 150])
title ’Height versus Time’
Solutions to Practice Set C: Developing Your MATLAB Skills
283
0 2 4 6 8 10
0
50
100
150
Time
Height versus Time
so there is a very small increase in the flight time. Similarly, if we look at the speed
scope for the Denver calculation, we see:
simplot(t, sqrt(x(:,3).ˆ2 + x(:,4).ˆ2))
axis([0 10 50 300])
title ’Speed versus Time’
0 2 4 6 8 10
50
100
150
200
250
300
Time
Speed versus Time
So the final speed is a bit faster, about 83 ft/sec.
(c)
One would expect that batting averages and earned run averages would both be higher
in Denver, as indeed is the case according to Major League Baseball statistics.
14.
The following M-file performs the desired task:
284
Solutions to the Practice Sets
type editrecent
function editrecent
directory = dir(’*.m’);
if any(size(directory) == 0)
error(’No M-files found.’)
end
dates = datenum({directory.date});
[maximum, index] = max(dates);
edit(directory(index).name)
By assigning the output of dir to a variable, we get a structure array that contains
among other things the names of all the M-files in the current directory and their
modification dates. If the structure array has 0 elements, we print an error message.
Otherwise, we form the dates into a cell array of strings, and use datenum to convert
the strings into numbers. We find the index of the largest number, indicating the most
recent date, and finally pass the name of the corresponding file to edit.
15.
As suggested in the hint, we start by defining an array Z of complex numbers whose
real parts are chosen from the vector xvals and whose imaginary parts are chosen
from the vector yvals.
xvals = linspace(-2, 2, 400);
yvals = linspace(-1.5, 1.5, 300);
[X, Y] = meshgrid(xvals, yvals);
Z = X + i*Y;
Next we then apply the given function 100 times to each number in the array. By that
time, most of the sequences that are going to diverge to infinity have already become
larger than the largest floating-point number that MATLAB can store.
for k = 1:100
Z = Z.ˆ2 - 0.75;
end
We now use isfinite to assign a value of 1 to the values in the array that are
still finite floating-point numbers and 0 to those that have diverged. We then use
imagesc to color the points with ones differently from those with zeros, and select a
gray colormap to make the colors white and black. Finally, we use set to reverse the
vertical axis; without this command, the lower numbers would appear at the top of the
graph. This is the default for image and imagesc, but is not the way mathematical
graphs are normally drawn.
Solutions to Practice Set C: Developing Your MATLAB Skills
285
clf reset
set(gcf, ’Color’, ’White’)
imagesc(xvals, yvals, isfinite(Z))
colormap(gray)
set(gca, ’YDir’, ’normal’)
axis equal tight
−2 −1 0 1 2
−1.5
−1
−0.5
0
0.5
1
1.5
The Julia set consists (approximately) of the boundary between the black and white
regions. This boundary is an example of a “fractal,” and you can draw a variety of
other fractals by changing the expression z
2
− 0.75. For example, try changing 0.75
to 0.75 + 0.1i and see what a difference it makes!
Glossary
We present here the most commonly used MATLAB objects in six categories: op-
erators, built-in constants, built-in functions, commands, graphics commands, and
MATLAB programming constructs. After this we list the most important Simulink
commands and blocks. Though MATLAB does not distinguish between commands
and functions, it is convenient to think of a MATLAB function as we normally think of
mathematical functions. A MATLAB function is something that can be evaluated or
plotted; a command is something that manipulates data or expressions or that initiates
a process.
We list each operator, function, and command together with a short description
of its effect, followed by one or more examples. Many MATLAB commands can
appear in a number of different forms, because you can apply them to different kinds
of objects. In our examples, we have illustrated the most commonly used forms of
the commands. Many commands also have numerous optional arguments; in this
Glossary, we have included only some very common options. You can find a full
description of all forms of a command, and get a more complete accounting of all the
optional arguments available for it, by reading the help text – which you can access
by typing either help <commandname> or doc <commandname>.
This Glossary is not comprehensive. We have selected those MATLAB com-
mands that play a prominent role in this book, or that we believe will be most helpful
to the user. You can find a more comprehensive list in the Help Browser.
☞ See Online Help in Chapter 2 for a detailed description of the Help Browser.
MATLAB Operators
\ Left matrix division. X = A\B is the solution of the equation A*X = B. Type help
slash for more information.
A = [1 0; 2 1]; B = [3; 5];
A\B
/ Ordinary scalar division, or right matrix division. For matrices, A/B is essentially equiv-
alent to A*inv(B). Type help slash for more information.
* Scalar or matrix multiplication. See the online help for mtimes.
. Not a true MATLAB operator. Used in conjunction with arithmetic operators to force
element-by-element operations on arrays. Also used to access fields of a structure array.
a = [1 2 3]; b = [4 -6 8];
a.*b
syms x y; solve(x + y - 2, x - y); ans.x
.* Element-by-element multiplication of arrays. See the previous entry and the online help
for times.
ˆ Scalar or matrix powers. See the online help for mpower.
287
288
Glossary
.ˆ Element-by-element powers. See the online help for power.
: Range operator, used for defining vectors and matrices. Type help colon for more
information.
, Separates elements of a row of a matrix, or arguments to a command. Can also be used
to separate commands on a command line.
; Suppresses output of a MATLAB command, and can be used to separate commands on a
command line. Also used to separate the rows of a matrix or column vector.
X = 0:0.1:30;
[1; 2; 3]
’ Complex conjugate transpose of a matrix. See ctranspose. Also delimits the begin-
ning and end of a string.
.’ Transpose of a matrix. See transpose.
Line-continuation operator. Cannot be used inside quoted strings. Type help
punct for more information.
1+3+5+7+9+11
+13+15+17
[’This is a way to create very long strings that ’,
’span more than one line. Note the square brackets.’]
! Runs a command from the operating system.
!C:\Programs\program.bat
% Comment. MATLAB will ignore the rest of the same line.
%% Starts a new cell (if it occurs at the beginning of a line in a script M-file).
@ Creates a function handle or anonymous function.
fminbnd(@cos, 0, 2*pi)
f = @(x) x.ˆ2 - x
Built-in Constants
eps Roughly the size of the computer’s floating-point round-off error; on most computers
it is around 2 ×10
−16
.
exp(1) e =2.71828 Note that e has no special meaning.
i i =
√
−1. This assignment can be overridden, e.g., if you want to use i as an index in a
for loop. In that case j can be used for the imaginary unit.
Inf ∞.Alsoinf.
NaN Not a number. Used for indeterminate expressions like 0/0.
pi π =3.14159
Built-in Functions
abs |x|.
acos arccos x.
asin arcsin x.
289
atan arctan x.Useatan2 instead if you want the angular coordinate θ of the point
(x, y).
bessel Bessel functions; besselj(n, x) and bessely(n, x) are linearly inde-
pendent solutions of Bessel’s equation of order n.
conj Gives the complex conjugate of a complex number.
conj(1 - 5*i)
cos cos x.
cosh cosh x.
cot cot x.
erf The error function erf(x)=(2/
√
π)
x
0
e
−t
2
dt.
exp e
x
.
expm Matrix exponential.
gamma The gamma function Γ(x)=
∞
0
e
−t
t
x−1
dt (when Re x>0). The property
Γ(k +1)=k!, for non-negative integers k, is sometimes useful.
imag imag(z), the imaginary part of a complex number.
log The natural logarithm ln x =log
e
x.
real real(z), the real part of a complex number.
sec sec x.
sech sech x.
sign Returns −1, 0, or 1, depending on whether the argument is negative, zero, or positive.
sin sin x.
sinh sinh x.
sqrt
√
x.
tan tan x.
tanh tanh x.
MATLAB Commands
addpath Adds the specified directory to MATLAB’s file-search path.
addpath C:\my_mfiles
ans A variable holding the value of the most recent unassigned output.
cd Makes the specified directory the current (working) directory.
cd C:\mydocs\mfiles
char Converts a symbolic expression into a string. Useful for defining inline functions.
syms x y; f = inline(char(sin(x)*sin(y)))
clear Clears values and definitions for variables and functions. If you specify one or
more variables, then only those variables are cleared.
clear
clear f g
collect Collects coefficients of powers of the specified symbolic variable in a given
symbolic expression.
290
Glossary
syms x y; collect(xˆ2 - 2*y*xˆ2 + 3*x + x*y, x)
compose Composition of functions.
syms x y; f = exp(x); g = sin(y); h = compose(f, g)
ctranspose Conjugate transpose of a matrix. Usually invoked with the ’ operator.
Equivalent to transpose for real matrices.
A=[13i]
A’
D Not a true MATLAB command. Used in dsolve to denote differentiation. See diff.
dsolve(’x*Dy + y = sin(x)’, ’x’)
delete Deletes a file.
delete <filename>
det The determinant of a matrix.
det([1 3; 4 5])
diag Gives a square matrix with a prescribed diagonal vector, or picks out the diagonal in
a square matrix.
V = [2 3 4 5]; diag(V)
X = [2 3; 4 5]; diag(X)
diary Writes a transcript of a MATLAB session to a file.
diary <filename>
diary off
diff Symbolic differentiation operator (also difference operator).
syms x; diff(xˆ3)
diff(’x*yˆ2’, ’y’)
dir Lists the files in the current working directory. Similar to ls.
disp Displays output without first giving its name.
x = 5.6; disp(x)
syms x; disp(xˆ2)
disp(’This will print without quotes.’)
doc Opens the Help Browser to documentation on a specific command.
doc print
double Gives a double-precision value for either a numerical or a symbolic quantity. Ap-
plied to a string, double returns a vector of ASCII codes for the characters in the string.
z = sym(’pi’); double(z)
double(’think’)
dsolve Symbolic ODE solver. By default, the independent variable is t, but a different
variable can be specified as the last argument.
dsolve(’D2y - x*y = 0’, ’x’)
dsolve(’Dy + yˆ2 = 0’, ’y(0) = 1’, ’x’)
[x, y] = dsolve(’Dx = 2x + y’, ’Dy = -x’)
echo Turns on or off the echoing of commands inside script M-files.
edit Opens the specified M-file in the Editor/Debugger.
edit mymfile
eig Computes eigenvalues and eigenvectors of a square matrix.
eig([2, 3; 4, 5])
[e, v] = eig([1, 0, 0; 1, 1, 1; 1, 2, 4])
291
end Last entry of a vector. Also a programming command.
v(end)
v(3:end)
eval Evaluates a string as a MATLAB expression. Useful in M-files.
eval(’cos(x)’)
expand Expands an algebraic expression.
syms x y; expand((x - y)ˆ2)
eye The identity matrix of the specified size.
eye(5)
factor Factors a polynomial or integer.
syms x y; factor(xˆ4 - yˆ4)
feval Evaluates a function specified by a string. Useful in function M-files.
feval(’exp’, 1)
find Finds the indices of non-zero elements of a vector or matrix.
X = [2 0 5]; find(X)
fminbnd Finds the smallest (approximate) value of a function over an interval.
fminbnd(@(x) xˆ4 - xˆ2 + 1, 0, 1)
format Specifies the output format for numerical variables.
format long
fzero Tries to find a zero of the specified function near a given starting point or on a
specified interval.
fzero(@(x) cos(x) - x, 1)
fzero(@cos, [-pi 0])
guide Opens the GUI Design Environment.
guide mygui
help Asks for documentation for a MATLAB command. See also lookfor.
help factor
inline Constructs a MATLAB inline function from a string expression.
f = inline(’xˆ5 - x’); f(3)
int Integration operator for both definite and indefinite integrals.
int(’1/(1 + xˆ2)’, ’x’)
syms x; int(exp(-x), x, 0, Inf)
inv Inverse of a square matrix.
inv([1 2; 3 5])
jacobian Computes the Jacobian matrix, or, for a scalar function, the symbolic gradient.
syms x y; f = xˆ2*yˆ3; jacobian(f)
length Returns the number of elements in a vector or string.
length(’abcde’)
limit Finds a two-sided limit, if it exists. Use ’right’ or ’left’ for one-sided limits.
syms x; limit(sin(x)/x, x, 0)
syms x; limit(1/x, x, Inf, ’left’)
linspace Generates a vector of linearly spaced points.
linspace(0, 2*pi, 30)
load Loads Workspace variables from a disk file.
292
Glossary
load filename
lookfor Searches for a specified string in the first line of all M-files found in the MAT-
LAB path.
lookfor ode
ls Lists files in the current working directory. Similar to dir.
maple Provides direct access to the Maple kernel. Not available in the Student Version.
maple(’csgn’, ’-1+i’)
mhelp Queries the Maple kernel for help on a Maple command. Not available in the
Student Version.
mhelp csgn
max Computes the arithmetic maximum of the entries of a vector.
X = [3 5 1 -6 23 -56 100]; max(X)
mean Computes the arithmetic average of the entries of a vector.
X = [3 5 1 -6 23 -56 100]; mean(X)
median Computes the arithmetic median of the entries of a vector.
X = [3 5 1 -6 23 -56 100]; median(X)
min Computes the arithmetic minimum of the entries of a vector.
X = [3 5 1 -6 23 -56 100]; min(X)
more Turns on (or off) page-by-page scrolling of MATLAB output. Use the S
PACE BAR
to advance to the next page, the RETURN key to advance line-by-line, and Q to abort the
output.
more on, help print
more off
notebook Opens an M-Book (Windows only).
notebook problem1.doc
notebook -setup
num2str Converts a number to a string. Useful in programming.
disp([’The value of pi is ’, num2str(pi)])
ode45 Numerical ODE solver for first-order equations. See MATLAB’s online help for
ode45 for a list of other MATLAB ODE solvers.
[t, y] = ode45(@(t, y) tˆ2 + y, [0 10], 1);
plot(t, y)
ones Creates a matrix of ones.
ones(3)
ones(3, 1)
open Opens a file. The way this is done depends on the filename extension.
open myfigure.fig
path Without an argument, displays the search path. With an argument, sets the search
path. Type help path for details.
pathtool Opens the “Set Path” tool.
pretty Displays a symbolic expression in a more readable format.
syms x y; expr = x/(x - 3)/(x + 2/y)
pretty(expr)
prod Computes the product of the entries of a vector.
293
X = [3 5 1 -6 23 -56 100]; prod(X)
publish Runs an M-file and “publishes” it. The default is to publish to html, but one
can specify other formats.
publish(’mymfile’, ’latex’)
pwd Shows the name of the current (working) directory.
quadl Numerical integration command. In MATLAB 5.3 or earlier, use quad8 instead.
format long; quadl(@(x) sin(exp(x)), 0, 1)
g = inline(’sin(exp(x))’); quad8(g, 0, 1)
quit Terminates a MATLAB session.
rand Random-number generator; creates arrays of random numbers between 0 and 1.
randn Normal random-number generator; creates arrays of normal random numbers with
mean 0 and variance 1.
rank Gives the rank of a matrix.
A = [2 3 5; 4 6 8]; rank(A)
roots Finds the roots of a polynomial whose coefficients are given by the elements of the
vector argument.
roots([1 2 2])
round Rounds a number to the nearest integer.
save Saves Workspace variables to a specified file. See also diary and load.
save filename
simple Attempts to simplify an expression using multiple methods.
syms x y;
[expression, how] = simple(sin(x)*cos(y) + cos(x)*sin(y))
simplify Attempts to simplify an expression symbolically.
syms x; simplify(1/(1 + x)ˆ2 - 1/(1 - x)ˆ2)
size Returns the number of rows and the number of columns in a matrix.
A=[132;415]
[r, c] = size(A)
solve Solves an equation or set of equations. If the right-hand side of the equation is
omitted, “0” is assumed.
solve(’2*xˆ2 - 3*x + 6’)
[x, y] = solve(’x + 3*y = 4’, ’-x - 5*y = 3’, ’x’, ’y’)
sound Plays a vector through the computer speakers.
sound(sin((0:0.1:1000)*pi))
str2num Converts a string to a number. Useful in programming.
constant = ’a7’
index = str2num(constant(2))
subs Substitutes for parts of an expression.
subs(’xˆ3 - 4*x + 1’, ’x’, 2)
subs(’sin(x)ˆ2 + cos(x)’, ’sin(x)’, ’z’)
sum Sums a vector, or sums the columns of a matrix.
k = 1:10; sum(k)
sym Creates a symbolic variable or number.
sym pi
294
Glossary
x = sym(’x’)
constant = sym(’1/2’)
syms Defines symbolic variables – syms x is equivalent to x = sym(’x’).
syms x y z
symsum Performs a symbolic summation of a vector, possibly with infinitely many entries.
syms x k n; symsum(xˆk, k, 0, n)
syms n; symsum(nˆ(-2), n, 1, Inf)
taylor Gives a Taylor polynomial approximation with a specified number of terms (the
default is 6) at a specified point (default 0). Note: the number of terms includes the
constant term, so the default is a polynomial of degree 5, not degree 6.
syms x; taylor(cos(x), 8, 0)
taylor(exp(1/x), 10, Inf)
transpose Transpose of a matrix (compare ctranspose). Converts a column vector
into a row vector, and vice versa. Usually invoked with the .’ operator.
A=[134]
A.’
type Displays the contents of a specified file.
type myfile.m
vectorize Vectorizes a symbolic expression. Useful in defining inline functions.
f = inline(vectorize(’xˆ2 - 1/x’))
vpa Evaluates an expression to the specified degree of accuracy using variable-precision
arithmetic.
vpa(’1/3’, 20)
web Opens a web browser.
web(’’)
which Displays the pathname of a command with a given name.
which ezplot
which ezplot -all
whos Lists current information on all the variables in the Workspace.
zeros Creates a matrix of zeros.
zeros(10)
zeros(3, 1)
Graphics Commands
area Produces a shaded graph of the area between the x-axis and a curve.
X = (0:0.01:4)*pi; Y = sin(X); area(X, Y)
axes Creates an empty figure window.
axis Sets axis scaling and appearance.
axis([xmin xmax ymin ymax]) – sets ranges for the axes.
axis tight – sets the axis limits to the full range of the data.
axis equal – makes the horizontal and vertical scales equal.
axis square – makes the axis box square.
axis off – hides the axes and tick marks.
bar Draws a bar graph.
295
bar([2, 7, 1.5, 6])
cla Clears axes.
close Closes the current figure window. close all closes all figure windows.
colormap Sets the colormap features of the current figure; type help graph3d to see
examples of colormaps.
ezmesh sin(x)*cos(y); colormap cool
comet Displays an animated parametric plot.
t = (0:0.01:4)*pi; comet(t.*cos(t), t.*sin(t))
contour Plots the level curves of a function of two variables; usually used with
meshgrid.
[X, Y] = meshgrid(-3:0.1:3, -3:0.1:3);
contour(X, Y, X.ˆ2 - Y.ˆ2)
contourf Filled contour plot. Often used with colormap.
[X,Y] = meshgrid(-2:0.1:2, -2:0.1:2);
contourf(X, Y, X.ˆ2 - Y.ˆ3);
colormap autumn
ezcontour Easy plot command for contour or level curves.
ezcontour(’xˆ2 - yˆ2’)
syms x y; ezcontour(x - yˆ2)
ezmesh Easy plot command for mesh view of surfaces.
ezmesh(’xˆ2 + yˆ2’)
syms x y; ezmesh(x*y)
ezplot Easy plot command for symbolic expressions.
ezplot(’exp(-xˆ2)’, [-5, 5])
syms x; ezplot(sin(x))
ezplot3 Easy plot command for 3D parametric curves.
ezplot3(’cos(t)’, ’sin(t)’, ’t’)
syms t; ezplot3(1 - cos(t), t - sin(t), t, [0 4*pi])
ezsurf Easy plot command for standard shaded view of surfaces.
ezsurf(’(xˆ2 + yˆ2)*exp(-(xˆ2 + yˆ2))’)
syms x y; ezsurf(sin(x*y), [-pi pi -pi pi])
figure Creates a new figure window.
fill Creates a filled polygon. See also patch.
fill([0 1 1 0], [0 0 1 1], ’b’); axis equal tight
findobj Finds graphics objects with specified property values.
findobj(’Type’, ’Line’)
gca Gets current axes.
gcf Gets current figure.
get Gets properties of a figure.
get(gcf)
getframe Command to get the frames of a movie or animation.
T = (0:0.01:2)*pi;
for j = 1:12
plot(5*cos(j*pi/6) + cos(T), 5*sin(j*pi/6) + sin(T));
296
Glossary
axis([-6 6 -6 6]);
M(j) = getframe;
end
movie(M)
ginput Gathers coordinates from a figure using the mouse (press the E
NTER or RETURN
key to finish).
[X, Y] = ginput
grid Puts a grid on a figure.
gtext Places a text label using the mouse.
gtext(’Region of instability’)
hist Draws a histogram.
hist(rand(200, 1))
hold Holds the current graph. Superimpose any new graphics generated by MATLAB on
top of the current figure.
hold on
hold off
image Displays a matrix as an image.
image(ones(50,100))
imagesc Like image, but scales the data if necessary.
imagesc(randn(50,100))
imread Reads in a graphics file and converts it to a matrix.
A = imread(’myimage.jpg’);
imwrite Converts a matrix into a graphics file.
imwrite(A, ’picture.jpg’)
legend Creates a legend for a figure.
t = 0:0.1:2*pi;
plot(t, cos(t), t, sin(t))
legend(’cos(t)’, ’sin(t)’)
loglog Creates a log-log plot.
x = 0.0001:0.1:12; loglog(x, x.ˆ5)
mesh Draws a mesh surface.
[X,Y] = meshgrid(-2:.1:2, -2:.1:2);
mesh(X, Y, sin(pi*X).*cos(pi*Y))
meshgrid Creates a vector array that can be used as input to a graphics command, for
example, contour, quiver,orsurf.
[X, Y] = meshgrid(0:0.1:1, 0:0.1:2)
contour(X, Y, X.ˆ2 + Y.ˆ2)
movie Plays back a movie. See the entry for getframe.
movieview Similar to movie, but has a playback button.
patch Creates a filled polygon or colored surface patch. See also fill.
t = (0:1:5)*2*pi/5; patch(cos(t), sin(t), ’r’); axis equal
pie Draws a pie plot of the data in a vector.
Z = [34 5 32 6]; pie(Z)
plot Plots vectors of data.
297
X = [0:0.1:2];
plot(X, X.ˆ3)
plot3 Plots curves in three-dimensional space.
t = [0:0.1:30];
plot3(t, t.*cos(t), t.*sin(t))
polar Polar-coordinate plot command.
theta = (0:0.01:2)*pi; rho = theta; polar(theta, rho)
print Sends the contents of the current figure window to the printer or to a file.
print -deps picture.eps
quiver Plots a (numerical) vector field in the plane.
[x, y] = meshgrid(-4:0.5:4, -4:0.5:4);
quiver(x, y, x.*(y - 2), y.*x); axis tight
semilogy Creates a semi-log plot, with the logarithmic scale along the vertical axis.
x = 0:0.1:12; semilogy(x, exp(x))
set Sets properties of a figure.
set(gcf, ’Color’, [0, 0.8, 0.8])
subplot Breaks the figure window into a grid of smaller plots.
subplot(2, 2, 1), ezplot(’xˆ2’)
subplot(2, 2, 2), ezplot(’xˆ3’)
subplot(2, 2, 3), ezplot(’xˆ4’)
subplot(2, 2, 4), ezplot(’xˆ5’)
surf Draws a solid surface.
[X,Y] = meshgrid(-2:.1:2, -2:.1:2);
surf(X, Y, sin(pi*X).*cos(pi*Y))
text Annotates a figure, by placing text at specified coordinates.
text(x, y, ’string’)
title Assigns a title to the current figure window.
title ’Nice Picture’
xlabel Assigns a label to the horizontal coordinate axis.
xlabel(’Year’)
ylabel Assigns a label to the vertical coordinate axis.
ylabel(’Population’)
view Specifies a point from which to view a 3D graph.
ezsurf(’(xˆ2 + yˆ2)*exp(-(xˆ2 + yˆ2))’); view([0 0 1])
syms x y; ezmesh(x*y); view([1 0 0])
zoom Rescales a figure by a specified factor; zoom by itself enables use of the mouse for
zooming in or out.
zoom
zoom(4)
MATLAB Programming
any True if any element of an array is non-zero.
if any(imag(x) ˜= 0); error(’Inputs must be real.’); end