Báo cáo y học: "Reduced proportions of natural killer T cells are present in the relatives of lupus patients and are associated with autoimmunity" ppt
Bạn đang xem bản rút gọn của tài liệu. Xem và tải ngay bản đầy đủ của tài liệu tại đây (542.39 KB, 13 trang )
Open Access
Available online />Page 1 of 13
(page number not for citation purposes)
Vol 10 No 5
Research article
Reduced proportions of natural killer T cells are present in the
relatives of lupus patients and are associated with autoimmunity
Joan Wither
1
, Yong-chun Cai
2
, Sooyeol Lim
3
, Tamara McKenzie
2
, Nicole Roslin
3
,
Jaime O Claudio
2
, Glinda S Cooper
4
, Thomas J Hudson
5
, Andrew D Paterson
3
,
Celia MT Greenwood
3
, Dafna Gladman
6
, Janet Pope
7
, Christian A Pineau
8
, C Douglas Smith
9
,
John G Hanly
10
, Christine Peschken
11
, Gilles Boire
12
, CaNIOS Investigators
13
and Paul R Fortin
6,14
1
Arthritis Centre of Excellence; Division of Genetics and Development, Toronto Western Hospital Research Institute, University Health Network;
Departments of Medicine and Immunology, University of Toronto, Bathurst Street, Toronto, Ontario, M5T 2S8, Canada
2
Toronto Western Hospital Research Institute, University Health Network, Bathurst Street, Toronto, Ontario, M5T 2S8, Canada
3
Program in Genetics and Genome Biology, The Hospital for Sick Children Research Institute, College Street, Toronto, Ontario, M5G 1L7, Canada
4
United States Environmental Protection Agency, Pennsylvania Avenue NW, Washington, District of Columbia 20460, USA
5
McGill University and Genome Quebec Innovation Centre, Penfield Avenue, Montreal, Quebec, H3A 1A4, Canada; and Ontario Institute for Cancer
Research, College Street, Toronto, Ontario, M5G 1L7, Canada
6
University of Toronto Lupus Clinic, Centre for Prognosis Studies in the Rheumatic Diseases, Toronto Western Hospital, University Health Network;
Department of Medicine, University of Toronto, Bathurst Street, Toronto, Ontario, M5T 2S8, Canada
7
Division of Rheumatology, St Joseph's Health Centre, Grosvenor Street, London, Ontario, N6A 4V2, Canada
8
Division of Rheumatology, McGill University Health Center, Cedar Avenue, Montreal, Quebec, H3G 1A4, Canada
9
Division of Rheumatology, Ottawa Hospital, Riverside Drive, Ottawa, Ontario, K1H 829, Canada
10
Division of Rheumatology, Department of Medicine, Queen Elizabeth II Health Sciences Centre and Dalhousie University, Summer Street, Halifax,
Nova Scotia, B3H 4K4, Canada
11
Division of Rheumatology, Department of Medicine, Faculty of Medicine, University of Manitoba, Sherbrook Street, Winnipeg, Manitoba, R3A 1M4,
Canada
12
Division of Rheumatology, Department of Medicine, Faculty of Medicine and Health Sciences, Université de Sherbrooke, 12th Avenue N,
Sherbrooke, Quebec, J1H 5N4, Canada
13
CaNIOS Investigators are listed in the Acknowledgments section
14
Arthritis Centre of Excellence; Division of Health Care and Outcomes Research, Toronto Western Hospital Research Institute, University Health
Network; Department of Medicine, University of Toronto, Bathurst Street, Toronto, Ontario, M5T 2S8, Canada
Corresponding author: Joan Wither,
Received: 10 Apr 2008 Revisions requested: 12 May 2008 Revisions received: 25 Jul 2008 Accepted: 10 Sep 2008 Published: 10 Sep 2008
Arthritis Research & Therapy 2008, 10:R108 (doi:10.1186/ar2505)
This article is online at: />© 2008 Wither et al.; licensee BioMed Central Ltd.
This is an open access article distributed under the terms of the Creative Commons Attribution License ( />),
which permits unrestricted use, distribution, and reproduction in any medium, provided the original work is properly cited.
Abstract
Introduction Systemic lupus erythematosus is a genetically
complex disease. Currently, the precise allelic polymorphisms
associated with this condition remain largely unidentified. In part
this reflects the fact that multiple genes, each having a relatively
minor effect, act in concert to produce disease. Given this
complexity, analysis of subclinical phenotypes may aid in the
identification of susceptibility alleles. Here, we used flow
cytometry to investigate whether some of the immune
abnormalities that are seen in the peripheral blood lymphocyte
population of lupus patients are seen in their first-degree
relatives.
Methods Peripheral blood mononuclear cells were isolated
from the subjects, stained with fluorochrome-conjugated
monoclonal antibodies to identify various cellular subsets, and
analyzed by flow cytometry.
Results We found reduced proportions of natural killer (NK)T
cells among 367 first-degree relatives of lupus patients as
compared with 102 control individuals. There were also slightly
increased proportions of memory B and T cells, suggesting
increased chronic low-grade activation of the immune system in
first-degree relatives. However, only the deficiency of NKT cells
was associated with a positive anti-nuclear antibody test and
clinical autoimmune disease in family members. There was a
significant association between mean parental, sibling, and
proband values for the proportion of NKT cells, suggesting that
this is a heritable trait.
ANA: anti-nuclear antibody; DM: diabetes mellitus; dsDNA: double-stranded DNA; NK: natural killer; mAb: monoclonal antibody; PBMC: peripheral
blood mononuclear cell; SLE: systemic lupus erythematosus; SLEDAI-2K: Systemic Lupus Erythematosus Disease Activity Index 2000; T
reg
: T-regu-
latory.
Arthritis Research & Therapy Vol 10 No 5 Wither et al.
Page 2 of 13
(page number not for citation purposes)
Conclusions The findings suggest that analysis of cellular
phenotypes may enhance the ability to detect subclinical lupus
and that genetically determined altered immunoregulation by
NKT cells predisposes first-degree relatives of lupus patients to
the development of autoimmunity.
Introduction
Systemic lupus erythematosus (SLE) has a complex genetic
basis, with genome-wide scans demonstrating significant or
suggestive linkage between SLE and multiple chromosomal
regions [1-3]. Despite the recent success of genome-wide
association studies, the precise informative allelic polymor-
phisms contained within many of these regions remain uniden-
tified [4,5]. This lack of knowledge reflects the facts that most
linkage and association studies have investigated the associa-
tion with the global phenotype of lupus, which is clinically het-
erogeneous, and that multiple genes act in concert to produce
lupus, each having a relatively minor effect. Given this com-
plexity, analysis of subclinical phenotypes may increase the
power to detect basic pathogenic mechanisms and to define
genetic susceptibility more precisely.
Murine models of lupus exhibit genetic complexity similar to
that in their human counterparts [6]. However, in murine lupus
study of allelic polymorphisms has been greatly aided by the
ability to create congenic mice in which a single susceptibility
allele, or small cluster of alleles, are back-crossed onto a nor-
mal genetic background. Notably, these congenic mice fre-
quently exhibit subclinical phenotypes that are characterized
by production of anti-nuclear antibodies (ANAs) and/or cellu-
lar changes indicative of increased B-cell or T-cell activation
[7-9]. These findings suggest that the relatives of lupus
patients, while lacking the full complement of genes required
for development of clinical SLE, may share sufficient lupus
susceptibility alleles to develop subclinical immunologic phe-
notypes. This concept is supported by the well documented
observation that first-degree relatives of lupus patients have an
increased prevalence of ANAs and other lupus-associated
autoantibodies as compared with the general population
[10,11], and these phenotypes have successfully been used
to map genetic loci that promote production of autoantibodies
in lupus patients and their family members [12,13].
Despite a relative abundance of data examining serologic phe-
notypes in the family members of lupus patients, relatively little
is known about the cellular phenotype of these individuals.
Lupus patients have a number of cellular phenotypic abnormal-
ities, including the following: increased numbers of autoanti-
body secreting B cells [14,15]; increased numbers of recently
activated T and B cells [16-21]; altered proportions of naïve
and memory T and B cell populations [17,21-23]; and defi-
ciencies of regulatory T-cell subsets such as natural killer
(NK)T [24,25] and T-regulatory (T
reg
) cells [26-28]. Here we
examined whether first-degree relatives of lupus patients share
some of these distinctive cellular abnormalities.
Materials and methods
Subjects and data collection
All patients fulfilled four or more of the revised 1997 American
College of Rheumatology criteria for the classification of SLE
and had two living parents who agreed to participate in the
study. In total 144 patients, 288 parents, and 79 siblings were
investigated. Population control individuals for the lupus
patients were obtained by random digit dialing, which permit-
ted general matching for geographic area. Additional control
individuals matching the age distribution of the parents of the
lupus patients were obtained through advertisements at the
University Health Network and local community centers. Con-
trol individuals with a family history of lupus were excluded
from the study. The study was approved by the Research Eth-
ics Board of the University Health Network and each partici-
pating recruitment center.
After providing an informed consent, all subjects had blood
drawn for isolation of DNA, cellular analysis and serologic test-
ing, and completed a case report questionnaire. This form
included basic information on demographics, family history,
lifestyle and medical history, including specific questions on
autoimmune diseases, medications, and comorbidities. In
addition, the physicians of patients and family members with
lupus completed a questionnaire, which enabled calculation of
the Systemic Lupus Erythematosus Disease Activity Index
2000 (SLEDAI-2K), a validated measure of lupus disease
activity and damage.
Cellular phenotyping
Heparinized whole peripheral blood was transported by cou-
rier overnight at room temperature, and the following day,
approximately 16 to 20 hours after blood drawing, peripheral
blood mononuclear cells (PBMCs) were isolated by Ficoll den-
sity gradient centrifugation. All samples were handled similarly
regardless of the city of origin, and there was no difference in
the time-to-analysis of samples from patients, family members,
or control individuals. Isolated PBMCs were stained with vari-
ous combinations of conjugated mAbs, to discriminate
between cellular populations and to identify activated cells.
Stained cells were fixed with 2% paraformaldehyde and ana-
lyzed by flow cytometry using a FACScalibur instrument (BD
Biosciences, Missisauga, ON, Canada). The following conju-
gated mAbs were obtained from BD Biosciences: allophyco-
cyanin-conjugated anti-CD3 (UHT1), anti-CD20 (2H7), anti-
CD4 (RPA-T4), and anti-CD8 (RPA-T8); PE-conjugated IgG
2b
(27–35), IgG
1
(MOPC-21), and anti-CD8 (RPA-T8), anti-
CD45RO (UCHL1), anti-CD38 (H1T2), anti-CD69 (FN50),
and anti-CD27 (M-T271); and FITC-conjugated IgG
1
(MOPC-
Available online />Page 3 of 13
(page number not for citation purposes)
21), IgG
2a
(G155-178), and anti-CD4 (RPA-T4), anti-
CD45RA (HI100), anti-CD27 (MT271), anti-CD80 (L307.4),
anti-CD86 (2331 [FUN-1]), and anti-CD25 (M-A251). mAbs
specific for Vα24 (C15) and Vβ11 (C21) were obtained from
Immunotec (Marseille, France).
For most cellular populations 20,000 events were analyzed;
however, 50,000 events were examined for enumeration of
activated B cells and 200,000 lymphoid events for quantita-
tion of NKT and T
reg
cells. The number of lymphocytes per mil-
liliter was calculated from the number of PBMCs obtained per
milliliter blood and the proportion of lymphocytes in the total
cellular population, as determined by flow cytometry, acquiring
all events.
For all stains, PBMCs were first gated on the lymphocyte pop-
ulation based on forward and side scatter characteristics. For
B-cell populations, CD20
+
cells were gated and the results
expressed as a proportion this population (Figure 1). For the
B-cell activation markers CD80, CD86 and CD69, relevant
populations were gated using dot plots and data from these
populations plotted as a histogram. The positively staining
cells were determined by comparison with an isotype control,
with background isotype control staining being subtracted.
The proportions of CD3
+
, CD3
+
CD4
+
, and CD3
+
CD8
+
cells
are expressed as a percentage of the total lymphoid popula-
tion. For all other T-cell phenotypes, cells have been gated on
the population indicated by the first stain (for example, CD3
+
,
CD4
+
, or CD8
+
) and results are expressed as a proportion of
this gated population (Figure 1). Background staining with a
relevant isotype control has been subtracted for the T-cell acti-
vation marker CD69. For the T
reg
cell population, the propor-
tion of CD4
+
cells that were CD25
bright
was determined using
a region that was set based on CD25 staining of the CD4
-
population, so that under 1% of the CD4
-
population stained
brightly, which permits identification of a population that is
enriched for regulatory function [28].
In preliminary experiments it was determined that the delay in
isolation of the PBMCs had no impact on cell number and via-
bility (>95%), activation status, or the relative proportions of
the majority of cellular populations within the lymphocyte gate
in lupus patients and control individuals. However, the propor-
tion of plasma cells within the PBMC population was signifi-
cantly reduced after overnight transport. Because the majority
of these cells are not contained within the lymphoid gate, the
loss of this cell population had minimal impact on the propor-
tions of the other cell populations examined.
Serologic testing
Serum samples were screened for ANA at a 1:40 dilution
using a kit with HEp-2 cell coated slides, as per the manufac-
turer's instructions (Antinuclear Antibody Test Kit with Stabi-
lized Substrate, Antibodies Incorporated).
Immunofluorescence was quantified using Image J1.37C soft-
ware on digital images obtained with a Zeiss Axioplan 2 imag-
ing microscope. Samples were graded based upon the
percent of positive control staining above negative control
staining, with a positive test being >25% above background.
Anti-double-stranded DNA (dsDNA) antibody levels were
determined by an in house ELISA, using calf thymus dsDNA as
a substrate.
Statistical analysis
All data were verified and double entered in an Access data-
base. Differences for various cellular phenotypes between
groups were estimated using the Wilcoxon test and using the
van Elteren test, which is a rank-based Wilcoxon nonparamet-
ric test that uses weighted stratification to control for the effect
of covariates [29]. Some cellular phenotypes exhibited strong
deviations from normal distributions, even after log transforma-
tion; hence, the use of a nonparametric test minimizes the
impact that outliers have on test statistics. Correlations
between cellular phenotypes and disease activity, prednisone
dose, and the levels of anti-dsDNA antibodies in the probands
were determined using Spearman's rank correlation coeffi-
cient. The effect of age (stratified into <40 years, 40 to 60
years, and >60 years) and sex on the cellular variables in con-
trol individuals were determined using the Kruskal-Wallis test
to assess independently the impacts of sex and age, and the
Friedman rank sum test to assess the impact of age after con-
trolling for sex and vice versa. Correlation of the NKT cell trait
between relatives was determined using Spearman's rank
correlation.
Results
Subject demographics
The clinical characteristics of the lupus patients are shown in
Table 1. Sixty-six per cent of the patients were taking hydroxy-
chloroquine and 40% were taking immunosuppressive drugs
(23.4% azathioprine, 11.3% mycophenolate mofetil, 8.3%
methotrexate, and 0.7% cyclophosphamide) at the time of the
study. The mean age of the patients was 34.7 ± 9.0 (median
35.0) years, fathers 63.6 ± 9.0 (median 63.7) years, mothers
61.0 ± 8.9 (median 60.9) years, siblings 35.4 ± 9.1 (median
35.2) years, and control individuals 45.8 ± 13.0 (median 47.3)
years. Eighty nine per-cent of the patients, 61% of siblings,
and 82% of control individuals were female. The majority of
patients were Caucasian (85.3%) with the remaining patients
being Asian (7.2%), black (2.2%), Middle Eastern (1.4%),
Aboriginal (0.7%), and Jewish (0.7%). Control individuals had
a similar distribution of ethnic backgrounds, which was not sig-
nificantly different from the probands or their parents.
Presence of multiple cellular abnormalities in lupus
patients
Preliminary to examination of the family members of lupus
patients for cellular phenotypic abnormalities, we first sought
to confirm that the cellular abnormalities reported in the litera-
ture were present in our lupus population. Analysis of our
Arthritis Research & Therapy Vol 10 No 5 Wither et al.
Page 4 of 13
(page number not for citation purposes)
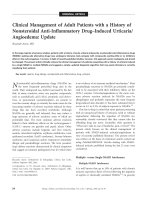
Figure 1
Flow cytometry profiles showing gates used to identify various lymphocyte populationsFlow cytometry profiles showing gates used to identify various lymphocyte populations. Peripheral blood mononuclear cells from representative con-
trol individuals and lupus patients were stained with combinations of conjugated mAbs, fixed, and analyzed by flow cytometry, gating on the lymphoid
population as determined by forward and side staining characteristics. (a) Cells were stained with a combination of anti-CD20, anti-CD38, and anti-
CD27 mAbs to distinguish peripheral blood B-cell subsets. Shown are dot plots, gated on CD20
+
cells, with four regions defined by the levels of
staining with anti-CD27 and anti-CD38, as determined by staining with a relevant isotype control. Using this combination of stains, B cells can be
divided into naïve transitional (CD27
-
CD38
++
) naïve mature (CD27
-
CD38
-/+
), memory (CD27
+
CD38
-/+
), and pre-germinal center (CD27
+
CD38
++
)
populations. (b) Cells were stained with anti-CD3 in combination with anti-Vα24 and anti-Vβ11 mAbs. Shown are dot plots gated on the CD3
+
pop-
ulation. The top right quadrant represents the Vα24
+
Vβ11
+
invariant NKT cell population that has been proposed to play a regulatory role in autoim-
munity. (c) Cells were stained with anti-CD4 or anti-CD8 (shown) in combination with anti-CD45RA and anti-CD45RO to identify naïve
(CD45RA
+
CD45RO
-
; bottom right) and memory (CD45RA
-
CD45RO
+
; top left) cell subsets. mAb, monoclonal antibody; NK, natural killer; SLE, sys-
temic lupus erythematosus.
Available online />Page 5 of 13
(page number not for citation purposes)
lupus probands revealed a number of cellular abnormalities in
comparison with control individuals (Table 2). Lupus patients
had significantly increased proportions of activated B cells, as
demonstrated by the increased percentage of CD20
+
cells
with elevated levels of CD69 and increased proportion of
CD86
+
cells in the CD27
+
B-cell compartment. They also had
increased CD4
+
T-cell activation, with an increased proportion
of recently activated CD69
+
CD4
+
T cells. Consistent with
reports in the literature, lupus patients had a relative decrease
in mature naïve cells and increase in transitional and pre-ger-
minal center cells in their B-cell compartment [21-23]. How-
ever, we did not find increased proportions of memory CD4
+
or CD8
+
T cells in our patients. Furthermore, contrary to previ-
ous reports demonstrating decreased proportions of
CD4
+
CD25
+
T
reg
cells in lupus, we did not observe any altera-
tions in this population. In contrast, lupus patients had mark-
edly decreased proportions of NKT cells, as identified by
analysis of CD3
+
Vα24
+
Vβ11
+
cells, which have been shown
to correlate strongly with the invariant CD1d-restricted NKT
cell population that is proposed to play an inhibitory role in
autoimmune disease [30-32].
With the exception of the number of lymphocytes per milliliter
(P = 0.0026), there was no significant correlation between the
SLEDAI-2K and any of the cellular abnormalities examined.
However, there was a significant correlation between pred-
nisone dose or use of cytotoxic medications and several of the
cellular phenotypes examined. An increased dose of pred-
nisone was negatively correlated with the number of lym-
phocytes per milliliter (P < 0.0001) and the proportion of total
B cells (P = 0.0007), transitional B cells (P = 0.0033) and
CD4
+
T cells (P = 0.0003), and positively correlated with the
proportion of CD8
+
T cells (P = 0.016), memory B cells (P =
0.034) and CD80
+
(P = 0.033) or CD86
+
(P = 0.0003) naïve
B cells. In association with use of any cytotoxic drug, similar
trends were observed for the proportion of total B cells (P <
0.0001), transitional B cells (P = 0.041), memory B cells (P =
0.0002), CD8
+
T cells (P = 0.0038), and CD80
+
(P = 0.0003)
or CD86
+
(P = 0.010) naïve B cells. In addition, use of cyto-
toxic drugs was associated with a reduced proportion of
mature naïve B cells (P = 0.0020) and increased proportion of
pre-germinal center cells (P = 0.021). In general, anti-malarial
drug use was not associated with differences in proportions of
the cellular populations. Notably, the majority of the cellular
phenotypes that exhibited strong statistical differences
between control individuals and probands did not vary with
drug therapy or varied in a way that could not account for the
differences observed.
Because our populations contained individuals of both sexes
and with a broad age range, we questioned whether any of the
cellular phenotypes varied with age or sex within our control
population. Using a multivariate analysis incorporating age and
sex, there was a significant correlation between increased age
and an increased proportion of memory (CD45RA
-
RO
+
; P =
0.042) CD4
+
cells and decreased proportions of CD3
+
T cells
(P = 0.002), CD8
+
T cells (P = 0.003), and naïve CD4
+
cells
(CD45RA
+
RO
-
; P = 0.0007). Males had significantly reduced
proportions of activated B cells (CD27
-
CD86
+
, P = 0.004;
CD27
+
CD80
+
, P = 0.019; and CD27
+
CD86
+
, P = 0.0002)
together with increased proportions of CD8
+
T cells (P =
0.041). We therefore extended our statistical evaluation to
control for these two covariates in all subsequent analyses
where comparisons were being made between family groups
and control individuals. As shown in Table 2, for all of the phe-
notypic differences that were significant at the P < 0.005 level
between lupus patients and control individuals using the Wil-
coxon test; strong statistical significance (P < 0.005) was
retained when the van Elteren test (see Materials and meth-
ods, above) was used to take these covariates into account.
Cellular abnormalities in the family members of lupus
patients
We next examined whether the family members of lupus
patients shared any of the cellular abnormalities that we had
observed in the lupus patients. As shown in Table 2, despite
previous reports in the literature indicating increased autoanti-
body production in the relatives of lupus patients [10,11], the
Table 1
Demographic characteristics of 144 lupus patients
Characteristic Value (mean ± SD) Median Range
ACR criteria 5.35 ± 1.29 5.00 4 to 9
Disease duration (years) 9.26 ± 6.72 7.68 0.1 to 30.3
Age at diagnosis (years) 25.44 ± 9.18 23.70 6.0 to 51.3
SLEDAI-2K score 5.61 ± 5.63 4.00 0 to 30
SLAM-2 score 5.54 ± 3.91 5.00 0 to 18
SLICC score 0.94 ± 1.20 1.00 0 to 6
Prednisone dose (mg/day) 6.50 ± 9.83 2.50 0 to 60
ACR, American College of Rheumatology; SD, standard deviation; SLAM-2, Systemic Lupus Activity Measure-2; SLEDAI-2K, Systemic Lupus
Erythematosus Disease Activity Index 2000; SLICC, Systemic Lupus International Collaborating Clinics damage.
Arthritis Research & Therapy Vol 10 No 5 Wither et al.
Page 6 of 13
(page number not for citation purposes)
proportions of activated B cells, as determined by expression
levels of CD69, CD80, and CD86, were not increased in the
family members of our lupus patients. Indeed, there was a
highly significant reduction in the proportion of CD86
+
naïve B
cells in the family members of lupus patients as compared with
control individuals. In addition, lupus family members had a
significantly decreased proportion of mature naïve B cells, with
a trend toward an increased proportion of memory B cells,
raising the possibility that there is a low-grade increase in B-
cell activation as compared with control individuals. As shown
in Figure 2, consistent trends toward decreased proportions
of mature naïve and CD86
+
naïve B cells were seen when the
first-degree relatives of lupus patients were segregated into
parents and siblings, but these were less pronounced in the
siblings.
Although the majority of T-cell subsets examined were not dif-
ferent between the family members of lupus patients and con-
trol individuals, a decrease in the proportion of NKT cells was
seen in the first-degree relatives of lupus patients compared
with control individuals. Although the reduced proportion of
NKT cells was not as pronounced as that seen in the probands
(P = 0.0009 for relatives as compared with probands), it
achieved statistical significance for both parent and sibling
subpopulations when compared with control individuals (Fig-
ure 2). An increased proportion of CD4
+
memory T cells was
also seen in the first-degree relatives as a whole, but this dif-
ference was not consistent when the parents and siblings
were analyzed separately. Notably, there was no correlation
between the proportion of NKT cells and the proportions of
CD86
+
naïve B cells, mature naïve B cells, or memory CD4
+
T
cells in the lupus family members.
Table 2
Cellular phenotypes of lupus probands, first-degree relatives and controls
Cell population gated Cell types Probands (n = 144) First-degree relatives (n =
357)
Controls (n = 102)
Lymphocytes (× 10
6
/ml) 0.63 ± 0.31*** (<0.0001) 0.83 ± 0.32 0.83 ± 0.37
CD20
+
B cells 14.54 ± 9.12 15.19 ± 7.10 (0.014) 13.84 ± 4.95
CD20
+
CD27
-
CD38
-/+
Naïve mature B cells 60.59 ± 16.54* 60.24 ± 15.06** (0.0051) 65.47 ± 11.65
CD20
+
CD27
-
CD38
++
Transitional B cells 14.63 ± 11.61* (0.009) 10.58 ± 8.04 10.11 ± 5.92
CD20
+
CD27
-
CD80
+
Activated naïve B cells 2.75 ± 4.72 1.50 ± 2.37 2.21 ± 5.51
CD20
+
CD27
-
CD86
+
Activated naïve B cells 6.93 ± 9.43 4.04 ± 5.64*** (0.0009) 6.44 ± 7.19
CD20
+
CD27
+
CD38
-/+
Memory B cells 23.40 ± 15.79 28.15 ± 15.67* 24.32 ± 11.50
CD20
+
CD27
+
CD38
++
Pre-germinal center B cells 2.77 ± 2.98*** (0.003) 1.49 ± 1.91 1.68 ± 3.06
CD20
+
CD27
+
CD80
+
Activated memory/pre-germinal
center B cells
18.91 ± 11.69* 16.59 ± 9.53 15.84 ± 8.36
CD20
+
CD27
+
CD86
+
Activated memory/pre-germinal
center B cells
12.12 ± 9.64*** (0.0039) 8.10 ± 6.52 9.00 ± 8.47
CD20
+
CD69
+
Recently activated B cells 20.40 ± 15.84*** (<0.0001) 13.05 ± 12.00 10.85 ± 8.93
CD3
+
T cells 63.44 ± 14.68 61.23 ± 12.68* 64.8 ± 9.70
CD3
+
CD4
+
CD4
+
T cells 34.50 ± 12.77*** (0.0001) 40.06 ± 11.91 40.77 ± 9.98
CD3
+
CD8
+
CD8
+
T cells 25.24 ± 11.01* 19.38 ± 9.30* 21.18 ± 7.46
CD3
+
Vα24
+
Vβ11
+
NKT cells 0.06 ± 0.13*** (<0.0001) 0.08 ± 0.20*** (0.013) 0.11 ± 0.17
CD4
+
CD25
+
T
reg
cells 6.62 ± 4.30 6.39 ± 3.41 6.46 ± 2.98
CD4
+
CD45RA
+
CD45RO
-
Naive CD4
+
cells 31.62 ± 14.41 25.06 ± 13.13** 29.05 ± 12.69
CD4
+
CD45RA
-
CD45RO
+
Memory CD4
+
cells 37.10 ± 14.04* 41.63 ± 15.16 (0.0433) 40.27 ± 11.95
CD4
+
CD69
+
Recently activated CD4
+
cells 10.55 ± 11.32*** (0.0001) 7.08 ± 8.56 5.95 ± 5.92
CD8
+
CD45RA
+
CD45RO
-
Naive CD8
+
cells 62.36 ± 16.37* 53.92 ± 15.15** 58.61 ± 13.53
CD8
+
CD45RA
-
CD45RO
+
Memory CD8
+
cells 15.75 ± 9.91*** (0.0027) 21.35 ± 11.09 20.29 ± 10.37
Cellular phenotypes were determined by flow cytometry following staining with relevant conjugated monoclonal antibodies, as described in the
Materials and methods section. Shown is the mean ± standard deviation for each group. Asterisks indicate significance as compared to controls
using the Wilcoxon Test: *P < 0.05, **P < 0.005, and ***P < 0.0005. Bold numbers denote significant differences (P < 0.05) from control
individuals using a Van Elteren test, where sex and age are covariates. The P values for significant differences are shown in parentheses. NK,
natural killer; T
reg
, T regulatory (cell).
Available online />Page 7 of 13
(page number not for citation purposes)
Figure 2
Scatter plots for cell populations that demonstrated significant differences between first-degree relatives and control individualsScatter plots for cell populations that demonstrated significant differences between first-degree relatives and control individuals. Peripheral blood
mononuclear cells were stained with various combinations of conjugated mAbs, fixed, and analyzed by flow cytometry (as outlined in the Materials
and methods section and shown in Figure 1). (a) Shown are plots for the proportion of activated naïve B cells (CD20
+
CD27
-
cells that were
CD86
+
), the proportion of B cells (CD20
+
) that had a mature naïve phenotype (CD27
-
CD38
-/+
), the proportion of NKT cells (CD3
+
cells that were
Vα24
+
Vβ11
+
), and the proportion of memory CD4
+
T cells (CD45RA
-
CD45RO
+
). Results shown are for 144 (143 for NKT cells) lupus probands,
356 family (parents and siblings) members (355 for NKT cells), 287 parents (286 for NKT cells), 69 siblings, and 102 control individuals. (b) The
proportion of NKT cells in controls, probands, and family members, stratified for the presence or absence of positive ANA status. Significant differ-
ences (*P < 0.05, **P < 0.005, and ***P < 0.0005) were determined using the Wilcoxon test. In panel a differences are as compared with control
individuals, and in panel b comparisons are between indicated populations. mAb, monoclonal antibody; NK, natural killer.
Arthritis Research & Therapy Vol 10 No 5 Wither et al.
Page 8 of 13
(page number not for citation purposes)
The reduced proportion of NKT cells in the family
members of lupus patients correlates with the presence
of a positive ANA
To determine whether the presence of positive ANA status
was correlated with any of the cellular phenotypes identified in
the relatives of our lupus patients, we measured IgG ANAs,
using HEp-2 cells as a substrate. The frequency of ANA posi-
tive status at the time of study in our lupus patients was
85.2%, as compared with a rate of 4% ANA positivity in the
control individuals (P < 0.001, Fisher's exact test). Consistent
with previous reports, the first-degree relatives of lupus
patients had a marked increase in the frequency of ANA posi-
tivity as compared with control individuals. Overall, 21.7% of
family members were ANA
+
(P < 0.001 versus control individ-
uals), with a frequency of 23.9% in the mothers (P < 0.001),
22.4% in the fathers (P < 0.001), and 16% in the siblings (P
= 0.008). Comparison of cellular phenotypes between ANA
+
and ANA
-
relatives using the van Elteren test, with age and sex
as covariates, revealed that only the proportion of NKT cells
was correlated with a positive ANA status (P = 0.009); in fam-
ily members the median proportion of NKT cells was signifi-
cantly lower in individuals with a positive ANA (mean ±
standard deviation = 0.032 ± 0.042, median = 0.014) as com-
pared with those who were ANA negative (mean ± standard
deviation = 0.086 ± 0.23, median = 0.029).
Because very few of the first-degree relatives had elevated lev-
els of anti-dsDNA antibodies, the association between the
presence of these autoantibodies and the proportion of NKT
cells was not examined. However, there was no correlation
between anti-dsDNA antibody levels and the proportion of
NKT cells in the probands.
Association between autoimmune disease in the family
members of lupus patients and a reduced proportion of
NKT cells
A reduced proportion of NKT cells has been reported in multi-
ple autoimmune diseases and has been noted in family mem-
bers of patients with type 1 diabetes mellitus (DM) [33]. We
therefore addressed whether the family members of our lupus
patients had an increased frequency of autoimmune disease
and investigated whether this was associated with a reduced
proportion of NKT cells. As shown in Table 3, the frequency of
any autoimmune disease in our control individuals was approx-
imately 5%, which is consistent with previous population sur-
veys [34]. The percentage of lupus patients' family members
reporting any autoimmune disease was 28.3%, which was sig-
nificantly increased as compared with population control indi-
viduals, with the most commonly reported autoimmune
diseases being rheumatoid arthritis (11.4%), closely followed
by hypothyroidism (11.2%). Although 31 relatives self-
reported DM, only one mother self-reported a clinical picture
consistent with type 1 DM, but this diagnosis could not be
confirmed.
Every effort was made to confirm the presence of self-reported
autoimmune disease, but only about 25% of autoimmune dis-
ease diagnoses could be confirmed at the time of analysis
because of limitations on access to medical records. Of the
109 lupus relatives with at least one self-reported autoimmune
disease, additional clinical information was available for 47,
and 25 of these were confirmed positive. Because of the vari-
ability in confirmation of reported autoimmunity, cellular pheno-
types were examined for both self-reported and confirmed
autoimmune disease. For self-reported autoimmune disease,
Table 3
Prevalence of self-reported autoimmune disease in the family members of lupus patients
Autoimmune disease Father (n = 144; n [%]) Mother (n = 144; n [%]) Sibling (n = 79; n [%]) Controls (n = 102; n [%])
Autoimmune disease: any 31 (21.53) 60 (41.67) 13 (16.67) 5 (4.90)
SLE 2 (1.40) 3 (2.08) 3 (3.85) 0
Rheumatoid arthritis 14 (9.72) 26 (18.06) 2 (2.56) 2 (1.96)
Scleroderma 1 (0.69) 1 (0.70) 0 0
Dermatomyositis/polymyositis 0 2 (1.39) 0 0
Sjögrens syndrome 1 (0.69) 3 (2.08) 0 0
Antiphospholipid syndrome 0 2 (1.39) 1 (1.28) 0
Hemolytic anemia 6 (4.17) 3 (2.08) 1 (1.28) 0
Multiple sclerosis 1 (0.69) 2 (1.39) 1 (1.28) 0
Vitiligo 2 (1.39) 3 (2.08) 1 (1.28) 0
Hyperthyroid 4 (2.78) 7 (4.90) 4 (5.13) 1 (0.99)
Hypothyroid 5 (3.47) 30 (20.83) 6 (7.69) 4 (3.92)
SLE, systemic lupus erythematosus.
Available online />Page 9 of 13
(page number not for citation purposes)
the presence of any autoimmune disease was associated with
a significantly reduced number of lymphocytes per milliliter,
reduced proportion of NKT cells, and increased proportion of
CD69
+
B cells in comparison with control individuals (P =
0.022, 0.0001 and 0.041, respectively, Wilcoxon test). When
these data were adjusted for age and sex, using the van
Elteren test, the differences in the number of lymphocytes per
milliliter and proportion of NKT cells remained significant (P =
0.039 and 0.0006, respectively).
To examine the association with confirmed autoimmune dis-
ease, first-degree relatives with self-reported autoimmune dis-
ease for whom additional clinical information could not be
obtained were removed from the analysis, and those who did
not report an autoimmune disease or whose self-reported
autoimmune disease was confirmed to be absent by medical
records were considered to lack autoimmune disease. Only
the reduced proportion of NKT cells was significantly associ-
ated with confirmed autoimmune disease (P = 0.006, using
the Wilcoxon test), and this remained significant after adjust-
ment for age and sex (P = 0.011, using the van Elteren test).
The reduced proportion of NKT cells in the first-degree
relatives of lupus patients is independently associated
with a positive ANA and autoimmune disease
The presence of a positive ANA status in the family members
of lupus patients was significantly correlated with both self-
reported and confirmed autoimmune disease (P = 0.002 and
< 0.001, respectively, by Fisher's exact test). We therefore
examined whether autoimmune disease and positive ANA sta-
tus were independently associated with a reduced proportion
of NKT cells. To address this possibility, the van Elteren test
was used to control for the presence or absence of positive
ANA status in the autoimmune disease analysis and vice
versa. For both self-reported and confirmed autoimmune dis-
ease, there was a significant reduction in NKT cells when the
data were controlled for ANA status (P = 0.0004 and 0.0032,
respectively). Similarly, positive ANA status wasindependently
associated with a reduced proportion of NKT cells, when the
presence or absence of self-reported or confirmed autoim-
mune disease was taken into account (self-reported, P =
0.0077; confirmed, P = 0.0032). As illustrated in Table 4, pos-
itive ANA status and autoimmune disease were independently
and cumulatively associated with a reduced proportion of NKT
cells. Nevertheless, the proportion of NKT cells was reduced
as compared with normal control individuals, even in first-
degree relatives who were ANA negative and did not have a
self-reported or confirmed autoimmune disease (P = 0.015
and 0.009 for self-reported and confirmed autoimmune dis-
ease, respectively, using the Wilcoxon test).
The proportion of NKT cells is a heritable trait
To determine whether the proportion of NKT cells is geneti-
cally determined, we examined the correlation between the
proportions of NKT cells between individuals within the same
family. There was a significant correlation between the mid-
parental value for the proportion of NKT cells and their
proband's value (r = 0.223, P = 0.0079) as well as between
the mid-parental value and their unaffected offspring's value (r
= 0.416, P = 0.00093). A similar association was found
between probands and their siblings (r = 0.280, P = 0.030).
Discussion
In this study, most of the distinctive cellular abnormalities in
lupus patients were not observed in their family members. Nev-
ertheless, the first-degree relatives of lupus patients had
reduced proportions of NKT cells and a relative shift toward
increased proportions of memory and reduced proportions of
naïve B and CD4
+
T cells, as compared with population con-
trol individuals.
Although our study is not the first to examine cellular pheno-
types in first-degree relatives of lupus patients, it is the first to
perform such a comprehensive examination of the multiple dif-
ferent cellular phenotypic abnormalities in SLE. Previous stud-
ies seeking cellular abnormalities in the family members of
lupus patients focused on a limited number of phenotypes,
including examination of antibody-secreting cells, NK cells,
and CD56
+
T cells, and had significantly smaller sample sizes.
Clark and coworkers [35] examined antibody-secreting cells in
25 first-degree relatives of lupus patients and found similar lev-
els to those in control individuals. Similarly, there were no sig-
nificant differences in the proportion or killing activity of NK
cells between first-degree relatives of lupus patients and con-
trol individuals [36]. The proportion of CD56
+
T cells was also
comparable in 45 first-degree relatives and control individuals
Table 4
Proportion of NKT cells in first-degree relatives of lupus patients, stratified by the presence of autoimmune disease and ANAs
Self-reported autoimmune disease Confirmed autoimmune disease
No Yes No Yes
ANA status Negative 0.089 ± 0.237 (0.030) 0.079 ± 0.198 (0.017) 0.092 ± 0.234 (0.035) 0.039 ± 0.054 (0.016)
Positive 0.040 ± 0.048 (0.022) 0.020 ± 0.029 (0.009) 0.036 ± 0.046 (0.019) 0.016 ± 0.029 (0.008)
Shown is the proportion of natural killer (NK)T cells mean ± standard deviation (median) for each group. ANA, anti-nuclear antibody.
Arthritis Research & Therapy Vol 10 No 5 Wither et al.
Page 10 of 13
(page number not for citation purposes)
[37]. Although the authors argued that this indicates that NKT
cells are not reduced in the relatives of lupus patients, studies
indicate that CD56 is a poor marker for the immunoregulatory
invariant NKT cell population because it is also expressed on
some other peripheral blood T cells [30], whereas the
Vα24
+
Vβ11
+
CD3
+
cells examined in the present study corre-
late strongly with this population [30-32]. Indeed, a recent
study [38] found no significant difference between the propor-
tion of cells detected by anti-Vα24 and anti-Vβ11 staining, and
those observed after staining with CD1d tetramers loaded
with the α-galactosylceramide analog PBS57 or 6B11 (a mAb
that recognizes the conserved region of the canonical
Vα24Jα18 T cell receptor in invariant NKT cells).
Although a large number of cellular variables were assessed in
this study, several findings suggest that the statistically signif-
icant differences observed between the first-degree relatives
and control individuals did not occur by chance alone. In a
study of 49 additional trios recruited after this study, the pro-
portion of NKT cells in the first-degree relatives was similarly
and significantly reduced as compared with control individuals
(% NKT = 0.074 ± 0.12; P = 0.016 versus control individuals).
Furthermore, the observation that the reduced proportion of
NKT cells in first-degree relatives is independently and addi-
tively associated with positive ANA status and autoimmune
disease strongly suggests that this reduction is of immun-
opathogenic and not just statistical relevance. Despite less
striking differences in the proportions of memory and/or naïve
B and CD4
+
T cells, these changes may also be of pathogenic
importance. We recently showed that a nonsynonymous sin-
gle nucleotide polymorphism in the SLAM molecule Ly9 is
linked to development of lupus in our collection of trios [39].
We further demonstrated that this polymorphism, which is pre-
dicted to alter downstream signaling events, is associated with
skewing of T-cell populations away from a naïve and toward a
memory phenotype in the parents of our lupus patients.
NKT cells are a unique T-cell lineage that recognize glycolipid
antigens within the context of CD1d, a nonclassical major his-
tocompatibility complex (MHC) class I molecule. Upon activa-
tion, these cells are potent producers of immunoregulatory
cytokines [31,32]. Reduced proportions of these cells have
been described in a number of human autoimmune conditions,
including SLE [24,25,40], scleroderma [24,40,41], Sjögren's
syndrome [24,40], rheumatoid arthritis [24,40,42], multiple
sclerosis [24,40,43], and type 1 DM [33,44]. In several animal
models of autoimmune disease, including the nonobese dia-
betic model of type 1 DM [45-48], experimental autoimmune
encephalomyelitis[49,50], and collagen-induced arthritis [51],
deficiencies in NKT cells exacerbate disease whereas expan-
sion and/or activation of NKT cells ameliorate disease. Results
in murine models of lupus have been more conflicting, with
both reduced and increased proportions of NKT cells pro-
posed to exacerbate disease [52-56]. These disparities
appear to arise, at least in part, from variations in the cytokines
that are secreted by the NKT cells in the different lupus mouse
models, with interleukin-4-secreting NKT cells inhibiting lupus
and interferon-γ-secreting NKT cells exacerbating lupus
[53,54,56,57]. Similar findings have been observed in other
autoimmune mouse models [45,46,49,51,58-60], suggesting
that the immune mechanisms through which NKT cells act to
suppress lupus and other autoimmune diseases are similar.
This concept is further strengthened by our demonstration in
this study that there is an association between reduced pro-
portions of NKT cells and diverse autoimmune diseases in
first-degree relatives of lupus patients.
Although deficiencies in NKT cells have been shown to be
genetically linked or to precede the development of
autoimmunity in murine models of autoimmune disease, data
addressing these issues in humans are sparse. In type 1 DM,
reduced proportions of NKT cells were observed in high-risk
relatives with anti-pancreatic autoantibodies, suggesting that
NKT cell deficiencies in this disease predate the development
of clinical diabetes [33]. Only a single study [25] has investi-
gated the association between the proportion of NKT cells and
disease activity. In this study, a subset of NKT cells, the CD4
-
CD8
-
Vα24JαQ expressing population, was examined, and the
proportion of these cells was decreased only in active disease.
In our study, we found no correlation between the proportion
of total NKT cells and disease activity or drug therapy in our
lupus patients, which suggests that the reduction in NKT cells
in these patients does not arise as a secondary phenomenon
in response to active disease or its treatment. Although first-
degree relatives with positive ANA status and autoimmune dis-
ease had the lowest levels of NKT cells, significantly reduced
proportions of NKT cells were still observed in family members
without any clinical evidence of autoimmune disease or posi-
tive ANA status. This observation, together with the observa-
tion that the levels of NKT cells are significantly correlated
between genetically related individuals within the same family,
suggests that the reduced proportion of NKT cells is a herita-
ble trait. These findings raise the possibility that one of the
explanations for the clustering of multiple autoimmune disor-
ders within the families of lupus patients is the presence of
genetic polymorphisms that dictate NKT cell numbers and
function, and that these changes precede the development of
disease.
Aside from the changes in NKT cell numbers and the propor-
tions of memory and/or naïve B and CD4
+
T cells, first-degree
relatives did not generally share the same immune abnormali-
ties as the lupus probands. In particular, the marked B-cell
activation phenotype that is characteristic of lupus was
absent. We previously showed that the increased B-cell acti-
vation demonstrates only a weak correlation with disease
activity and is present both in newly diagnosed, untreated
lupus and clinically inactivate lupus (SLEDAI-2K = 0) [21]. The
findings in this report confirm these observations and demon-
strate that development of positive ANA status in the relatives
Available online />Page 11 of 13
(page number not for citation purposes)
of lupus patients need not be associated with any markers of
increased B-cell activation, suggesting that this marked B-cell
activation phenotype develops after the immunologic events
that lead to overt lupus. Although the levels of costimulatory
molecules on B cells in the relatives of lupus patients were
somewhat reduced in this study as compared with control indi-
viduals, and this achieved strong statistical significance in the
case of CD86 expression in the CD27
-
naïve B-cell population,
we were unable to replicate these findings in a subsequent
study of 49 trios. This observation suggests that these differ-
ences are not biologically relevant and may have resulted from
undefined covariants in our populations and/or experimental
methods.
Conclusion
The abnormal B-cell and T-cell activation phenotype that is
observed in lupus patients is not seen in their family members,
suggesting that these abnormalities develop after the immuno-
logic events that lead to overt lupus. However, significant
genetically determined reductions in the numbers of NKT cells
were observed in the first-degree relatives of lupus patients
that correlate with serological and clinical autoimmunity, sug-
gesting that altered immunoregulation by NKT cells may pre-
dispose these individuals to autoimmunity. Subtle changes
were also observed in the relative proportions of naïve and/or
memory B-cell and T-cell populations, and in a recent study
these T cells changes were associated with a single nucle-
otide polymorphism in Ly9, which was linked to lupus [39].
Thus, the analysis of cellular phenotypes in the relatives of
lupus patients may reveal extremely useful subclinical pheno-
types to increase the power of genetic linkage studies, not
only for lupus but also for other autoimmune diseases, as well
as providing important clues to the genesis of these
conditions.
Competing interests
The authors declare that they have no competing interests.
Authors' contributions
JW participated in study design; coordinated the flow cytom-
etry, serologic studies, and data acquisition; participated in the
data analysis; and drafted the manuscript. YC performed the
flow cytometry, serologic studies, and data acquisition. SL,
NR, CMTG, and ADP performed the statistical analyses. TM
and JOC coordinated the acquisition of laboratory samples,
clinical data acquisition, and entry of clinical and laboratory
variables into the database. TJH, CMTG, and GSC partici-
pated in study design. DG, JP, CAP, CDS, JGH, CP, and GB
participated in recruitment of patients and their family mem-
bers, and acquisition of clinical data and laboratory samples.
PRF participated in study design, and coordinated acquisition
of clinical data and laboratory samples, as well as entry of clin-
ical and laboratory variables into the database. All authors par-
ticipated in revision of manuscript drafts and read and
approved the final manuscript.
Acknowledgements
This study was performed with funding from an operating grant
(#62840) from the Canadian Institutes of Health Research (CIHR). Dr
Wither is funded by The Arthritis Centre of Excellence of the University
of Toronto and is the recipient of The Arthritis Society/CIHR Investigator
Award. Dr Fortin is funded by an Investigator Award from The Arthritis
Society/CIHR Institute of Musculoskeletal Health and Arthritis and by
The Arthritis Centre of Excellence of the University of Toronto. Dr Hud-
son is the recipient of a Clinical-Scientist Award in Translational
Research from the Burroughs Wellcome Fund.
CaNIOS Investigators are as follows: Murray Urowitz (University of
Toronto Lupus Clinic, Centre for Prognosis Studies in the Rheumatic
Diseases, Toronto Western Hospital, University Health Network); Sasha
Bernatsky and Ann Clarke (Division of Clinical Epidemiology, Montreal
General Hospital, and McGill University, Montreal, Quebec, Canada);
Eric Rich (Division of Rheumatology, Hôpital Notre-Dame, Montreal,
Quebec, Canada); Carol Hitchon (Winnipeg Health Science Center,
Winnipeg, MB, Canada Winnipeg); Simon Carette, Robert Inman, and
Lori Albert (Division of Rheumatology, Toronto Western Hospital); and
Susan Barr (Calgary Health Sciences Centre, University of Calgary, Cal-
gary, AB, Canada).
We thank the patients and their families as well as the following research
associates, who were involved in recruitment of the patients: Diona
Dobaille, Menisha Hodge, Tammy Koonthanan, Kiran Pabla, and Yang
Zhou (Division of Rheumatology, Toronto Western Hospital); Sara
Hewitt and Janine Ouimet (Division of Rheumatology, St Joseph's
Health Centre, London, Ontario, Canada); Nancy Branco and Elizabeth
Piniero (Division of Clinical Epidemiology, Montreal General Hospital,
and McGill University, Montreal, Quebec, Canada); Kathryn Drouin (Divi-
sion of Rheumatology, Ottawa Hospital, Ottawa, Ontario, Canada); Tina
Linehan (Division of Rheumatology, Department of Medicine, Queen
Elizabeth II Health Sciences Centre and Dalhousie University, Halifax,
NS, Canada); Diane Therrien (Division of Rheumatology, Hôpital Notre-
Dame, Montreal, Quebec, Canada); Andrea Craig, Diane Ferland, and
Donna Hart (Winnipeg Health Science Center, Winnipeg, MB, Canada
Winnipeg); Celine Boulet and Isabelle Gagnon (Department of Medi-
cine, Division of Rheumatology, University of Sherbrooke, Sherbrooke,
Quebec, Canada); Whitney Steber and Patrice Nedinis (Calgary Health
Sciences Centre, University of Calgary, Calgary, Alberta, Canada).
References
1. Vyse TJ, Kotzin BL: Genetic susceptibility to systemic lupus
erythematosus. Annu Rev Immunol 1998, 16:261-292.
2. Wakeland EK, Liu K, Graham RR, Behrens TW: Delineating the
genetic basis of systemic lupus erythematosus. Immunity
2001, 15:397-408.
3. Sestak AL, Nath SK, Harley JB: Genetics of systemic lupus ery-
thematosus: how far have we come? Rheum Dis Clin North Am
2005, 31:223-244.
4. Harley JB, arcon-Riquelme ME, Criswell LA, Jacob CO, Kimberly
RP, Moser KL, Tsao BP, Vyse TJ, Langefeld CD: Genome-wide
association scan in women with systemic lupus erythemato-
sus identifies susceptibility variants in ITGAM, PXK, KIAA1542
and other loci. Nat Genet 2008, 40:204-210.
5. Hom G, Graham RR, Modrek B, Taylor KE, Ortmann W, Garnier S,
Lee AT, Chung SA, Ferreira RC, Pant PV, Ballinger DG, Kosoy R,
Demirci FY, Kamboh MI, Kao AH, Tian C, Gunnarsson I, Bengtsson
AA, Rantapaa-Dahlqvist S, Petri M, Manzi S, Seldin MF, Ronnblom
L, Syvanen AC, Criswell LA, Gregersen PK, Behrens TW: Associ-
ation of systemic lupus erythematosus with C8orf13-BLK and
ITGAM-ITGAX. N Engl J Med 2008, 358:900-909.
6. Fairhurst AM, Wandstrat AE, Wakeland EK: Systemic lupus ery-
thematosus: multiple immunological phenotypes in a complex
genetic disease. Adv Immunol 2006, 92:1-69.
Arthritis Research & Therapy Vol 10 No 5 Wither et al.
Page 12 of 13
(page number not for citation purposes)
7. Henry T, Mohan C: Systemic lupus erythematosus: recent
clues from congenic strains. Arch Immunol Ther Exp (Warsz)
2005, 53:207-212.
8. Wither JE, Lajoie G, Heinrichs S, Cai YC, Chang N, Ciofani A, Che-
ung YH, MacLeod R: Functional dissection of lupus susceptibil-
ity loci on the New Zealand black mouse chromosome 1:
evidence for independent genetic loci affecting T and B cell
activation. J Immunol 2003, 171:1697-1706.
9. Wither JE, Loh C, Lajoie G, Heinrichs S, Cai YC, Bonventi G,
MacLeod R: Colocalization of expansion of the splenic mar-
ginal zone population with abnormal B cell activation and
autoantibody production in B6 mice with an introgressed New
Zealand Black chromosome 13 interval. J Immunol 2005,
175:4309-4319.
10. Laustrup H, Heegaard NH, Voss A, Green A, Lillevang ST, Junker
P: Autoantibodies and self-reported health complaints in rela-
tives of systemic lupus erythematosus patients: a community
based approach. Lupus 2004, 13:792-799.
11. Miles S, Isenberg D: A review of serological abnormalities in
relatives of SLE patients. Lupus 1993, 2:145-150.
12. Namjou B, Nath SK, Kilpatrick J, Kelly JA, Reid J, Reichlin M, James
JA, Harley JB: Genome scan stratified by the presence of anti-
double-stranded DNA (dsDNA) autoantibody in pedigrees
multiplex for systemic lupus erythematosus (SLE) establishes
linkages at 19p13.2 (SLED1) and 18q21.1 (SLED2). Genes
Immun 2002, 3(suppl 1):S35-S41.
13. Ramos PS, Kelly JA, Gray-McGuire C, Bruner GR, Leiran AN,
Meyer CM, Namjou B, Espe KJ, Ortmann WA, Reichlin M,
Langefeld CD, James JA, Gaffney PM, Behrens TW, Harley JB,
Moser KL: Familial aggregation and linkage analysis of autoan-
tibody traits in pedigrees multiplex for systemic lupus
erythematosus. Genes Immun 2006, 7:417-432.
14. Bourne T, Zukowska-Cooper M, Salaman MR, Seifert MH, Isen-
berg DA: Spontaneous immunoglobulin-producing capacity of
cultures from lupus patients and normal donors following
depletion of cells expressing CD19 or CD38. Clin Exp Immunol
1998, 111:611-616.
15. Sakane T, Suzuki N, Takada S, Ueda Y, Murakawa Y, Tsuchida T,
Yamauchi Y, Kishimoto T: B cell hyperactivity and its relation to
distinct clinical features and the degree of disease activity in
patients with systemic lupus erythematosus. Arthritis Rheum
1988, 31:80-87.
16. Folzenlogen D, Hofer MF, Leung DY, Freed JH, Newell MK: Anal-
ysis of CD80 and CD86 expression on peripheral blood B lym-
phocytes reveals increased expression of CD86 in lupus
patients. Clin Immunol Immunopathol
1997, 83:199-204.
17. Spronk PE, Horst G, Gun BT Van Der, Limburg PC, Kallenberg
CG: Anti-dsDNA production coincides with concurrent B and T
cell activation during development of active disease in sys-
temic lupus erythematosus (SLE). Clin Exp Immunol 1996,
104:446-453.
18. Viallard JF, Bloch-Michel C, Neau-Cransac M, Taupin JL, Garrigue
S, Miossec V, Mercie P, Pellegrin JL, Moreau JF: HLA-DR expres-
sion on lymphocyte subsets as a marker of disease activity in
patients with systemic lupus erythematosus. Clin Exp
Immunol 2001, 125:485-491.
19. Bijl M, Horst G, Limburg PC, Kallenberg CG: Expression of cos-
timulatory molecules on peripheral blood lymphocytes of
patients with systemic lupus erythematosus. Ann Rheum Dis
2001, 60:523-526.
20. Su CC, Shau WY, Wang CR, Chuang CY, Chen CY: CD69 to
CD3 ratio of peripheral blood mononuclear cells as a marker
to monitor systemic lupus erythematosus disease activity.
Lupus 1997, 6:449-454.
21. Chang NH, McKenzie T, Bonventi G, Landolt-Marticorena C, Fortin
PR, Gladman D, Urowitz M, Wither JE: Expanded population of
activated antigen-engaged cells within the naive B cell com-
partment of patients with systemic lupus erythematosus. J
Immunol 2008, 180:1276-1284.
22. Anolik JH, Barnard J, Cappione A, Pugh-Bernard AE, Felgar RE,
Looney RJ, Sanz I: Rituximab improves peripheral B cell abnor-
malities in human systemic lupus erythematosus. Arthritis
Rheum 2004, 50:3580-3590.
23. Arce E, Jackson DG, Gill MA, Bennett LB, Banchereau J, Pascual
V: Increased frequency of pre-germinal center B cells and
plasma cell precursors in the blood of children with systemic
lupus erythematosus. J Immunol 2001, 167:2361-2369.
24. Kojo S, Adachi Y, Keino H, Taniguchi M, Sumida T: Dysfunction
of T cell receptor AV24AJ18
+
, BV11
+
double-negative regula-
tory natural killer T cells in autoimmune diseases. Arthritis
Rheum 2001, 44:1127-1138.
25. Oishi Y, Sumida T, Sakamoto A, Kita Y, Kurasawa K, Nawata Y,
Takabayashi K, Takahashi H, Yoshida S, Taniguchi M, Saito Y,
Iwamoto I: Selective reduction and recovery of invariant
Valpha24JalphaQ T cell receptor T cells in correlation with dis-
ease activity in patients with systemic lupus erythematosus. J
Rheumatol 2001, 28:275-283.
26. Kang HK, Datta SK: Regulatory T cells in lupus. Int Rev Immunol
2006, 25:5-25.
27. Mellor-Pita S, Citores MJ, Castejon R, Tutor-Ureta P, Yebra-Bango
M, Andreu JL, Vargas JA: Decrease of regulatory T cells in
patients with systemic lupus erythematosus. Ann Rheum Dis
2006, 65:553-554.
28. Miyara M, Amoura Z, Parizot C, Badoual C, Dorgham K, Trad S,
Nochy D, Debre P, Piette JC, Gorochov G: Global natural regu-
latory T cell depletion in active systemic lupus erythematosus.
J Immunol 2005, 175:8392-8400.
29. van Elteren PH: On the combination of independent two-sam-
ple tests of Wilcoxon. Bull Int Stat Inst 1960, 37:351-361.
30. Hammond KJ, Godfrey DI: NKT cells: potential targets for
autoimmune disease therapy? Tissue Antigens 2002,
59:353-363.
31. Linsen L, Somers V, Stinissen P: Immunoregulation of autoim-
munity by natural killer T cells. Hum Immunol 2005,
66:1193-1202.
32. Yu KO, Porcelli SA: The diverse functions of CD1d-restricted
NKT cells and their potential for immunotherapy. Immunol Lett
2005, 100:42-55.
33. Kukreja A, Cost G, Marker J, Zhang C, Sun Z, Lin-Su K, Ten S,
Sanz M, Exley M, Wilson B, Porcelli S, Maclaren N: Multiple
immuno-regulatory defects in type-1 diabetes. J Clin Invest
2002, 109:131-140.
34. Jacobson DL, Gange SJ, Rose NR, Graham NM: Epidemiology
and estimated population burden of selected autoimmune
diseases in the United States. Clin Immunol Immunopathol
1997, 84:223-243.
35. Clark J, Bourne T, Salaman MR, Seifert MH, Isenberg DA: B lym-
phocyte hyperactivity in families of patients with systemic
lupus erythematosus. J Autoimmun 1996, 9:59-65.
36. Green MR, Kennell AS, Larche MJ, Seifert MH, Isenberg DA, Sala-
man MR: Natural killer cell activity in families of patients with
systemic lupus erythematosus: demonstration of a killing
defect in patients. Clin Exp Immunol 2005, 141:165-173.
37. Green MR, Kennell AS, Larche MJ, Seifert MH, Isenberg DA, Sala-
man MR: Natural killer T cells in families of patients with sys-
temic lupus erythematosus: Their possible role in regulation
of IGG production. Arthritis Rheum 2007, 56:303-310.
38. Montoya CJ, Pollard D, Martinson J, Kumari K, Wasserfall C,
Mulder CB, Rugeles MT, Atkinson MA, Landay AL, Wilson SB:
Characterization of human invariant natural killer T subsets in
health and disease using a novel invariant natural killer T cell-
clonotypic monoclonal antibody, 6B11. Immunology 2007,
122:1-14.
39. Graham DS, Vyse TJ, Fortin PR, Montpetit A, Cai YC, Lim S,
McKenzie T, Farwell L, Rhodes B, Chad L, Hudson TJ, Sharpe A,
Terhorst C, Greenwood CM, Wither J, Rioux JD: Association of
LY9 in UK and Canadian SLE families. Genes Immun 2008,
9:93-102.
40. van d V, von Blomberg BM, Nishi N, Reijm M, Voskuyl AE, van Bod-
egraven AA, Polman CH, Rustemeyer T, Lips P, Eertwegh AJ van
den, Giaccone G, Scheper RJ, Pinedo HM: Circulating
V(alpha24
+
) Vbeta11
+
NKT cell numbers are decreased in a
wide variety of diseases that are characterized by autoreactive
tissue damage. Clin Immunol 2001, 100:144-148.
41. Sumida T, Sakamoto A, Murata H, Makino Y, Takahashi H, Yoshida
S, Nishioka K, Iwamoto I, Taniguchi M: Selective reduction of T
cells bearing invariant V alpha 24J alpha Q antigen receptor in
patients with systemic sclerosis. J Exp Med 1995,
182:1163-1168.
42. Yanagihara Y, Shiozawa K, Takai M, Kyogoku M, Shiozawa S: Nat-
ural killer (NK) T cells are significantly decreased in the
peripheral blood of patients with rheumatoid arthritis (RA).
Clin Exp Immunol 1999, 118:131-136.
Available online />Page 13 of 13
(page number not for citation purposes)
43. Araki M, Kondo T, Gumperz JE, Brenner MB, Miyake S, Yamamura
T: Th2 bias of CD4
+
NKT cells derived from multiple sclerosis
in remission. Int Immunol 2003, 15:279-288.
44. Wilson SB, Kent SC, Patton KT, Orban T, Jackson RA, Exley M,
Porcelli S, Schatz DA, Atkinson MA, Balk SP, Strominger JL, Hafler
DA: Extreme Th1 bias of invariant Valpha24JalphaQ T cells in
type 1 diabetes. Nature 1998, 391:177-181.
45. Hammond KJ, Poulton LD, Palmisano LJ, Silveira PA, Godfrey DI,
Baxter AG: alpha/beta-T cell receptor (TCR)
+
CD4
-
CD8
-
(NKT)
thymocytes prevent insulin-dependent diabetes mellitus in
nonobese diabetic (NOD)/Lt mice by the influence of inter-
leukin (IL)-4 and/or IL-10. J Exp Med 1998, 187:1047-1056.
46. Sharif S, Arreaza GA, Zucker P, Mi QS, Sondhi J, Naidenko OV,
Kronenberg M, Koezuka Y, Delovitch TL, Gombert JM, Leite-De-
Moraes M, Gouarin C, Zhu R, Hameg A, Nakayama T, Taniguchi M,
Lepault F, Lehuen A, Bach JF, Herbelin A: Activation of natural
killer T cells by alpha-galactosylceramide treatment prevents
the onset and recurrence of autoimmune type 1 diabetes. Nat
Med 2001, 7:1057-1062.
47. Shi FD, Flodstrom M, Balasa B, Kim SH, Van GK, Strominger JL,
Wilson SB, Sarvetnick N: Germ line deletion of the CD1 locus
exacerbates diabetes in the NOD mouse. Proc Natl Acad Sci
USA 2001, 98:6777-6782.
48. Wang B, Geng YB, Wang CR: CD1-restricted NK T cells protect
nonobese diabetic mice from developing diabetes. J Exp Med
2001, 194:313-320.
49. Singh AK, Wilson MT, Hong S, Olivares-Villagomez D, Du C, Sta-
nic AK, Joyce S, Sriram S, Koezuka Y, Van KL: Natural killer T cell
activation protects mice against experimental autoimmune
encephalomyelitis. J Exp Med 2001, 194:1801-1811.
50. Yoshimoto T, Bendelac A, Hu-Li J, Paul WE: Defective IgE pro-
duction by SJL mice is linked to the absence of CD4
+
, NK1.1
+
T cells that promptly produce interleukin 4. Proc Natl Acad Sci
USA 1995, 92:11931-11934.
51. Chiba A, Oki S, Miyamoto K, Hashimoto H, Yamamura T, Miyake S:
Suppression of collagen-induced arthritis by natural killer T
cell activation with OCH, a sphingosine-truncated analog of
alpha-galactosylceramide. Arthritis Rheum 2004, 50:305-313.
52. Mieza MA, Itoh T, Cui JQ, Makino Y, Kawano T, Tsuchida K, Koike
T, Shirai T, Yagita H, Matsuzawa A, Koseki H, Taniguchi M: Selec-
tive reduction of V alpha 14
+
NK T cells associated with dis-
ease development in autoimmune-prone mice. J Immunol
1996, 156:4035-4040.
53. Yang JQ, Saxena V, Xu H, Van KL, Wang CR, Singh RR: Repeated
alpha-galactosylceramide administration results in expansion
of NK T cells and alleviates inflammatory dermatitis in MRL-
lpr/lpr mice. J Immunol 2003, 171:4439-4446.
54. Forestier C, Molano A, Im JS, Dutronc Y, Diamond B, Davidson A,
Illarionov PA, Besra GS, Porcelli SA: Expansion and hyperactiv-
ity of CD1d-restricted NKT cells during the progression of sys-
temic lupus erythematosus in (New Zealand Black × New
Zealand White)F1 mice. J Immunol 2005, 175:763-770.
55. Zeng D, Lee MK, Tung J, Brendolan A, Strober S: Cutting edge: a
role for CD1 in the pathogenesis of lupus in NZB/NZW mice.
J Immunol 2000, 164:5000-5004.
56. Zeng D, Liu Y, Sidobre S, Kronenberg M, Strober S: Activation of
natural killer T cells in NZB/W mice induces Th1-type immune
responses exacerbating lupus. J Clin Invest 2003,
112:1211-1222.
57. Singh AK, Yang JQ, Parekh VV, Wei J, Wang CR, Joyce S, Singh
RR, Van KL: The natural killer T cell ligand alpha-galactosylce-
ramide prevents or promotes pristane-induced lupus in mice.
Eur J Immunol 2005, 35:1143-1154.
58. Chiba A, Kaieda S, Oki S, Yamamura T, Miyake S: The involve-
ment of V(alpha)14 natural killer T cells in the pathogenesis of
arthritis in murine models. Arthritis Rheum 2005,
52:1941-1948.
59. Jahng AW, Maricic I, Pedersen B, Burdin N, Naidenko O, Kronen-
berg M, Koezuka Y, Kumar V: Activation of natural killer T cells
potentiates or prevents experimental autoimmune
encephalomyelitis. J Exp Med 2001, 194:1789-1799.
60. Miyamoto K, Miyake S, Yamamura T: A synthetic glycolipid pre-
vents autoimmune encephalomyelitis by inducing TH2 bias of
natural killer T cells. Nature 2001, 413:531-534.