Báo cáo y học: "Natural autoantibodies reactive with glycosaminoglycans in rheumatoid arthritis" ppsx
Bạn đang xem bản rút gọn của tài liệu. Xem và tải ngay bản đầy đủ của tài liệu tại đây (1.46 MB, 12 trang )
Open Access
Available online />Page 1 of 12
(page number not for citation purposes)
Vol 10 No 5
Research article
Natural autoantibodies reactive with glycosaminoglycans in
rheumatoid arthritis
Bence György
1
, László Tóthfalusi
2
, György Nagy
1,3
, Mária Pásztói
1
, Pál Géher
3
, Zsolt Lörinc
4
,
Anna Polgár
5
, Bernadett Rojkovich
3
, Ilona Ujfalussy
3
, Gyula Poór
5
, Péter Pócza
1
, Zoltán Wiener
1
,
Petra Misják
1
, Agnes Koncz
6
, András Falus
1,7
and Edit I Buzás
1
1
Department of Genetics, Cell- and Immunobiology, Semmelweis University, Nagyvarad ter 4, H-1089, Budapest, Hungary
2
Department of Pharmacodynamics, Semmelweis University, Nagyvarad ter 4, H-1089, Budapest, Hungary
3
Department of Rheumatology, Semmelweis University, Frankel Leó utca 54, H-1027, Budapest, Hungary
4
Institute of Enzymology, Biological Research Center, Hungarian Academy of Sciences, Karolina út 29, H-1518, Budapest, Hungary
5
National Institute of Rheumatology and Physiotherapy, Frankel Leó utca 25-29, H-1023, Budapest, Hungary
6
Heim Pal Hospital, Ülloi út 86, H-1089, Budapest, Hungary
7
Research Group for Inflammation Biology and Immunogenomics, Hungarian Academy of Sciences, Nagyvarad ter 4, H-1089, Budapest, Hungary
Corresponding author: Edit I Buzás,
Received: 22 Jan 2008 Revisions requested: 4 Mar 2008 Revisions received: 27 Aug 2008 Accepted: 12 Sep 2008 Published: 12 Sep 2008
Arthritis Research & Therapy 2008, 10:R110 (doi:10.1186/ar2507)
This article is online at: />© 2008 György et al.; licensee BioMed Central Ltd.
This is an open access article distributed under the terms of the Creative Commons Attribution License ( />),
which permits unrestricted use, distribution, and reproduction in any medium, provided the original work is properly cited.
Abstract
Introduction Although natural autoantibodies make up the
majority of circulating immunoglobulins and are also present in
high numbers in therapeutically used intravenous
immunoglobulin preparations, they have received little attention
and their precise role remains largely unknown. An increasing
awareness of the importance of posttranslational autoantigen
modifications and glycobiology led us to explore carbohydrate-
reactive natural autoantibodies in patients with rheumatoid
arthritis. This study examined systematic antibodies reactive to
glycosaminoglycans (GAGs), the carbohydrate components of
proteoglycans that are released in large amounts from
degrading cartilage.
Methods To measure antibodies reactive to six different types
of GAGs, a specialised ELISA was used in which the
carbohydrates were covalently linked to the plastic surface
through a 2 nm spacer. Sera from rheumatoid arthritis patients
(n = 66), umbilical cord serum samples (n = 11) and adult
controls (n = 54) were studied. In order to explore cross-
reactivity with microbial antigens, bacterial peptidoglycans and
fungal polysaccharides were used. Sera and synovial fluid
samples were also tested using a GlycoChip carbohydrate array
to characterise individual carbohydrate recognition patterns.
We followed a multistep statistical screening strategy for
screening GAG-reactive antibodies as predictive disease
markers.
Results While anti-GAG antibodies were absent in the umbilical
cord sera, they were readily detectable in adult controls and
were significantly elevated in patients with rheumatoid arthritis
(p < 0.001). Anti-GAG antibodies showed significant cross-
reactivity among different types of GAGs. They also reacted with
bacterial peptidoglycans and fungal polysaccharides.
Interestingly, anti-chondroitin sulphate C IgM antibody levels
showed inverse correlation both with the Disease Activity Score
(DAS) 28 scores and C-reactive protein (CRP) levels in
rheumatoid arthritis.
Conclusion The highly abundant and cross-reactive, GAG-
specific natural autoantibodies in serum may serve as novel
disease-state markers in patients with rheumatoid arthritis.
ACR: American Colleage Rheumatology; ACPA: anti-citrullinated protein antibody; BSA: bovine serum albumin; CCP: cyclic citrullinated peptide;
CRP: C-reactive protein; CS: chondroitin sulphate; DAS: disease activity score; GAG: glycosaminoglycan; HA: hyaluronic acid; HS: heparan sul-
phate; KS: keratan sulphate; Nab: natural autoantibody PBS: Phosphate buffered saline; PGIA: proteoglycan-induced arthritis, aggrecan induced
arthritis RA: rheumatoid arthritis; RF: rheumatoid factor.
Arthritis Research & Therapy Vol 10 No 5 György et al.
Page 2 of 12
(page number not for citation purposes)
Introduction
Rheumatoid arthritis (RA) is a chronic, destructive autoimmune
disease of the joints, which affects about 0.5 to 1% of the pop-
ulation [1]. It is characterised by the presence of autoantibod-
ies that are reactive to various target molecules [2,3]. The best
known autoantibodies include rheumatoid factor (RF), anti-cit-
rullinated protein antibodies (ACPA) [4-6] and anti-collagen
antibodies. Autoantibodies have attracted increasing attention
recently and it is estimated that at least 50% of patients with
RA have a preclinical phase associated with elevated levels of
certain autoantibodies [4-6]. RF, an antibody reactive to the Fc
portion of IgG, has been long implicated in the pathogenesis
of RA. RF is also produced during the course of the physiolog-
ical response to various viral and bacterial infections and dur-
ing certain inflammatory conditions, in order to help eliminate
the immune complexes formed [7]. Highly specific RFs are
present in RA and may contribute to the joint inflammation, and
may help B cells to take up and present various autoantigens
[7]. Both RF and ACPA are important prognostic factors in
RA.
Serum IgMs are predominantly B1 B-cell-derived natural
autoantibodies (NAbs). These polyreactive, low-affinity immu-
noglobulins are known to represent a first-line defence against
infectious agents. They are also known as components of the
immunological homunculus, the immune system's built-in self-
representation of the body [8]. Some NAbs recognise carbo-
hydrates, but the role of carbohydrate-specific NAbs in RA has
not been fully investigated yet.
The present study focuses on NAbs that are reactive to gly-
cosaminoglycans (GAGs), important molecular constituents
of both cell surface proteoglycans and large and small prote-
oglycans of the extracellular matrix of hyaline cartilage. GAGs
are released from the degrading cartilage matrix in large
amounts during inflammation of the joints. They are composed
of repetitive disaccharide units of a hexosamine and hexuronic
acid attached through a linker oligosaccharide region to the
core protein of proteoglycans. A high number of GAGs are
linked to the core protein of cartilage aggrecan. These nega-
tively charged carbohydrates are responsible for the high
swelling capacity of cartilage.
Our previous studies demonstrated that in Bagg Albino
(BALB/c) mice, human aggrecan (partially depleted in its GAG
chains) can provoke a chronic, progressive autoimmune pol-
yarthritis (proteoglycan aggrecan-induced arthritis [PGIA])
that is similar to human RA, and the disease can be transferred
to naïve syngeneic mice [9]. We have previously shown that
GAG side chains play an important role in the pathogenesis of
aggrecan-induced arthritis; although keratan sulphate can
mask certain T-cell epitopes, chondroitin-sulphate stubs pro-
voke a strong B-cell response and GAG-specific B cells are
important antigen-presenting cells during the development of
aggrecan-induced murine arthritis [10]. A high correlation
between levels of serum and synovial fluid antibodies reactive
to aggrecan and biglycan has been described [11] and may
have been due to the presence of shared GAG chains of the
two different proteoglycans.
To the authors' knowledge, this is the first study to describe
significantly elevated anti-GAG antibody levels in sera of
patients with RA and to show cross-reactivity with bacterial
and fungal peptidoglycans. Our data suggest that anti-chon-
droitin sulphate C IgM NAbs may serve as disease-state mark-
ers of RA.
Materials and methods
Sample selection
Sera from 66 patients with RA (mean age +/- SD 62.5 +/-
9.13 years; range 42 to 88 years; 52 females; 14 males) was
examined in this study. Serum and synovial fluid samples from
five patients with RA were also tested in the study (three
males, two females). All RA patients fulfilled the diagnostic cri-
teria of the American College of Rheumatology (ACR) [12].
Patients were treated in the Department of Rheumatology,
Semmelweis University, and the National Institute of Rheuma-
tology and Physiotherapy, both in Budapest, Hungary. Control
serum samples (n = 55) representing the natural Caucasian
Hungarian population were obtained from the National Trau-
matology Hospital, Budapest (mean age +/- SD 59.7 +/- 11.6
years; range 31 to 84 years; 43 females; 11 males), and 11
umbilical cord blood samples were obtained from the first
Department of Obstetrics and Gynecology, Semmelweis Uni-
versity, Budapest. The clinical and serological data of the
patients were documented at the time of venepuncture.
Patients were divided into three groups based on their disease
activity score (DAS) 28: those with DAS 28 scores of 3.2 or
less were considered to have low disease activity (DAS1);
patients with DAS 28 scores of 3.2 to 5.1 were considered to
have medium disease activity (DAS2); and patients with DAS
28 score of 5.1 or more were considered to have high disease
activity (DAS3) [13]. Serum and synovial fluid samples were
stored at -20°C until use. During the entire investigation period
we followed the guidelines and regulations of the Helsinki
Declaration in 1975, and the experiments were approved by
the Ethical Committee of Semmelweis University; all patients
or parents of children signed an informed consent form.
Determination of anti-CCP antibody levels
Serum antibodies reactive to cyclic citrullinated peptide
(CCP) were measured with a commercial ELISA (Immunoscan
RA Anti-CCP test kit, Eurodiagnistica AB, Malmö, Sweden)
according to the manufacturer's instructions.
Determination of rheumatoid factors
For the determination of IgM and IgG RFs in the sera of
patients with RA and controls, we used AUTOSTATTMII RF
IgM and IgG kits (Hycor Biomedical GmbH, Kassel, Germany).
Available online />Page 3 of 12
(page number not for citation purposes)
RFs can interfere with ELISA results by binding to the antigen
and then subsequently to the detection antibody giving false-
positive results. To rule out this possibility, we used the Cov-
aLink ELISA system (Nunc, Wiesbaden, Germany) to see if
RFs could bind to GAGs. We used IgM and IgG RFs provided
by the AUTOSTATTMII RF IgM and IgG kits (Hycor Biomedi-
cal GmbH, Kassel, Germany). We tested a concentration
range of RF IgM of 0.128 to 80 IU/mL and IgG 0.0512 to 32
IU/mL, but could not find any evidence of RF reactivity to any
of the GAGs.
Determination of serum C-reactive protein levels
C-reactive protein (CRP) levels were determined with a Full
Range CRP turbidimetric assay (Randox Laboratories Ltd.
Crumlin, County Antrim UK) was performed using Olympus
AU600 biochemistry analyser (Olympus Medical Systems
Europa GmbH, Hamburg, Germany) according to the manu-
facturer's instructions.
Detection of carbohydrate-specific antibodies
The GAGs used in this study included chondroitin sulphate A
(CSA), chondroitin sulphate B (CSB), chondroitin sulphate C
(CSC), keratan sulphate (KS), low molecular weight heparin
sulphate (HS) and hyaluronic acid (HA) (all purchased from
Sigma-Aldrich Ltd. St. Louis, MO). The problem of poor carbo-
hydrate binding to polystyrene surfaces was solved by the use
of a CovaLink ELISA, a system that uses a 2 nm spacer arm
rendering surface-bound carbohydrates accessible by anti-
bodies [14]. Briefly, carbohydrate antigens were covalently
bound to the surface of the CovaLink plates (Nunc, Wies-
baden, Germany) using 1% 1-(3-dimethylaminopropyl)-3-
ethylcarbodiimid (1% EDC, Merck Whitehouse Station, NJ) at
1 μg/well. Plates were incubated for two hours at 37°C and
then overnight at room temperature. Blocking was carried out
using 1% PBS-BSA-Na azide for two hours at room tempera-
ture. Sera and synovial fluid samples were used at a 1:100
dilution (a concentration selected after preliminary experi-
ments). HRP-conjugated anti-human IgM and anti-human IgG
(both from Sigma-Aldrich, St. Louis, MO) were used as sec-
ondary antibodies at 1:50000 and 1:30000 dilutions, respec-
tively. Orto-phenylene-diamine (Sigma-Aldrich, St. Louis, MO)
and 0.33% hydrogen peroxide were added and the absorb-
ance was detected at 492 nm. For each plate standard curves
were drawn using known amounts of nonconjugated human
IgG and IgM (both from Sigma-Aldrich, St. Louis, MO).
To test if the presence of RF in human sera interferes with the
carbohydrate-specific ELISAs, we collected RF from randomly
selected RA serum samples (n = 6). We coupled heat aggre-
gated (63°C, 30 minutes) human IgG (Sigma Aldrich, St.
Louis, MO) to cyanogen bromide activated Sepharose 4B
(Sigma Aldrich, St. Louis, MO) at 5 mg/ml gel. For two hours
250 μl sera were incubated with continuous stirring in the
presence of 500 μl human IgG-coupled resin. The removal of
RF was confirmed using the AUTOSTATTMII RF kit, and car-
bohydrate ELISAs were repeated with RF-containing and RF-
free serum pairs. Removal of the RFs did not influence the car-
bohydrate recognition pattern.
Determination of total IgM and IgG levels
We used the CovaLink ELISA system to determine the total
IgM and IgG levels of the patients and controls. For each plate
standard curves were drawn using known amounts of noncon-
jugated human IgG and IgM.
Inhibition of binding of anti-GAG antibodies
GAGs, bacterial peptidoglycans, a fungal polysaccharide and
a weakly anionic exchanger resin (Duolite C433, Sigma-
Aldrich, St. Louis, MO) were used to inhibit the binding of
GAG-reactive antibodies. We tested peptidoglycans from
Escherichia coli, Staphylococcus aureus, Bacillus subtilis and
the fungal polysaccharide, Zymosan (all purchased from Invit-
rogen, Carlsbad, CA). Serum samples, diluted to 1:100 with
PBS-Tween, were preincubated for two hours at 37°C with
0.5 μg/μl, 5 μg/μl and 50 μg/μl peptidoglycans, Zymosan and
GAGs. All three antigens were used in three different concen-
trations in the same volume. To 1.5 ml serum diluted to 1:100
with PBS-Tween, 20 mg of Doulite C433 (Sigma) was added.
After two hours of preincubation at 37°C, the resin was pel-
leted and the supernatant was used in CovaLink ELISA.
Digestion of aggrecan with glycosidases
Bovine aggrecan was purchased from Sigma-Aldrich. Human
aggrecan monomers were purified from human newborn carti-
lage samples. The use of human cadaver cartilage was
approved by the Institutional Review Board of Semmelweis
University. Aggrecan monomers were isolated as previously
described [15]. Briefly, cartilage samples were dissected and
extracted at 4°C in 4 M guanidine hydrochloride and 50 mM
sodium acetate at a pH of 5.8 for 48 hours. High buoyant den-
sity aggrecan monomers were prepared by dissociative
cesium chloride density gradient ultracentrifugation. Aggrecan
was digested with either β-galactosidase from jack bean
(Sigma-Aldrich, St. Louis, MO) or hyaluronidase from sheep
testis (Sigma-Aldrich, St. Louis, MO). Proteoglycans were
digested with 100 U/mg of β-glucuronidase in 0.15 M citrate-
phosphate buffer, at pH 4.3, and 240 U/mg of hyaluronidase
in 0.2 M NaCl-acetate buffer, at pH 5.0, for 24 hours at 37°C
in the presence of protease inhibitors (10 mM EDTA, 2 mM
PMSF, 2 mM iodoacetamide and 5 μg/ml pepstatin A) (all pur-
chased from Sigma-Aldrich, St. Louis, MO). Digested prote-
oglycans were stored at -20°C until used. Both native and
digested human and bovine aggrecans were used to coat the
conventional ELISA plates (Nunc Maxisorp, Nunc, Wies-
baden, Germany) 0.2 μg protein/well, and were incubated for
two hours at 37°C. Blocking and incubation with primary and
secondary antibodies were carried out the same way as
described earlier for the CovaLink ELISA system.
Arthritis Research & Therapy Vol 10 No 5 György et al.
Page 4 of 12
(page number not for citation purposes)
Glycochip
IgGs of serum and synovial fluid samples were labelled with
Alexa Fluor 350-conjugated antihuman IgG antibody (Fab
fragment) (Zenon Human IgG Labeling Kits, Molecular Probes
Inc. Invitrogen (Invitrogen Corporation, Carlsbad, CA) accord-
ing to the manufacturer's instructions. Briefly, 1 μg Fab was
used to label 1 μg IgG in TBS. Labelled IgGs 10 μl/well were
applied to the Glycochip (Glycominds Ltd., Lod, Israel) at a
concentration of 10 μg/ml of IgG. The Glycochip included the
following surface-bound carbohydrate structures: Gal (a); Gal
(b); Gal (b1-3) [GlcNAc (b1-6)] GalNAc (a); Gal (b1-3) Gal-
NAc (a); Ab3GNb Gal (b1-3) GlcNAc (b); Gal (b1-4) Glc (b);
Gal (b1-4) GlcNAc (a); Gal (b1-4) GlcNAc (b); Gal (b1-6) Gal
(b); GalNAc (a); GalNAc (b); Fuc (a); Fuc (a1-2) Gal(b); Fuc
(a1-2) Gal(a); Fuc (b); Glc (a); Glc (a1-4) Glc (a); Glc (a1-4)
Glc (b); Glc (b); Glc (b1-4) Glc (b); Glc (b1-4) Glc (b1-4) Glc
(b); GlcNAc (a); GlcNAc (b); GlcNAc (b1-3) GalNAc (a); Glc-
NAc (b1-4) GalNAc (b); GlcNAc (b1-6) GalNAc (a); L-Rha (a);
GalA (b); Man (a); Man (a1-3) Man (a); Man (b); Man (b1-4)
Glc (b); Neu5Ac (a); L-Araf (a), GlcA (b); Xyl (a); Xyl (b).
The carbohydrate array was incubated for two hours at 37°C,
and then washed three times with a buffer containing 2 M
NaCl, 0.04 M MgSO4 and 0.5% Tween 20. In order to reduce
the background, plates were soaked for 10 to 15 minutes in
the same buffer after the last washing step. After washing, 10
μl of TBS was added to the plate before measuring fluores-
cence on a Perkin Elmer Victor II spectrofluorimeter. Excitation
wavelength was 355 nm; emission was detected at 460 nm.
Immunohistochemistry
Normal adult human cadaver cartilage was cut by cryostat and
mounted onto SuperFrost (Thermo Fisher Scientific, Waltham,
MA) slides. Specimens were fixed immediately by alcohol/ace-
tone for five minutes, and the non-specific binding sites were
blocked by 5% BSA (Sigma Aldrich, St. Louis, MO) in PBS for
45 minutes at room temperature in a humid chamber. Speci-
mens were washed in PBS, and incubated with RA serum
(1:25) or with serum that was preincubated with 2 mg/ml or 4
mg/ml CSC for 60 minutes at room temperature. Specimens
were washed three times in PBS, and incubated with the fluo-
rescein isothiocyanate-labelled anti-human immunoglobulin
(1:100 dilution, Sigma-Aldrich, St. Louis, MO) for 45 minutes
at room temperature, and then washed three times in PBS.
Cover slips were mounted on the slides using PBS-glycerin
(1:1) as a mounting medium. The slides were analysed in a
Bio-Rad MRC 1024 confocal laser scanning microscope
(Nikon Instruments Inc. Melville, NY) equipped with a krypton/
argon mixed gas laser. Excitation was carried out at 480 nm
and 540 nm. The fluorescence intensities of each experiment
were normalised to the negative control (from which the pri-
mary antibody was omitted). All negative controls demon-
strated negligible background fluorescence.
Statistical analysis
ELISA assays
We fitted a three-parameter logistic curve to calibrate data and
the unknown anti-GAG sample concentrations were deter-
mined from the fitted calibration curve. In the case of CCP
assays, we subtracted the blank (zero concentration) values
from the standard dilution series data and serum anti-CCP
concentrations were obtained by linearly interpolating this
standard curve. We found that the distribution of anti-GAG
antibodies and CRP concentrations were highly skewed to the
right. Therefore, we logarithmically transformed them, and all
statistical computations were carried out using this data.
ANOVA
A three-factor one-way analysis of variance (ANOVA) model
was used for overall comparisons of sera of patients com-
pared with sera of adult controls and umbilical cord sera. The
dependent variable was the logarithmically transformed anti-
body concentration. The independent factors were: the indica-
tor variable named "Status" showing the group membership
(like control or patient), a variable named "anti-GAG" with lev-
els of GAG, and a third variable named "IgX" showing that the
antibody was of IgM or IgG type. This is a multiplicative model
because anti-GAG concentrations were logarithmically trans-
formed, and the null hypothesis was that the relative increase
due to factor "Status" was not significantly different from one.
Screening of GAG-reactive antibodies as predictive disease
markers
We followed the screening strategy advised by Harrell to find
which of the anti-GAG antibodies would be the best disease
specific marker(s) [16]. The strategy is based on screening
variables for their predictive power and carrying out confirma-
tory tests only with the promising candidates. The advantage
of this strategy is that the problem of multiple testing and the
statistical difficulties due to co-linearity of the variables can be
avoided or greatly reduced. Principal component analysis is an
alternative way of reducing the dimensionality of the data when
the variables are highly co-linear, but it has the disadvantage
that the resulting components are sometimes difficult to inter-
pret.
As a first step of our screening procedure, stepwise logistic
regression was used to select those anti-GAG antibody types
that best discriminated the patient group from the controls. In
the second step of the screening, stepwise ordinal regression
was used to select those anti-GAG antibodies that had the
highest predictive power to correctly categorise patients,
according to their disease activity. In the present case the
dependent variable was the DAS score (1, 2 and 3), while the
independent variables were the concentrations of the mole-
cules that were selected in the first step. In both procedures
candidate variable selection stopped when no step decreased
further than the Akaike's information criterion [17]. As a final
step, we used ANOVA followed by Tukey's post-hoc test to
Available online />Page 5 of 12
(page number not for citation purposes)
statistically confirm the relation between the anti-GAG anti-
body concentration and disease status. All statistical compu-
tations were carried out using Splus (Release 6.1,
Professional version, Insightful, WA) with additional proce-
dures StepAIC and polr from the Mass library [17].
Results
Anti-GAG antibody concentrations of serum samples
Table 1 lists the concentrations of GAG-reactive IgM and IgG
antibodies in neonatal serum samples, in sera of adult controls
and in sera of patients with RA. Anti-GAG antibodies were
almost undetectable and uniformly extremely low in all umbili-
cal cord samples compared with adult controls. In the case of
IgM, this was expected, because the total IgM in the umbilical
blood serum is reported to be very low [18]. The difference
between serum anti-GAG antibody levels of controls and
umbilical cord samples was significant (three-way ANOVA, F
= 110.70; DF = 1.77; p < 0.001). F indicates F-statistics, DF
indicates degree of freedom. Initial statistical analysis showed
that the anti-GAG concentrations were significantly higher in
the sera of RA patients as compared with adult controls. The
mean antibody concentrations were two to four times higher in
patients than in controls (Table 1). The difference was highly
significant (three-factor ANOVA, F = 30.17; DF = 1.11; p <
0.001), and independent from the type of antigen and the type
of antibody. In terms of ANOVA model, the interaction of
"GAG" with "Status" and "IgX" with "Status" were not signifi-
cant (F = 0.59, N.S. and F = 0.72, N.S. respectively).
The ratio of anti-CSC and total IgM level was mean 4.68 ±
3.15%, range 0.17 to 21.33% in the patient group, whereas
the ratio of anti-CSC and total IgG level was mean 0.83 ±
0.73%, range 0.1 to 14.29%. In the control group the ratio of
anti-CSC and total IgM was mean 6.59 ± 3.04%, range 1.77
to 22.97%, while the ratio of anti-CSC and total IgG was mean
1.57 ± 1.36%, range 0.13 to 20.58% (data not shown).
Synovial fluid anti-GAG antibody concentrations
Anti-GAG concentrations were higher in the serum than in
synovial fluid (data not shown). This difference was highly sig-
nificant (three-factor ANOVA, p < 0.001). There was also sig-
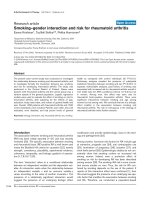
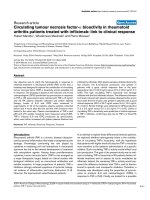
nificant correlation between serum and synovial fluid IgM
antibody concentrations (r = 0.71, p < 0.001) but such a rela-
tion could not be demonstrated for IgG antibodies (r = 0.13,
N.S. Figure 1).
The ratios of synovial fluid/serum antibodies for IgM antibodies
were as follows: CSA 0.15 ± 0.04; CSB 0.23 ± 0.06; CSC
0.37 ± 0.19; KS 0.25 ± 0.10; HS 0.26 ± 0.13; and HA 0.75
± 0.3. The ratios of synovial fluid/serum antibodies for IgG
antibodies were as follows: CSA 4.22 ± 6.53; CSB 1.75 ±
2.34; CSC 19.4 ± 30.84; KS 4.34 ± 6.46; HS 8.10 ± 9.40;
and HA 1.32 ± 1.63 (data not shown).
Anti-GAG antibodies as disease markers
In the initial analysis discussed above, patients were treated as
a homogenous group regardless of disease activity at the time
Table 1
Anti-glycosaminoglycan antibody concentrations
Antibody (μg/mL) Umbilical cord serum Control serum RA patients serum
Mean ± SEM Mean ± SEM Mean ± SEM
Anti-chondroitin sulphate A IgM 1.63 ± 0.3 750.95 ± 343.1 1225.27 ± 354.2
Anti-chondroitin sulphate B IgM 1.36 ± 0.2 608.00 ± 302.3 1300.61 ± 389.2
Anti-chondroitin sulphate C IgM 1.73 ± 0.4 673.70 ± 305.7 1964.34 ± 461.7
Anti-keratan sulphate IgM 1.63 ± 0.2 275.11 ± 184.5 836.87 ± 321.3
Anti-heparan sulphate IgM 2.27 ± 0.4 1115.91 ± 383.0 2605.36 ± 516.8
Anti-hyaluronic acid IgM 1.27 ± 0.2 4.32 ± 0.9 14.18 ± 4.5
Anti-chondroitin sulphate A IgG 1.54 ± 0.4 203.09 ± 89.1 872.79 ± 310.7
Anti-chondroitin sulphate B IgG 1.77 ± 0.8 508.07 ± 215.9 1551.62 ± 417.2
Anti-chondroitin sulphate C IgG 1.27 ± 0.1 241.53 ± 176.3 717.86 ± 273.3
Anti-keratan sulphate IgG 4.91 ± 4.3 1871.63 ± 481.1 2704.11 ± 525.2
Anti-heparan sulphate IgG 4.05 ± 3.8 1066.59 ± 326.7 2689.71 ± 515.8
Anti-hyaluronic acid IgG 1.09 ± 0.2 960.93 ± 365.3 1227.82 ± 379.3
Mean antibody concentrations are expressed in μg/mL. The difference between serum anti-glycosaminoglycan (GAG) antibody levels of controls
and umbilical cord samples was significant (three-way analysis of variance [ANOVA], F = 110.70; DF = 1.77; p < 0.001). The difference between
RA patients and adult controls was also highly significant (three-factor ANOVA, F = 30.17 DF = 1.11 p < 0.001), and independent from type of
the antigen and from the type of the antibody as well.
Arthritis Research & Therapy Vol 10 No 5 György et al.
Page 6 of 12
(page number not for citation purposes)
of serum sampling. However, RA is a fluctuating disorder and
biological markers show that a strong dependence from the
functional status of the patient [19]. The initial statistical anal-
ysis indicated that anti-GAG antibodies can be useful biomar-
kers, but it was unknown if they were disease-specific or
disease-state-specific biomarkers. A disease-specific biomar-
ker correctly differentiates patients from controls, whereas a
disease-state-specific marker separates patients according to
their status. To find out if they were they were disease-specific
or disease-state-specific biomarkers, we categorised the
patients by their DAS 28 scores [13,20]. The relation between
anti-GAG concentrations and DAS 28 scores was investi-
gated by the two-step screening procedure described above.
In brief, the goal of our screening procedure was to find one or
more anti-GAG antibody species from the measured 12 that
carry the same biological information as the whole data set. To
find such representing variables is only a reasonable strategy
in a case when the variables strongly correlate with each other.
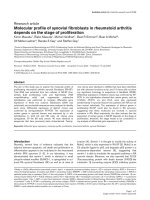
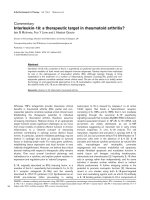
As Figure 2 shows, anti-GAG antibody concentrations posi-
tively correlate with each other. This correlation was particu-
larly strong among IgM molecules, with the correlation
coefficient in all cases being higher then 0.8. Principal compo-
nent analysis (results not shown) also indicated that two linear
combinations of the IgM and IgG concentrations could explain
84.5% of the total variance. Therefore, selection of a repre-
sentative anti-GAG antibody molecule was a statistically rea-
sonable approach.
In the first step of the screening, stepwise logistic regression
selected five anti-GAG antibody types as being potentially
good RA disease markers. The selected five anti-GAG anti-
bodies were: anti-KS IgG, anti-HS IgG, anti-CSC IgM, anti-
CSB IgM and anti-HA IgM. In the second step, we used step-
wise ordinal regression to find those anti-GAG antibodies that
could distinguish patients with different DAS scores. From the
five possible candidates selected in the first step, four were
eliminated in the second step, and only anti-CSC IgM
remained as a possible candidate. We confirmed this hypo-
thesis with ANOVA followed by a Tukey's post-hoc test (Fig-
ure 3a). The anti-CSC IgM concentration was significantly
Figure 1
Correlation between serum and synovial fluid anti-glycosaminoglycan (GAG) IgM and IgG antibodies in rheumatoid arthritis (RA)Correlation between serum and synovial fluid anti-glycosaminoglycan (GAG) IgM and IgG antibodies in rheumatoid arthritis (RA). Note the strong
and statistically significant correlation (p < 0.001) between the corresponding IgM anti-GAG concentrations in serum and synovial fluid samples.
Such a relation could not be demonstrated for IgG antibodies (r = 0.13, N.S).
Available online />Page 7 of 12
(page number not for citation purposes)
higher in RA patients compared with the controls (F = 6.17,
DF = 1,93, p < 0.02), but anti-CSC IgM is not a disease-spe-
cific maker, but a disease-state marker (Figure 3b). Its value is
significantly higher in patients with RA when the disease is
inactive (DAS 28 <3.2) compared with controls and patients
in the active disease state as well (p < 0.05, ANOVA followed
by Tukey's post-hoc test). Conversely, there was no significant
difference between controls and patient who were in the
active disease period.
A similar relation was found when we analysed the connection
between disease activity, CRP and anti-CSC IgM concentra-
tions. CRP significantly increases with increasing DAS scores
(F = 4.64, DF = 2.34, p < 0.02) (Figure 3c). Therefore, we
expected an inverse relation between disease activity and anti-
CSC IgM. To demonstrate this relation, we divided patients
having low, moderate and high-CRP concentrations into three
categories that contained almost equal number of patients. An
inverse relation does exist, although anti-CSC IgM is only sig-
nificantly different between the low and moderate-CRP groups
(F = 3.65, DF = 2.45, p < 0.05) (Figure 3d). Based on these
results, we again compared RA patients with controls using all
measured anti-GAG concentrations, but now patients were
stratified by their DAS scores. The results confirmed our
results. The three-way ANOVA model, applied previously, indi-
cated a highly significant difference between patients with low
(F = 0.3 DF = 1.71, p < 0.001) and moderate DAS scores (F
= 33.35, DF = 1.91). But there was no difference between
controls and patients with DAS scores of 5.1 or more (F =
0.22, DF = 1.79).
Figure 2
Scatter plot of anti-glycosaminoglycan (GAG) antibody concentrationsScatter plot of anti-glycosaminoglycan (GAG) antibody concentrations. Log-transformed antibody concentrations were plotted against each other.
Figure 2 suggests that there is a strong relation between anti-GAG antibody concentrations, particularly among IgM molecules. This observation has
been confirmed by detailed statistical analysis, and the lowest value of the correlation coefficients between anti-GAG IgM antibodies was 0.86. The
concentrations are expressed in μg/mL.
Arthritis Research & Therapy Vol 10 No 5 György et al.
Page 8 of 12
(page number not for citation purposes)
The relation between RFs and anti-GAG antibodies
We measured IgG and IgM RF levels of serum samples and
found elevated RF levels in patients with RA compared with
controls. As expected, the differences were highly significant
for both IgG and IgM RFs (unpaired t-test, p < 0.001). We
found low-correlation coefficients for erythrocyte sedimenta-
tion rate and CRP values of patients with RA. The correlation
coefficients between anti-CCP and RF were 0.211 and 0.214
IgG and IgM, respectively. Although we found very low corre-
lation coefficients in the case of certain antibody levels (such
as CSC-IgG, CSB-IgG or CSA IgG), others (such as CSC
IgM, CSA IgM or HS-IgM) showed relatively high positive cor-
relation. The highest correlation coefficients were found
between CSC-IgM and RF concentrations in the case of both
IgG and IgM RFs (in RA patients r = 0.384 and r = 0.388 for
IgG and IgM RFs, respectively). This might be considered as
a further indication of the significance of IgM anti-CSC levels
in RA. As expected, the dependence of RF concentrations
from DAS scores showed the same pattern as CSC IgM (data
not shown).
The relation between anti-CCP and CSC-IgM antibody
levels
Anti-CCP antibodies are well-established prognostic and
diagnostic biomarkers in RA. Similar to the findings of others
[21], in our study the anti-CCP concentrations did not corre-
late with the DAS 28 scores (one-way ANOVA, F = 1.24, DF
= 2.34, N.S.). Furthermore, there was no correlation between
the anti-CCP and CSC-IgM concentrations (r = 0.08, N.S.).
Anti-GAG antibodies cross-react with other types of
GAGs as well as with peptidoglycans and a fungal
polysaccharide
To confirm cross-reactivity of anti-GAG antibodies, we ana-
lyzed in vitro cross inhibition of antibody binding among the
various GAG types as well as between GAGs and peptidog-
lycans or fungal polysaccharides. In line with the very high cor-
relation of antibody levels reactive to different types of GAGs
that we found in this study, in systemic inhibition assays we
detected broad cross-reactivity among different types of
GAGs (data not shown). Surprisingly, we also detected inhibi-
tion of binding of antibodies to GAGs by B. subtilis peptidog-
lycan. RA serum IgM was 3.1%, 23.0% and 32.3%; RA serum
IgG was 9.3%, 20.6% and 39.4%; control serum IgM was
1.4%, 9.7% and 12.5%; control serum IgG was 22.1%,
22.1% and 33.8%, when using 0.5 μg/μl, 5 μg/μl and 50 μg/
μl inhibitor molecules, respectively. We could also identify sim-
ilar IgM cross-reactions between GAGs and Zymosan in the
case of RA serum antibodies (CSA was 2.9%, 10.7%
and36.4%; CSB was 11.8%, 19.7% and 40.5%; CSC
12.6%, 17.5% was 48.3%; KS was 11.8%, 23.5% and
50.6%; HS was 4.5%, 11.7% and 22.1%; HA was 15.0%,
207% and 33.0% inhibitions were detected using 0.5 μg/μl,
5 μg/μl and 50 μg/μl inhibitor molecules, respectively).
Inhibition of binding of anti-GAG antibodies by anionic
resin
There was a dramatic decrease in binding of antibodies to
GAGs when the serum samples were pre-incubated with the
Duolite weakly acidic exchanger resins. We could inhibit RA
serum IgM antibodies to bind to CSA, CSB, CSC, KS, HS and
HA by Duolite (58.98% ± 0.88%, 59.56% ± 1.53%, 60.77%
± 2.17%, 59.93% ± 0.14%, 64.80% ± 1.76%, 45.95% ±
181.42%, respectively). It is important to note that the weak-
est inhibition was detected in the case of HA, while the strong-
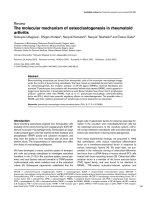
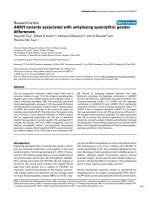
Figure 3
Correlation of anti-chondroitin sulphate C IgM levels with the disease and activity markers in rheumatoid arthritisCorrelation of anti-chondroitin sulphate C IgM levels with the disease
and activity markers in rheumatoid arthritis. (a) Box plots of anti-chon-
droitin sulphate (CS) C IgM concentrations groups of controls and
patients with rheumatoid arthritis (RA). The logarithm of the anti-CSC
IgM concentration is plotted. The lines inside the boxes denote the
medians. The boxes mark the interval between the 25th and 75th per-
centiles. The ends of the vertical lines or whiskers indicate the minimum
and maximum data values, unless outliers are present in which case the
whiskers extend to a maximum of 1.5 times the interquartile range. The
difference between the controls (n = 55) and RA patients (n = 66) is
statistically significant (p < 0.02, F-test). (b) Box plots of anti-CSC IgM
concentrations in groups of controls and the patients with RA. Patients
are stratified according to disease activitity scores (DAS) 28. Patients
classified to DAS 1 group (n = 6) have significantly higher anti-CSC
IgM concentrations compared with controls and to patients in the DAS
2 (n = 22) and 3 (n = 18) categories. No other significant differences
have been found (p < 0.05, post-hoc Tukey's test). Result suggests
that anti-CSC IgM is not a disease, but a state dependent marker. (c)
Comparison of C-reactive protein (CRP) levels in patients according to
their DAS scores. On the vertical axis the logarithm of CRP concentra-
tion is plotted. The only significant difference was found between
groups DAS 1 and 3 (p < 0.05, post-hoc Tukey's test). (d) Box plots of
anti-CSC IgM concentrations in groups of controls and patients with
RA. Patients were stratified according to their CRP values into three
subgroups: those having low, moderate or high CRP values (n = 17, n
= 16 and n = 16, respectively). The anti-CSC IgM titre decreases when
CRP concentration increases; the difference between the low and high
CRP group is statistically significant (p < 0.05, post-hoc Tukey's test).
Available online />Page 9 of 12
(page number not for citation purposes)
est inhibition was seen in the case of HS, GAGs that have the
lowest and highest number of negative charged groups,
respectively. Doulite could also inhibit binding of IgG type anti-
GAG antibodies to CSA, CSB, CSC, KS, HS and HA
(70.85% ± 0.05%, 58.57% ± 1.57%, 61.84% ± 0.60%,
64.49% ± 1.19%, 63.25% ± 2.1%, 62.60% ± 0.66%,
respectively).
Antibody recognition of glycosidase-digested human
cartilage aggrecan
Glycosidase activity may be elevated within the joints during
inflammation and microbial infections [22]. Hyaluronidase
digestion of aggrecan increased RA serum and synovial fluid
IgM reactivity by 28% (p < 0.05) and 42% (p < 0.001),
respectively. Similarly, digestion with β-galactosidase
increased RA serum and synovial fluid IgM reactivity to aggre-
can by 21% (p < 0.05) and by 22% (p < 0.01), respectively.
On the contrary, neither of the glycosidase cleavages affected
reactivity of IgM-type control serum antibodies (data not
shown). RA synovial fluid, but not serum-derived IgGs showed
significantly enhanced reactivity after hyaluronidase-cleavage
(31%, p < 0.05). Even IgGs from controls reacted 28%
stronger with hyaluronidase-digested aggrecan than with the
undigested one (p < 0.05), but their reactivity to β-galactosi-
dase-digested aggrecan was not enhanced (data not shown).
Determination of carbohydrate recognition patterns
To determine individual carbohydrate recognition patterns, we
used a Glycochip system. IgGs of sera of five patients with RA,
synovial fluid samples of five RA patients and of five sera of
control adult individuals were tested on Glycochip plates.
Although there were some carbohydrates to which we could
detect higher reactivity in some of the patients with RA than in
the controls (such as Gal(a), Man(a) and GlcA (b), Gal(b1-3)
[GlcNAc(b1-6)] GalNAc (a)), we could not identify a clear car-
bohydrate recognition pattern specific for RA (data not
shown).
Binding of carbohydrate-specific antibodies to cartilage
matrix
Finally, we tested the ability of anti-GAG antibodies to bind to
the extracellular matrix of hyaline cartilage. The relatively strong
binding of serum antibodies to the extracellular matrix of hya-
line cartilage could be increasingly inhibited by pre-incubation
of the serum with increasing amounts of CSC (Figure 4).
Discussion
Several lines of evidence support the role of B-cells in the
pathology of RA. The RA synovium is populated by cells that
produce RFs, anti-type II collagen and anti-CCP antibodies.
Furthermore, B-cell depletion by the anti-CD20 monoclonal
antibody rituximab decreases disease activity and provides
prolonged remission [23], further demonstrating that B-cell
activation is important in the pathogenesis of RA.
The existence of carbohydrate-specific antibodies has long
been known, with examples including the blood group-specific
antibodies described by Karl Landsteiner [24]. Some of the
carbohydrate-specific antibodies have also been implicated in
the pathomechanism of autoimmune diseases, e.g. in rheu-
matic carditis [25]. Surprisingly, carbohydrate-specific anti-
bodies have not yet been systematically investigated in RA, in
spite of the fact that hyaline cartilage and synovial fluid contain
large amounts of GAGs including HA, CS and KS. These car-
bohydrates are degraded and released from the tissue during
the course of joint inflammation [26,27].
In this study we found that while GAG-specific antibodies
were absent in neonates, they were present in high amounts in
sera of adults. The repetitive nature of GAGs and the absence
of anti-GAG antibodies in neonates thus, places GAGs in the
category of TI2 antigens [28-31]. Hence, B1 B cells, known to
be reactive to TI2 antigens, are the most probable sources of
anti-GAG nAbs.
Figure 4
Detection of anti-glycosaminoglycan (GAG) antibody binding to the extracellular matrix of hyaline cartilageDetection of anti-glycosaminoglycan (GAG) antibody binding to the
extracellular matrix of hyaline cartilage. Microphotograph (a) shows the
binding of rheumatoid arthritis (RA) serum-derived antibodies to human
cartilage. The reactivity could be inhibited by pre-incubation of the
serum sample with chondroitin sulphate (CS) C. (b) is using 2 mg/ml
CSC; (c) is using 4 mg/ml CSC as an inhibitor). Magnification: 100×
Arthritis Research & Therapy Vol 10 No 5 György et al.
Page 10 of 12
(page number not for citation purposes)
As GAG-specific antibody binding was inhibited by an anionic
exchanger resin, we hypothesise that weak ionic interactions
might play a pivotal role in the recognition of polyanionic
GAGs by these immunoglobulins. In line with the polyreactive
nature of nAbs, we found a strong statistical correlation among
IgM-type GAG-specific antibodies. Also, in inhibition studies
we have shown broad cross-reactivity among different types of
GAGs. This provides further support for the NAb nature of the
detected anti-GAG antibodies. There was much less correla-
tion among IgG-type GAG-specific antibodies, raising the
possibility that these IgG antibodies might represent a distinct
population that is produced after class switch recombination,
that could also possibly require T-cell help. Recently, a specific
set of T-cells have been reported to recognise GAGs both in
a murine model of arthritis and in patients with RA [32]. Thus,
the fully T-independent nature of anti-GAG antibodies remains
to be elucidated.
In the present work we have shown that all IgM anti-GAG anti-
bodies and certain IgG-type anti-GAG antibodies were signif-
icantly elevated in sera of patients with RA compared with
adult controls. These anti-GAG antibodies of RA patients were
not only present in the systemic circulation and in the synovial
fluid, but they were also fully capable of binding to the extra-
cellular matrix of hyaline cartilage. Synovial fluid/serum anti-
GAG antibody ratios were consistently low for IgM antibodies
and were relatively high in the case of IgGs. In contrast to IgM,
IgG gets into the inflamed synovial fluid readily, and thus, our
data argue against local production of IgM type anti-GAG anti-
bodies.
It may be hypothesised that the anti-GAG antibody production
is up-regulated in RA possibly because of the extensive
release of cartilage molecules. Autoantigens are continuously
present in large amounts in the body. They do not delete B1
Bcells and, n the presence of alarm signals, autoantigens may
even efficiently stimulate them. In contrast to the B1a B-cell
population (that shows a constitutive low activity), CD5 (-) B1b
B-cells (implicated in the synthesis of TI2 antigen-specific anti-
bodies) were shown to be capable of significant increases in
their activity [33,34].
The next important step was to test if the levels of anti-GAG
antibodies showed any correlation with the disease activity in
RA. Intriguingly, using a multistep approach, our work has
demonstrated that CSC-specific IgM antibody levels show a
clear inverse correlation with the activity of RA. Thus, we sug-
gest that CSC-specific IgM is a disease-state biomarker in RA.
We found a similar relation when we analysed the connection
between disease activity, CRP and anti-CSC IgM concentra-
tions. We hypothesise that during the active phase of the dis-
ease, the levels of anti-GAG antibodies are reduced because
of binding of these antibodies to GAGs released from the
degrading cartilage. This could also explain the significantly
reduced level of synovial fluid anti-GAG antibodies as com-
pared with the one measured in the serum of patients with RA.
The absence of GAG-specific antibodies in neonates and the
abundance of them in adults, as well as their highly cross-reac-
tive nature, raise the possibility that anti-GAG antibodies are
produced on exposure to environmental microbial carbohy-
drates or glycosylated antigens. Thus, we next assessed if
GAG-specific antibodies could cross-react with microbial anti-
gens. We found that circulating anti-GAG antibodies were
capable of binding to bacterial peptidoglycans and the fungal
polysaccharide, Zymosan. Such cross-reactions may not only
explain the absence of anti-GAG antibodies in neonates, but
may also link infectious agents and RA.
To further address whether microbial infections could contrib-
ute to carbohydrate-specific immune responses, we investi-
gated reactivity of serum antibodies to glycosidase-digested
aggrecan, a major macromolecule of hyaline cartilage that car-
ries over 100 GAG side chains. We found a significantly
increased antibody recognition of aggrecan modified in its
GAG chains by either β-galactosidase or hyaluronidase diges-
tion. Hyaluronidase is a virulence factor of S. aureus, Strepto-
coccus pyogenes or Clostridium perfringens [35-37], while b-
galactosidase is expressed by E. coli [38]. Therefore it is very
likely that carbohydrate neoepitopes are generated in vivo
locally by the activity of these glycosidases during infections.
An increasing body of evidence suggests that cell surface car-
bohydrate pattern is important in immune recognition and self/
non-self discrimination [39]. As glycosidases modify GAG
side chains of proteoglycans, they can also alter the glycosyla-
tion pattern in the tissues. Using a carbohydrate array, we
attempted to characterise the carbohydrate-specific serum
and synovial fluid IgG reactivity patterns of patients with RA
and controls. However, by using a currently available carbohy-
drate array, we could not identify a disease-specific carbohy-
drate recognition pattern. Arrays with more complex display of
carbohydrate structures would be necessary to gain an insight
into the exact epitope specificity of the circulating carbohy-
dratespecific antibodies.
While anti-GAG antibody levels are increased in RA, probably
because of the increased efflux of GAGs from the inflamed
joint, higher anti-GAG levels are associated with less severe
disease according to our present data. The mechanism of the
"protective" role of anti-GAG antibodies is not known. Both
peptidoglycans and HA and HS fragments have been shown
to bind to certain toll-like receptors (TLRs) [39]. Our hypo-
thesis is that one of the roles of the natural anti-GAG antibod-
ies is to bind to the degrading matrix molecules and thus,
prevent the excessive ligation of danger receptors like TLRs.
Hence, the NAbs may reduce the chance of priming of naive
T-cells to self molecules. Also, the degrading matrix releases
not only pure GAG fragments but also GAGs coupled to pep-
tides of proteoglycans undergoing proteolysis. While carbohy-
drates by themselves may not elicit a strong immune response,
glycopeptides are often strongly immunogenic (as clearly
Available online />Page 11 of 12
(page number not for citation purposes)
exemplified by conjugate vaccines [40]). Therefore, by mask-
ing GAG epitopes and facilitating the elimination of such glyc-
opeptides (possibly in the form of immune complexes), anti-
GAG antibodies may have an important function in preventing
or decelerating the autoimmune processes.
Conclusion
It has been proposed that changes in the global NAb network
(referred to as "immunculus distortions") may serve as predic-
tors or early disease markers [41]. Inthe current work we found
that anti-GAG antibody levels sharply discriminate between
adult controls and RA patients with low disease activity (DAS
28 ≤ 3.2), and thus, anti-GAG antibodies may be the key to an
inexpensive early disease activity biomarker. Thus, they might
have the justification to be incorporated into autoantigen
microarrays.
Competing interests
The authors declare that they have no competing interests.
Authors' contributions
BG, LT, GN, MP, AF and EIB participated in the design of the
study. Experiments were performed by BG, ZL, PP, PM and
AK. Statistical analysis was carried out by TL. GN, AP, BR, IU,
GP and PG contributed by providing human samples. Analysis
of data was carried out by BG, TL, GN, MP, AF and EIB. Intel-
lectual contributions to the manuscript were provided by BG,
LT, GN, MP, WZ, AF and EIB. All authors read and approved
the final manuscript.
Acknowledgements
The authors would like to thank Bea Visnyei, Éva Görbe and Anita
Ecsediné Szabó for kindly allowing us to use sera from patients of the
National Traumatology Hospital and the first Department of Obstetrics
and Gynecology, Semmelweis University. This work has been supported
by the following grants: OTKA K 73247, OTKA T046468, OTKA
F61030, Marie Curie Research Training Network grant (contract no.
MRTN-CT-2005-019561) and NKTH (Öveges) HEF_06_3-DGCI-111.
Gyorgy Nagy is a Bolyai Research Fellow.
References
1. Lee DM, Weinblatt ME: Rheumatoid arthritis. Lancet 2001,
358:903-911.
2. Blass S, Engel JM, Burmester GR: The immunologic homuncu-
lus in rheumatoid arthritis. A new viewpoint of immunopatho-
genesis in rheumatoid arthritis and therapeutic
consequences. Z Rheumatol 2001, 60:1-16.
3. Robinson WH, DiGennaro C, Hueber W, Haab BB, Kamachi M,
Dean EJ, Fournel S, Fong D, Genovese MC, de Vegvar HE, Skriner
K, Hirschberg DL, Morris RI, Muller S, Pruijn GJ, van Venrooij WJ,
Smolen JS, Brown PO, Steinman L, Utz PJ: Autoantigen microar-
rays for multiplex characterization of autoantibody responses.
Nat Med 2002, 8:295-301.
4. van Gaalen FA, Linn-Rasker SP, van Venrooij WJ, de Jong BA,
Breedveld FC, Verweij CL, Toes RE, Huizinga TW: Autoantibod-
ies to cyclic citrullinated peptides predict progression to rheu-
matoid arthritis in patients with undifferentiated arthritis: a
prospective cohort study. Arthritis Rheum 2004, 50:709-715.
5. Visser H, le Cessie S, Vos K, Breedveld FC, Hazes JM: How to
diagnose rheumatoid arthritis early: a prediction model for
persistent (erosive) arthritis. Arthritis Rheum 2002,
46:357-365.
6. Verpoort KN, Jol-van der Zijde CM, Papendrecht-van der Voort EA,
Ioan-Facsinay A, Drijfhout JW, van Tol MJ, Breedveld FC, Huizinga
TW, Toes RE: Isotype distribution of anti-cyclic citrullinated
peptide antibodies in undifferentiated arthritis and rheumatoid
arthritis reflects an ongoing immune response. Arthritis
Rheum 2006, 54:3799-3808.
7. Dorner T, Egerer K, Feist E, Burmester GR: Rheumatoid factor
revisited. Curr Opin Rheumatol 2004, 16:246-253.
8. Cohen IR: Biomarkers, self-antigens and the immunological
homunculus. J Autoimmun 2007, 29:246-249.
9. Glant TT, Mikecz K, Arzoumanian A, Poole AR: Proteoglycan-
induced arthritis in BALB/c mice. Clinical features and his-
topathology. Arthritis Rheum 1987, 30:201-212.
10. Glant TT, Buzas EI, Finnegan A, Negroiu G, Cs-Szabo G, Mikecz
K: Critical roles of glycosaminoglycan side chains of cartilage
proteoglycan (aggrecan) in antigen recognition and presenta-
tion.
J Immunol 1998, 160:3812-3819.
11. Polgar A, Falus A, Koo E, Ujfalussy I, Sesztak M, Szuts I, Konrad K,
Hodinka L, Bene E, Meszaros G, Ortutay Z, Farkas E, Paksy A,
Buzas EI: Elevated levels of synovial fluid antibodies reactive
with the small proteoglycans biglycan and decorin in patients
with rheumatoid arthritis or other joint diseases. Rheumatol-
ogy (Oxford) 2003, 42:522-527.
12. Arnett FC, Edworthy SM, Bloch DA, McShane DJ, Fries JF, Cooper
NS, Healey LA, Kaplan SR, Liang MH, Luthra HS, Medsger TA,
Mitchell DM, Neustadt DH, Pinals RS, Schaller JG, Sharp JT,
Wilder RL, Hunder GG: The American Rheumatism Association
1987 revised criteria for the classification of rheumatoid arthri-
tis. Arthritis Rheum 1988, 31:315-324.
13. Disease activity score in rheumatoid arthritis [-
score.nl/www.das-score.nl/index.html]
14. Zielen S, Broker M, Strnad N, Schwenen L, Schon P, Gottwald G,
Hofmann D: Simple determination of polysaccharide specific
antibodies by means of chemically modified ELISA plates. J
Immunol Methods 1996, 193:1-7.
15. Glant TT, Mikecz K, Poole AR: Monoclonal antibodies to differ-
ent protein-related epitopes of human articular cartilage pro-
teoglycans. Biochem J 1986, 234:31-41.
16. Harell JR, Frank E: Regression modeling strategies: with appli-
cations to linear models, logistic regression, and survival anal-
ysis. New York: Springer; 2001.
17. Venables WN, Ripley BD: Modern Applied Statistics with S-
PLUS. New York: Springer; 1999.
18. Koga M, Matsuoka T, Katayama K, Takeda K, Nakata M, Sase M,
Kato H, Furukawa S: Human parvovirus B19 in cord blood of
premature infants. Am J Perinatol 2001, 18:237-240.
19. Inoue E, Yamanaka H, Hara M, Tomatsu T, Kamatani N: Compari-
son of Disease Activity Score (DAS)28- erythrocyte sedimen-
tation rate and DAS28- C-reactive protein threshold values.
Ann Rheum Dis 2007, 66:407-409.
20. Prevoo ML, van't Hof MA, Kuper HH, van Leeuwen MA, Putte LB
van de, van Riel PL: Modified disease activity scores that
include twenty-eight joint counts. Development and validation
in a prospective longitudinal study of patients with rheumatoid
arthritis. Arthritis Rheum 1995, 38:44-48.
21. Morozzi G, Fabbroni M, Bellisai F, Cucini S, Simpatico A, Galeazzi
M: Low serum level of COMP, a cartilage turnover marker, pre-
dicts rapid and high ACR70 response to adalimumab therapy
in rheumatoid arthritis. Clin Rheumatol 2007, 26:1335-1338.
22. Ortutay Z, Polgár A, Gömör B, Géher P, Lakatos T, Glant TT, Gay
RE, Gay S, Pállinger E, Farkas C, Farkas E, Tóthfalusi L, Kocsis K,
Falus A, Buzás EI: Synovial fluid exoglycosidases are predic-
tors of rheumatoid arthritis and are effective in cartilage gly-
cosaminoglycan depletion. Arthritis Rheum 2003,
48:2163-2172.
23. Edwards JC, Szczepanski L, Szechinski J, Filipowicz-Sosnowska
A, Emery P, Close DR, Stevens RM, Shaw T: Efficacy of B-cell-
targeted therapy with rituximab in patients with rheumatoid
arthritis. N Engl J Med 2004, 350:2572-2581.
24. Landsteiner K: Über Agglutinationserscheinungen normalen
menschlichen Blutes. Wien Klin Wochenschr 1901; 14: 1132–
1134 (Translation: On agglutination phenomena of normal
human blood). In Papers on Human Genetics Edited by: Boyer
SH. Englewood Cliffs, NJ: Prentice-Hall; 1963:1132-1134.
25. Adderson EE, Shikhman AR, Ward KE, Cunningham MW: Molec-
ular analysis of polyreactive monoclonal antibodies from rheu-
Arthritis Research & Therapy Vol 10 No 5 György et al.
Page 12 of 12
(page number not for citation purposes)
matic carditis: human anti-N-acetylglucosamine/anti-myosin
antibody V region genes. J Immunol 1998, 161:2020-2031.
26. Majeed M, McQueen F, Yeoman S, McLean L: Relationship
between serum hyaluronic acid level and disease activity in
early rheumatoid arthritis. Ann Rheum Dis 2004,
63:1166-1168.
27. Pothacharoen P, Teekachunhatean S, Louthrenoo W, Yingsung
W, Ong-Chai S, Hardingham T, Kongtawelert P: Raised chon-
droitin sulfate epitopes and hyaluronan in serum from rheu-
matoid arthritis and osteoarthritis patients. Osteoarthritis
Cartilage 2006, 14:299-301.
28. Landers CD, Chelvarajan RL, Bondada S: The role of B-cells and
accessory cells in the neonatal response to TI-2 antigens.
Immunol Res 2005, 31:25-36.
29. Zandvoort A, Timens W: The dual function of the splenic mar-
ginal zone: essential for initiation of anti-TI-2 responses but
also vital in the general first-line defense against blood-borne
antigens. Clin Exp Immunol 2002, 130:4-11.
30. Adderson EE: Antibody repertoires in infants and adults:
effects of T-independent and T-dependent immunizations.
Springer Semin Immunopathol 2001, 23:387-403.
31. Rijkers GT, Sanders EA, Breukels MA, Zegers BJ: Infant B-cell
responses to polysaccharide determinants. Vaccine 1998,
16:1396-1400.
32. Wang JY, Roehrl MH: Glycosaminoglycans are a potential
cause of rheumatoid arthritis. Proc Natl Acad Sci USA 2002,
99:14362-14367.
33. Nakiri Y, Minowa K, Suzuki J, Mitsuo A, Amano H, Morimoto S,
Tokano Y, Takasaki Y: Expression of CD22 on peripheral B-cells
in patients with rheumatoid arthritis: relation to CD5-positive
B-cells. Clin Rheumatol 2007, 26:1721-1723.
34. Montecino-Rodriguez E, Dorshkind K: New perspectives in B-1
B-cell development and function. Trends Immunol 2006,
27:428-433.
35. Parisi JT: Significance of chromogenic variants in studies of vir-
ulence factors of Staphylococcus aureus. J Bacteriol 1966,
92:589-591.
36. Starr CR, Engleberg NC:
Role of hyaluronidase in subcutane-
ous spread and growth of group A streptococcus. Infect
Immun 2006, 74:40-48.
37. Shimizu T, Ohtani K, Hirakawa H, Ohshima K, Yamashita A, Shiba
T, Ogasawara N, Hattori M, Kuhara S, Hayashi H: Complete
genome sequence of Clostridium perfringens, an anaerobic
flesh-eater. Proc Natl Acad Sci USA 2002, 99:996-1001.
38. Matthews BW: The structure of E. coli beta-galactosidase. C R
Biol 2005, 328:549-556.
39. Buzas EI, Gyorgy B, Pasztoi M, Jelinek I, Falus A, Gabius HJ: Car-
bohydrate recognition systems in autoimmunity. Autoimmunity
2006, 39:691-704.
40. Black S, Shinefield H, Eskola J, Whitney C: Pneumococcal Con-
jugate Vaccines. In Vaccines 5th edition. Edited by: Plotkin S,
Orenstein W, Offit P. Philadelphia: Elsevier; 2008.
41. Poletaev A, Osipenko L: General network of natural autoanti-
bodies as immunological homunculus (Immunculus). Autoim-
mun Rev 2003, 2:264-271.