Báo cáo y học: "Collagen-specific T-cell repertoire in blood and synovial fluid varies with disease activity in early rheumatoid arthritis" pot
Bạn đang xem bản rút gọn của tài liệu. Xem và tải ngay bản đầy đủ của tài liệu tại đây (653.9 KB, 18 trang )
Open Access
Available online />Page 1 of 18
(page number not for citation purposes)
Vol 10 No 6
Research article
Collagen-specific T-cell repertoire in blood and synovial fluid
varies with disease activity in early rheumatoid arthritis
Francesco Ria
1
, Romina Penitente
1,2
*, Maria De Santis
2
*, Chiara Nicolò
1
, Gabriele Di Sante
1
,
Massimiliano Orsini
3
, Dario Arzani
3
, Andrea Fattorossi
4
, Alessandra Battaglia
4
and
Gian Franco Ferraccioli
1
1
Institute of General Pathology, Catholic University, Largo F Vito, Rome, 00168, Italy
2
Department of Rheumatology, Catholic University, CIC, Via Moscati, Rome, 00168, Italy
3
Institute of Hygiene and Biostatistics, Catholic University, Largo F Vito, Rome, 00168, Italy
4
Department of Gynecology, Laboratory of Immunology, Catholic University, Largo F Vito, Rome, 00168, Italy
* Contributed equally
Corresponding author: Francesco Ria, Franco Ferraccioli,
Received: 12 May 2008 Revisions requested: 27 Jun 2008 Revisions received: 28 Oct 2008 Accepted: 17 Nov 2008 Published: 17 Nov 2008
Arthritis Research & Therapy 2008, 10:R135 (doi:10.1186/ar2553)
This article is online at: />© 2008 Ria et al.; licensee BioMed Central Ltd.
This is an open access article distributed under the terms of the Creative Commons Attribution License ( />),
which permits unrestricted use, distribution, and reproduction in any medium, provided the original work is properly cited.
Abstract
Introduction Type II collagen is a DR4/DR1 restricted target of
self-reactive T cells that sustain rheumatoid arthritis. The aim of
the present study was to analyze the T-cell receptor repertoire
at the onset of and at different phases in rheumatoid arthritis.
Methods We used the CDR3 BV-BJ spectratyping to study the
response to human collagen peptide 261–273 in 12 patients
with DR4
+
rheumatoid arthritis (six at the onset of disease and
six during the course of disease) and in five healthy DR4
+
relatives.
Results The collagen-specific T-cell repertoire is quite
restricted at the onset of disease, involving approximately 10
rearrangements. Within the studied collagen-specific
rearrangements, nearly 75% is shared among patients.
Although the size of the repertoire used by control individuals is
comparable to that of patients, it is characterized by different T-
cell receptors. Part of the antigen-specific T-cell repertoire is
spontaneously enriched in synovial fluid. The specific T-cell
repertoire in the periphery was modulated by therapy and
decreased with the remission of the disease. Failure of
immunoscopy to detect this repertoire was not due to
suppression of collagen-driven proliferation in vitro by CD4
+
CD25
+
T cells. Clinical relapse of the disease was associated
with the appearance of the original collagen-specific T cells.
Conclusions The collagen-specific T-cell receptor repertoire in
peripheral blood and synovial fluid is restricted to a limited
number of rearrangements in rheumatoid arthritis. The majority
of the repertoire is shared between patients with early
rheumatoid arthritis and it is modulated by therapy.
Introduction
Rheumatoid arthritis (RA) is an autoimmune chronic systemic
inflammatory disease that affects mainly the joints, resulting in
progressive functional impairment [1]. There is a general con-
sensus that self-reactive mechanisms are largely responsible
for the pathogenesis of RA. A large array of autoantibodies can
be detected in the serum of RA patients, which strengthens
the hypothesis that a loss of self-tolerance forms the basis of
the disease [2-4]. The autoantibody response to a highly con-
served protein, type II collagen, occurring during the first few
years of the disease clearly indicates that self-reactive B cells
are present [5-9]. On the other hand, the infiltration of T cells
in the synovial tissue and the demonstration that there is auto-
reactivity of T cells against type II collagen [10-13] suggest
that a cell-mediated immune response also plays a prominent
role in joint inflammation. The T-cell mediated self-reactivity
CDR3: third complementarity-determining region; CFSE: carboxyfluorescein diacetate succinimidyl ester; DAS: Disease Activity Score; HLA: human
leucocyte antigen; huCollp261–273: human collagen peptide 261–273; mAb: monoclonal antibody; PBMC: peripheral blood mononuclear cell;
PCR: polymerase chain reaction; RA: rheumatoid arthritis; RSI: rate stimulation index; TCR: T-cell receptor; TNF: tumour necrosis factor; Treg: regu-
latory T (cell).
Arthritis Research & Therapy Vol 10 No 6 Ria et al.
Page 2 of 18
(page number not for citation purposes)
against type II collagen is strongly linked to human leucocyte
antigen (HLA)-DR alleles DR4 and DR1 [14].
Type II collagen, a highly conserved sequestered antigen, has
been proposed to be one of the targets of the self-reactive T
cells that sustain RA. In experimental models, induction of col-
lagen-specific responsiveness results in a disease similar to
RA [15,16]. T cells that are specific to human collagen peptide
263–270 were observed to arise in several models of RA
involving mice transgenic for human DR molecules [14,17].
Given this background, T cells specific for this epitope should
be detectable in early RA [11]. However, clear and direct evi-
dence of the presence of collagen-specific T cells in the joints
of RA patients in the early phases of the disease has not been
reported [11]. In this respect, third complementarity-determin-
ing region (CDR3)- typing of T cells infiltrating the joints has
been used, aiming to identify clones that are specifically
enriched in the inflamed synovia. Some CDR3- regions have
been reported to accumulate in the joints during disease [18-
20], and a study revealed that some of these were shared
among several patients [21].
In the present study, we used the CDR3 BV-BJ (variable and
joining beta chain) spectratyping to study the response to
human collagen peptide 261–273 (huCollp261–273) in
patients with early RA. We first identified T-cell receptor
(TCR)- rearrangements belonging to cells that proliferate in a
peptide-dependent manner in the peripheral blood of one
patient, at the onset of RA. The presence of the same TCR
rearrangements was thereafter examined in five consecutive
patients with early RA. We then looked for the enrichment of T
cells with these TCRs in the synovial fluid at the same time
point in the disease course. Finally, we monitored these spe-
cific TCRs in the peripheral blood during various phases of the
disease during therapy.
We found that the huCollp261–273-specific TCR repertoire
of the index patient at the onset of the disease was limited to
few rearrangements, and part of this antigen-specific reper-
toire was spontaneously enriched in the synovial fluid of the
patient during the acute phase of the disease. We found the
majority of the repertoire to be shared among patients with
early RA, whereas healthy control individuals exhibited a dis-
tinct set of public (shared among different individuals) TCRs.
The presence of collagen-specific T cells in the peripheral
blood was modulated by therapy, and remission of the disease
was associated with a decrease in the collagen-specific TCR
repertoire, whereas relapses of the disease were accompa-
nied by reappearance of the same T-cell repertoire detected at
the onset.
Materials and methods
Patients
The demographic and clinical characteristics of six patients
with RA who were analyzed at the onset of the disease, six
patients with longstanding RA and receiving treatment, and
five healthy relatives (all DRB1 04 positive) are summarized in
Tables 1 and 2. All of the patients satisfied the American Col-
lege of Rheumatology criteria for RA [22]. We decided to
study healthy relatives in order to identify DR1 matched
healthy control individuals. Active disease or relapse were
defined, respectively, by a Disease Activity Score (DAS) was
above 3.7 or increased to above 3.7 [23]. The patients began
treatment with methotrexate 20 mg/week; etanercept 25 mg
twice a week was added after 3 months in order to achieve
remission when high disease activity was still present. Patients
and control individuals were characterized with respect to the
HLA-DR haplotype by PCR using sequence-specific oligonu-
cleotides, using the Inno-LiPA HLA-DRB1 Amp Plus kit (Inno-
genetics N.V., Ghent, Belgium), in accordance with the
manufacturer's instructions. The test can yield ambiguous find-
ings in some cases that result in more than one possible com-
bination of HLA-DRB1 alleles. Patients were entered into our
cohort only if all of the combinations included at least one
DRB1 04 allele.
Informed written consent was obtained from all patients. The
research is in compliance with the Helsinki Declaration. The
research was approved by the local ethics committee.
Index case
Patient OE, a 50-year-old woman, had symmetrical involve-
ment of the large and small joints that had lasted for 12 weeks;
she was positive for rheumatoid factor and anti-cyclic citrulli-
nated peptide antibodies. No bone erosions were present on
radiography. The patient satisfied the American College of
Rheumatology criteria for RA [22]. Her DAS was 6.69. Her
Table 1
Characteristics of six RA patients at the onset of disease
Characteristic Details
Sex All female
Age (years [mean ± SD]) 47.7 ± 13.2
Disease duration (weeks [mean ± SD]) 8.0 ± 0.2
Bone erosion (% of patients) 50%
RF IgM (% of patients) 66.7%
RF IgA (% of patients) 16.7%
Anti-CCP (% of patients) 83.3%
DAS (mean ± SD) 6.1 ± 0.6
Each of the patients satisfied the American College of Rheumatology
criteria for RA. CCP, cyclic citrullinated peptide; DAS, Disease
Activity Scale; RA, rheumatoid arthritis; RF, rheumatoid factor; SD,
standard deviation.
Available online />Page 3 of 18
(page number not for citation purposes)
HLA haplotype was A31, A68; B35, B38; CW04, CW12; and
DRB1*04, DRB1*11.
The patient gave her informed consent, allowing us to obtain
blood and synovial fluid samples, and she received specific
therapy and modification to her therapy over time. Samples for
immunoscopy analysis (peripheral blood and synovial fluid)
were collected before therapy. The patient started methotrex-
ate 20 mg/week and methylprednisolone 0.25 mg/kg/day at 8
a.m. Because no improvement was observed, etanercept 25
mg twice a week was added after 3 months. After 3 more
months the patient exhibited a good response and achieved
partial remission (DAS > 1.6 and < 2.4) [23]. Therefore, meth-
ylprednisolone was stopped. The patient was maintained with
methotrexate and etanecept thereafter, and although her con-
ditions initially worsen (DAS increased to 5.03), at later time
points she showed improvement. A second blood sample was
drawn for immunoscopy analysis at week 60 after diagnosis
(DAS 3.5). Clinical evaluation was performed 3 months later,
and a third blood sample was drawn for immunoscopy analysis
at this time point (DAS 3.2). Clinical evaluation was again per-
formed 3 months later, and a fourth blood sample was drawn
for immunoscopy analysis also at this time point (DAS 6). Clin-
ical and serological data are reported in Table 1.
huCollp261–273-specific T-cell proliferation
Peripheral blood mononuclear cells (PBMCs) were purified
with Percoll gradient and seeded in 96-well plates (Costar
Corp., Cambridge, MA, USA) at 5 × 10
5
cells/well in the pres-
ence of graded concentrations of human collagen peptides
250–264, 261–273 and 289–303. Culture medium was
RPMI 1640 (Gibco BRL Life Technologies, Basel, Switzer-
land), supplemented with 2 mmol/l L-glutamine, 50 mol/l 2-
ME (mercaptoethanol), 50 g/ml gentamicin (Sigma-Aldrich,
St Louis, MO, USA), and 1% human AB serum. Seventy-two
hours later, antigen-specific T-cell proliferation was assessed
by [
3
H]-thymidine incorporation.
TCR repertoire analysis
Repertoire analysis was performed using a protocol described
previously [24] but with modification. Briefly, PBMCs were cul-
tured in the presence or absence of 20 g/ml peptide for 3
days in RPMI-1640 medium (Sigma-Aldrich), supplemented
as described above. The effect of the 3 days of culture on
apoptosis of T cells was measured in a preliminary experiment
by labelling cultured cells with anti-CD3-PC5 and anti-annexin
V-FITC monoclonal antibodies. The percentage of apoptotic
cells, evaluated by FACScan flow cytometer (Becton Dickin-
son) as annexin V
+
CD3
+
cells, was 20.4% in the sample
obtained after Percoll separation, 23.2% for cells cultured in
the absence of peptide antigen, and 29.3% for cells cultured
in the presence of the antigen. Total RNA was isolated from
cell suspensions using RNeasy Mini Kit (Qiagen GmbH,
Hilden, Germany), in accordance with the manufacturer's
instruction. cDNA was synthesized using an oligo-dT primer
(dT15; Gibco BRL Life Technologies). From each cDNA, PCR
reactions were then performed. Sequences of BV-, C- and
BJ-specific primers were deduced from the IMGT (ImMuno-
GeneTics) database, following the nomenclature of Currier
and coworkers [25], and are summarized in Table 3.
Using 2 of this product as a template, run-off reactions were
performed with a single internal fluorescent primer for each BJ
tested. These products were then denatured in formamide and
analyzed on an Applied Biosystem 3100 Prism using Gene-
scan 2.0 software (Applied Biosystems, Foster City, CA,
USA). Results are also reported as RSI (rate stimulation index
= normalized peak area obtained from cells stimulated with
antigen/normalized peak area of nonstimulated cells).
Separation and immunoscopy analysis of CD45RA
+
and
CD45RA
-
T cells
To examine the expression of the CD45RA activation marker
on T cells carrying the TCR rearrangements identified by TCR
repertoire analysis, PBMCs from patient RE (who had been off
therapy for 1 year) obtained during acute RA, were depleted
of CD19
+
cells by magnetic MACS™ sorting (Miltenyi Biotec,
Auburn, CA, USA), which was performed in accordance with
the manufacturer's instructions. CD19-negatively sorted cells
were enriched in CD45RA
+
and CD45RA
-
cells by labelling
them with an anti-CD45RA MACS™ beads, in accordance
with the manufacturer's instructions. Enrichment for CD45RA
and CD45RO was checked using a FACScan flow cytometer
(Becton Dickinson). At least 5,000 cells of interest were
acquired for each sample. A total of 2.5 × 10
6
CD45RA posi-
tively and negatively selected cells were co-cultured in vitro
with 2 × 10
5
CD19
+
B cells as antigen-presenting cells, in the
presence of 20 g/ml collagen peptide. As a reference for the
presence of antigen-driven expansions, 3.2 × 10
6
CD19-neg-
atively selected cells were co-cultured in vitro with 2 × 10
5
Table 2
Characteristics of six RA patients with longstanding disease
Characteristic Details
Sex 66.6% female
Age (years [mean ± SD]) 56.8 ± 11.2
Disease duration (months [mean ± SD]) 6.4 ± 3.0
Bone erosion (% of patients) 100%
RF IgM (% of patients) 50%
RF IgA (% of patients) 50%
Anti-CCP (% of patients) 100%
Remission according to DAS (% of patients) 50%
Each of the patients satisfied the American College of Rheumatology
criteria for RA. CCP, cyclic citrullinated peptide; DAS, Disease
Activity Scale; RA, rheumatoid arthritis; RF, rheumatoid factor; SD,
standard deviation.
Arthritis Research & Therapy Vol 10 No 6 Ria et al.
Page 4 of 18
(page number not for citation purposes)
CD19
+
cells, in the absence or presence of 20 g/ml collagen
peptide. Immunoscopy analysis for TCR cells in each sample
was performed as described above.
CDR3 sequencing
cDNAs were obtained from antigen-stimulated PBMCs or
from cells obtained from the synovial fluid, as described above.
Of each sample, 2 were submitted to an initial PCR, using
the mentioned above with BV-specific forward primers and the
common C-specific reverse primer. A second nested PCR
was then performed using 2 of the product of the former
reaction as a template, with the same BV-specific primer and
BJ-specific reverse primers. PCR fragments were then cloned
using TOPO TA Cloning
®
kit (Invitrogen, Carlsbad, CA, USA),
in accordance with the manufacturer's instructions. Trans-
formed Escherichia coli were grown in 5 ml LB medium sup-
plemented with ampicillin, and plasmids were purified by
Qiaprep Miniprep columns (Qiagen GmbH) and checked for
the presence of the expected inserts by PCR amplification
using BV-BJ paired primers. Samples that scored positive for
the insert were sequenced using an M13 forward primer. DNA
sequence was translated into protein sequence through the
ExPASy Proteomics Server [26].
CD4
+
CD25
+
cell depletion
Lymphocytes from peripheral blood were obtained as mono-
nuclear cells by standard density gradient centrifugation of
heparinized blood, as described previously [27]. All steps
were performed in sterile phosphate-buffered saline contain-
ing 0.1% bovine serum albumin. Cell suspension was washed
twice in cold phosphate-buffered saline-bovine serum albu-
min, resuspended at 10
6
cells/ml and used for subsequent
studies. Because regulatory T (Treg) cells belong to this pop-
ulation, we investigated T-cell-specific proliferation in the pres-
ence and after depletion of the CD4
+
CD25
+
subset.
Immunostaining
Optimal mAb concentrations were routinely determined for
each mAb by titration. We used FITC-conjugated mAb to CD4
from Becton Dickinson Biosciences (San Jose, CA) and PE-
conjugated mAb to CD25 from Miltenyi (Miltenyi Biotec,
Auburn, CA, USA). Because there are no objective criteria by
which to set the boundary between brightly and dimly stained
CD25
+
cells (CD25
high
and CD25
int
, respectively), all flow
cytometric analyses were reviewed by one investigator (AB)
who was blind to sample identity. Cells were measured by flu-
orescence-activated cell sorting immediately after staining
using forward and side scatter signals to establish the lym-
phocyte gate and exclude unwanted material (nonviable cells,
debris and cell clumps) from cell evaluation. Fluorescence sig-
nals were collected in log mode. A minimum of 5,000 cells of
interest were acquired for each sample.
Table 3
BV-, C- and BJ-specific primers
PRIMER SEQUENCE
CB1A GGGTGTGGGAGATCCTGC
BV1 CCGCACAACAGTTCCCTGACTTGC
BV3 CGCTTCTCCCTGATTCTGGAGTCC
BV4 TTCCCATCAGCCGCCCAAACCTAA
BV5 GATCAAAACGAGAGGACAGC
BV6A GATCCAATTTCAGGTCATACTG
BV6B1 CAGGGCCAGAGTTTCTGAC
BV6B2 CAGGGCTCAGAGGTTCTGAC
BV7 CCTGAATGCCCCAACAGCTCT
BV8 GGTACAGACAGACCATGATGC
BV9 TTCCCTGGAGCTTGGTGACTCTGC
BV10 CCACGGAGTCAGGGGACACAGCAC
BV11 GTCAACAGTCTCCAGAATAAGG
BV12 TCCYCCTCACTCTGGAGTC
BV13A GGTATCGACAAGACCCAGGCA
BV13B AGGCTCATCCATTATTCAAATAC
BV14 GGGCTGGGCTTAAGGCAGATCTAC
BV15 CAGGCACAGGCTAAATTCTCCCTG
BV16 GCCTGCAGAACTGGAGGATTCTGG
BV17 TCCTCTCACTGTGACATCGGCCCA
BV18 CTGCTGAATTTCCCAAAGAGGGCC
BV19 TCCTCTCACTGTGACATCGGCCCA
BV20 TGCCCCAGAATCTCTCAGCCTCCA
BV21 GGAGTAGACTCCACTCTCAAG
BV22 GATCCGGTCCACAAAGCTGG
BV23 ATTCTGAACTGAACATGAGCTCCT
BV24 GACATCCGCTCACCAGGCCTG
BJ1.1 TCTGGTGCCTTGTCCAAAGAAAGC
BJ1.2 CCTGTCCCCGAACCGAAGGTGTA
BJ1.3 CCAACTTCCCTCTCCAAAATATAT
BJ1.4 CTGGGTTCCACTGCCAAAAAACAG
BJ1.5 TCGAGTCCCATCACCAAAATGCTG
BJ1.6 CCTGGTCCCATTCCCAAAGTGGAG
BJ2.1 CCGTGTCCCTGGCCCGAAGAACTG
BJ2.2 CTAGAGCCTTCTCCAAAAAACAGC
BJ2.3 GGGTGCCTGGGCCAAAATACTGCG
BJ2.4 GGGTCCCGGCGCCGAAGTACTGAA
BJ2.5 CGCGTGCCTGGCCCGAAGTACTGG
BJ2.6 GCTGCCGGCCCCGAAAGTCAGGAC
BJ2.7 TGGTGCCCGGCCCGAAGTACTGCT
Available online />Page 5 of 18
(page number not for citation purposes)
Proliferation assay
As a measure of the inhibitory capacity of Treg cells contained
in each sample, we measured the effect of CD4
+
CD25
+
depletion on the proliferative response of autologous T cells.
The data were confirmed by adding back an excess of purified
CD4
+
CD25
+
T cells to autologous T cells. Thus, circulating
mononuclear cells were depleted immunomagnetically of
CD25
high
cells by microbeads directly coated with anti-CD25
mAb (Miltenyi Biotec GmbH, Friedrich-Ebert-Strasse 68 Ber-
gisch Gladbach D- 51429, Germany). The amount of anti-
CD25 was adjusted to target CD25
high
cells preferentially, fol-
lowing a procedure that is standard in our laboratory. Concom-
itantly, the same mononuclear cell preparation was used to
purify putative Treg cells. To this end, CD4
+
lymphocytes were
first obtained as untouched cells by negative selection using
the CD4
+
T cell Isolation Kit from Miltenyi, which contains
CD8, CD11b, CD16, CD56, CD19 and CD36 mAbs, and
microbeads directly coated with anti-CD25 mAb (Miltenyi)
were then used to separate CD25
high
cells, as described
above. All other steps were performed following the manufac-
turer's instructions.
Depletion and purity were assessed by flow cytometry and
found consistently to exceed 95% and 70% in CD4
+
CD25
+
(containing also Treg) depleted and Treg enriched prepara-
tions, respectively. The response of T cells to polyclonal acti-
vation was assessed using the intracellular covalent coupling
dye carboxyfluorescein diacetate succinimidyl ester (CFSE,
also referred to as CFDA-SE; Molecular Probes, Eugene, OR,
USA) and TCR crosslinking as stimulus. The staining proce-
dure was essentially as described previously [28]. Briefly,
responder cells were aseptically loaded with 0.2 mol/l CFSE,
resuspended in RPMI 10% foetal bovine serum, and seeded
(50,000 cells/well) in replicate wells in a standard 96-well cul-
ture plate for 5 days in the presence of plate-bound anti-CD3.
Treg cells were added to autologous mononuclear cell prepa-
ration at a 1:1 responder/suppressor ratio. The proliferative
response of T cells (hereafter referred to as 'proliferation
index') can be quantified by ModFit™/Cell Proliferation Model™
software (Sigma, St Louis, MO, USA).
Results
Peripheral blood mononuclear cells that proliferate in
response to huCollp261–273 exhibit a limited TCR usage
at disease onset
We measured the proliferation of PBMCs obtained from a
patient at the onset of RA, in response to graded amounts of
peptides huCollp250–264, huCollp261–273 and
huCollp289–303. According to the literature, a small but spe-
cific proliferation has been observed only in response to the
peptide huCollp261–273.
Therefore, PBMCs from the same blood sample stimulated
with this peptide were used for immunoscopy analysis. In our
analysis we studied a total of 288 spectra (encompassing
approximately 85% of total BV-BJ rearrangements), each
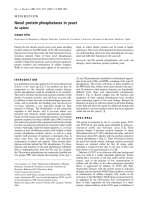
exhibiting 8 to 10 peaks. Each CDR3- profile can be
depicted as a function of the CDR3 length. Each peak repre-
sents three-base difference in the product of rearrangement,
corresponding to one amino acid residue. According to immu-
noscopy analyses of other antigen-specific immune responses
[29-32], after in vitro co-culture with huCollp261–273, BV-BJ
CDR3-length fragment analysis of response to huCollp261–
273 yields three distinct types of distribution of BV-BJ frag-
ment length, as shown in Figure 1a. The great majority of rear-
rangements maintain the Gaussian distribution that is
observed in the control (cultured in the absence of added pep-
tide) sample, as for instances the reported BV19-BJ2.2. Such
Gaussian distribution is perturbed in a second group of rear-
rangements, although not in an antigen-dependent manner
(see, for instance, the spectra obtained for BV13a-BJ2.1; Fig-
ure 1a). In this case, the RSI of a candidate peak in the anti-
gen-stimulated sample is usually below 1.5. In a third group of
rearrangements (exemplified by rearrangement BV16-BJ2.5 in
Figure 1a), however, the RSI between control and antigen-
stimulated sample is 2 or greater.
According to our previous observations and to observations in
the patients with early RA detailed in the following paragraph,
perturbation of the Gaussian above this value identifies the
group of T cells that depend on the presence of the specific
peptide antigen to expand during in vitro culture, because the
same perturbation is not elicited by stimulation with other anti-
gen determinants [30-32]. As detailed in the Materials and
methods section (above), selective spread of apoptotic cell
death after antigen stimulation should contribute poorly to
expansion of the few TCR rearrangements detected in these
experimental conditions, because the number of annexin V
positive T cells is similar between antigen-stimulated and con-
trol samples. Overall, this group of TCR rearrangements,
which possibly associates with proliferating collagen-specific
T cells, includes approximately 2% of total spectra examined.
The complete analysis of CDR3 length distribution is shown in
Figure 1b. In addition to one expansion with an RSI of 2.5 (99
bases in length), rearrangement BV19-BJ2.5 exhibited expan-
sion of two rearrangements with an RSI of 1.8 (96 and 105
bases in length). Spectra obtained for rearrangements BV11-
BJ2.2 (135 and 138 bases) and BV16-BJ2.5 (83 and 86
bases) revealed the presence of two antigen-dependent
expansions each. Collectively, a small number of rearrange-
ments was found to expand with RSI of 2 or greater in an anti-
gen-driven manner. Although we could not detect any obvious
bias in BV usage, it appears that most cells expanding after
antigen stimulation bear CDR3- regions obtained through
rearrangement of segments of the BJ2 family. This observation
may imply that residues encoded by the BD2 gene segment
play a role in the recognition of huCollp261–273.
Arthritis Research & Therapy Vol 10 No 6 Ria et al.
Page 6 of 18
(page number not for citation purposes)
The repertoire detected by BV-BJ spectratyping in the
patient comprises TCR rearrangements that are shared
among DR4
+
patients with early RA and is specifically
expanded by huCollp261–273
We collected PBMCs from five more patients at the onset of
RA. We examined whether these patients also used any of the
antigen-dependent rearrangements identified in the previous
patients, at the onset or during the course of the disease. The
results of our analysis are reported in Table 4, and show that a
relatively large portion of the TCR repertoire used by the ini-
tially evaluated patients is also used by the other patients, thus
representing a shared repertoire specific for huCollp261–
273. Some of the shared rearrangements were used by more
than one patient already at the onset of disease (such as
BV11-BJ2.2 of 135 or 138 bases, BV13-BJ2.3 of 199 bases,
or BV16-BJ2.5 of 83 or 89 bases). Others can be used at the
onset or appear later during the disease course (for example,
BV1-BJ2.6 of 134 bases, BV6b2-BJ2.6 of 215 or 218 bases,
and BV16-BJ1.6 of 83 or 86 bases). However, a private rep-
ertoire for each patient is also available.
PBMCs from some of the patients studied also exhibited a
small degree of proliferation after stimulation with the sub-
dominant epitope huCollp289–303. In these patients, overall
we identified 26 rearrangements expanded by stimulation with
huCollp261–273 but not with huCollp289–303. Twenty-one
rearrangements were expanded by huCollp289–303 but not
by huCollp261–273. Only eight rearrangements were
expanded by both peptides. At present we cannot distinguish
whether cells carrying these rearrangements are heterocliti-
cally activated by both epitopes or whether they expand as
non-antigen-specific bystanders. These data confirm our
observations in experimental models showing that BV-BJ
spectratyping identifies, to a large extent, TCRs carried by
antigen-specific T cells [30,31], as anticipated in the above
paragraph.
PBMCs of DR4
+
healthy individuals exhibit a shared TCR
repertoire specific for huCollp261–273 distinct from the
one used by patients with early RA
We used the same approach to examine the huCollp261–
273-specific repertoire in five healthy DR4
+
relatives of RA
Figure 1
TCR repertoire usage in the immune response to huCollp263–271TCR repertoire usage in the immune response to huCollp263–271. PBMCs from patient OE were prepared as described in the Materials and meth-
ods section and cultured at 5 × 10
6
cells/ml in the presence or absence of 20 g/ml huCollp263–271. Three days later cells were harvested and
modified CDR3 -chain spectratyping was performed, as described in Materials and methods. (a) Exemplificative BV-BJ CDR3 length spectra of T
cells obtained for three rearrangements, in the absence and in the presence of antigenic peptide. The peaks interrupting the Gaussian distribution of
CDR3 length (in an antigen-dependent or antigen-independent manner) are shaded in grey, and the RISs are shown. (b) Complete immunoscopy
analysis of the immune response to huCollp263–271. Black squares indicate BV-BJ rearrangements, showing antigen-driven expansion (RSI 2) of
one or more peaks. Rearrangement BV19-BJ2.5 exhibited an antigen-driven expansion of a peak of 99 bbases in length. In addition, expansion of
two peaks of 96 and 105 bases in length was observed, with RSI 1.8. huCollp261–273, human collagen peptide 261–273; PBMC, peripheral
blood mononuclear cell; RSI, rate stimulation index.
Available online />Page 7 of 18
(page number not for citation purposes)
Table 4
BV-BJ CDR3 rearrangements expanded after huCollp261–273 stimulation in ERA (early rheumatoid arthritis) patients at onset and
during follow up in peripheral blood and in synovial fluid
Patient OE Patient
FA
Patient
AV
Patient VR Patient ST Patient MS
Onset Onset
Syn
c
Follow
up 1
Follow
up 2
Follow
up 3
Onset Onset Onset Onset
syn
c
Follow
up 1
Follow
up 2
Onset Onset
syn
c
Follow
up
Onset Follow
up 1
Follow
up 2
DAS 6.7 3.5 3.2 6 5.2 2.6 3.7 6.2 1.6 6.2 1.6 1.6
BV-BJ
1–2.6
a
134 ++ + + + + +
125 + +
Private
b
131
6b2-2.6
a
209 + +
215 + +
218 ++
Private
b
203
7-1.6 127 127 127 138
11-2.2
a
135 + ++
138 + + + + + + + +
Private
b
131 131
13b-2.3
a
199 + ++ +++ +
193 +++
201 ++
Private
b
190 196
19-2.5 99
105
16-1.6
a
83 +++++
86 +++
Private
b
92 89 89
Arthritis Research & Therapy Vol 10 No 6 Ria et al.
Page 8 of 18
(page number not for citation purposes)
patients. The results of this analysis are detailed in Table 5 and
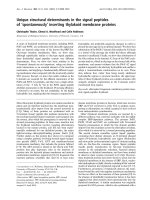
are summarized in Figure 2. All tested control samples exhib-
ited the presence of TCR expanding in response to stimulation
of PBMCs with huCollp261–273. As shown in Figure 2, the
total number of T cells expanding was no different among con-
trol individuals and RA patients (Figure 2a, open bars; P =
0.2). Usage of the previously defined 'shared' T-cell repertoire
appears more frequent in RA patients versus control individu-
als (Figure 2a, dashed bars; P = 0.03). Consequently, the con-
tributions of the shared TCRs to the total response exhibit
clear differences between patients and control individuals
(Figure 2b; P = 0.004). Patients with RA exhibit a ratio
between the numbers of shared rearrangements to that of total
rearrangements expanding of 0.5 or greater (and in most
cases > 0.7); conversely, healthy control individuals have a
value of 0.3 or less (in most cases < 0.2) for this ratio.
Some of the studied TCR rearrangements specific for
huCollp263–271, such as 1–2,6 (137 bases), 16b2-2,6 (212
bases) and 19-2,5 (101 bases), were shared among healthy
control individuals but were not detected in RA patients. This
observation suggests that T-cell repertoires of patients and
healthy individuals are distinct, despite being specific for the
same self-epitope.
A small portion of the collagen-specific repertoire
spontaneously accumulates in inflammatory synovial
fluid
We examined whether any of the TCR CDR3- regions carried
by T cells proliferating in response to huCollp261–273 were
enriched spontaneously in synovial fluid during the acute dis-
ease. We collected synovial fluid from three patient (OE, VR
and ST) and isolated cells after centrifugation. mRNA and
cDNA were prepared from these cells, without prior antigen
stimulation, as described in the Materials and methods section
(above). Finally, we conducted the immunoscopy analysis for
the nine BV-BJ rearrangements that had exhibited alteration in
Gaussian distribution associated with huCollp261–273-spe-
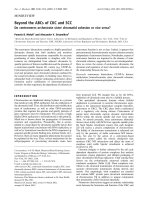
cific proliferation. The results are reported in Figure 3 and
Table 4. Figure 3 presents data from patient OE. We observed
that two spectra (namely BV1-BJ2.6 and BV7-BJ1.6) obtained
from analysis of cells of the inflammatory synovial fluid exhib-
ited spontaneous expansion of the same peaks (134 and 127
bases, respectively) that expanded in PBMCs after antigen
stimulation. On the contrary, all of the other spectra behaved
as was shown for BV13-BJ2.3, in which the spectrum
obtained from the synovial fluid sample overlaps with that
obtained from the unstimulated PBMCs.
To confirm that the BV1-BJ2.6 (134 bases) TCR detected in
the synovia was derived from the same T cells that expand in
response to huCollp261–273, we cloned and sequenced this
rearrangement from huCollp261–273-stimulated PBMCs and
from synovial cells. The results (Figure 3b) indicate that one
CDR3 sequence (CASS DTGS SGAN) was obtained from
both samples, in multiple copies. This CDR3 exhibits the
expected length for the huCollp261–273-specific CDR3. Vice
versa, large variability in CDR3 sequences was observed
among shorter or longer CDR3s between the two samples.
These data suggest that CASS DTGS SGAN may be a
sequence characterizing this huCollp261–273-specific
CDR3- region.
In Table 4 we show that only a fraction of the collagen-specific
TCRs detected in the blood appeared enriched spontaneously
in synovial fluid in all tested samples. Although four out of five
rearrangements detected belong to the group of the shared
rearrangements, T cells enriched in the synovial fluid were dif-
ferent in each patient.
16-2.5
a
83 ++
89 + ++
95 ++
Private
b
77 87 80 97 97
11 201423424741410 55
a
The base length of each TCR rearrangement that is shared by two or more RA patients is listed in the first column, and its presence in PBMCs is
indicated by '+'.
b
TCR rearrangements that belong to private repertoires are indicated by the base length for each patient.
c
Presence of an
enrichment of the indicated rearrangement in T cells obtained from synovial fluid at onset of ERA. +, huColl261–273-driven detection of the
indicated rearrangement; huCollp261–273, human collagen peptide 261–273; PBMC, peripheral blood mononuclear cell; RA, rheumatoid
arthritis; TCR, T-cell receptor.
Table 4 (Continued)
BV-BJ CDR3 rearrangements expanded after huCollp261–273 stimulation in ERA (early rheumatoid arthritis) patients at onset and
during follow up in peripheral blood and in synovial fluid
Available online />Page 9 of 18
(page number not for citation purposes)
huCollp261–273-specific repertoire is downmodulated in
peripheral blood during the moderate disease activity/
remission of disease induced by therapy
The antigen-driven expansion of huCollp261–273-specific
rearrangements was examined in four patients (OE, VR, ST
and MS) after a consistent improvement in disease activity had
been achieved. The data are presented in Table 4.
A downregulation of the repertoire responsive to huCollp261–
273, detected at the onset of the disease, generally occurred
in most RA patients after clinical remission. In some cases, ele-
vated levels of new specific TCRs were also observed (Table
4).
The behaviour of T cells carrying the rearrangement BV11-
BJ2.2 of 138 bases in length (hereafter referred to as BV11
+
cells) is particularly noteworthy. The presence of huCollp261–
273-specific T cells carrying this rearrangement was detected
in three out of the six patients with early RA. After disease
remission, BV11
+
cells were no longer detected. They were
again detected in two patients, OE and MS, when disease
activity was still low. Intriguingly, a clinical relapse of the dis-
ease was observed at the following clinical control 3 and 1
months later, respectively. Also, the third patient, VR, once
again exhibited usage of this rearrangement in coincidence
with disease relapse. These observations suggest that BV11
+
T cells are related to disease activity. We therefore examined
the presence of BV11
+
T cells in six more DR4
+
RA patients
during stable remission (three patients) or activity (three
patients) of the disease (Table 6). BV11
+
T cells were
detected in two out of the three samples taken during acute
bouts of RA, and in none of the patients during remission.
It is possible to detect BV11
+
cells in PBMCs before disease
relapse. However, acute relapse of disease is also associated
with detection in the PBMCs of the same cells that were spon-
taneously enriched in the synovial fluid at the onset (Table 4).
Taken together, these observations further strengthen the
hypothesis that the identified rearrangements belong to dis-
ease-related TCRs. In addition, they suggest that improving
the disease by treatment is mirrored by modulation of the abil-
ity of T cells to respond to collagen peptides.
CDR3- of BV11-BJ2.2 of 138 bases and BV13-BJ2.3 of
199 bases present overlapping motifs in their sequences
among different patients
In both human and experimental models, shared TCR- chains
display similar CDR3 sequences. To test the hypothesis that
at least the two most frequent TCR rearrangements specific
for huCollp261–273 are actually shared among early RA
patients, we sequenced the BV11-BJ2.2 chains from
huCollp261-stimulated cells of patients OE, VR, MS and BC
at the time of clinical relapse, and the BV13-BJ2.3 chains from
huCollp261–273-stimulated cells of patients OE, VR, ST and
Figure 2
Ratio between shared and total TCR- chains specific for huCollp263–271 discriminates RA patients from controlsRatio between shared and total TCR- chains specific for huCollp263–
271 discriminates RA patients from controls. (a) Average plus SD of
the number of total (open bars) or shared (grey bars) TCR- chains
specific for huCollp263–271 in PBMCs of patients with early RA and
control DR4
+
individuals. PBMCs from patients and control individuals
were prepared as described in the Materials and methods section and
cultured at 5 × 10
6
cells/ml in the presence or absence of 20 g/ml
huCollp263–271. Three days later, cells were harvested and modified
CDR3 -chain spectratyping for the rearrangements listed in Tables 3
and 4 was performed, as described in the Materials and methods sec-
tion. (b) Average plus SD of the ratio between shared and total TCR-
chains specific for huCollp263–271 in PBMCs of patients with early
RA and control DR4
+
individuals. Individual data are reported in the
insert, in which the linear regression between total (x-axis) and shared
(y-axis) TCR- chains is shown for patients with early RA (circles) and
control DR4
+
individuals (triangles). huCollp261–273, human collagen
peptide 261–273; PBMC, peripheral blood mononuclear cell; RA,
rheumatoid arthritis; SD, standard deviation; TCR, T-cell receptor.
Arthritis Research & Therapy Vol 10 No 6 Ria et al.
Page 10 of 18
(page number not for citation purposes)
MS at the onset of disease. Sequences obtained for BV11-
BJ2.2 of 138 bases and BV13-BJ2.3 of 199 bases are
reported in Table 7.
We sequenced 87 BV11-BJ2.2 chains (18 from patient OE,
23 from VR, 26 from MS and 20 from BC). As shown in Table
7, each sample displayed multiple sequences of the expected
138-base length of one (VR) or both (OE, MS and BC)
sequences C A S R G Q P N T G E L and C A S S E P
S
R
F
N
Y
T G E L.
The corresponding cDNA sequences were equal among all of
the patients for the C A S R G Q P N T G E L motif. Despite
the fact that often the same amino acid residue within a public
CDR3 sequence is encoded by distinct triplets, others have
reported that common TCR- chains found in the synovia of
two RA patients were encoded by the same nucleotide
sequence [21]. In our case, PCR amplifications and cloning
for sequencing for each patient were performed in distinct
experiments over several months, and by different operators,
and this procedure should have minimized the possibility that
contamination occurred.
A few differences were found in cDNAs encoding the C A S S
E P
S
R
F
N
Y
T G E L motif, which accounted for the resulting dif-
ferences in the amino acid sequences. The final tract of the
germline sequence for BV11 is TGTGCCAGCAGTGAATA
and the first 15 nucleotides of this stretch encode the amino
acid sequence CASSE. In two of our samples (OE and BC)
the germline T was also maintained, whereas it appeared to be
deleted and substituted during the V-DJ rearrangement in both
VR and MS. The frequency of CASSE in the BV11-JB2.2 rear-
Table 5
BV-BJ CDR3 rearrangements expanded after huCollp261–273 stimulation in healthy control DR4
+
relatives of RA patients
BV-BJ
a
MF (VR)
b
04–13
04–14
SR (ST)
b
04–04
01–04
ML (MS)
b
04–07
BI (BC)
b, c
04–04
01–04
04–09
GG (BC)
b, c
04–08
1–2.6
a
125,134
other
137
d
128, 131, 137
d
6b2-2.6
a
209, 215, 218 215
other
212
(d)
212
d
212
d
7-1.6 142 127 139
11-2.2
a
135, 138
135, 138
other 141 132 129
13b-2.3
a
193, 199, 201 193
other 196
19-2.5
101
d
95 104, 110
e
101
d
, 110
e
16-1.6
a
83 83, 86
83, 86
other 89, 101 92
16-2.5
a
83, 89 83
other 77, 93
e
, 96
93
e
Ratio: RA shared TCRs/total specific TCRs 0/2 0/4 2/6 2/12 4/11
a
BV-BJ rearrangements that are shared among RA patients are in bold.
b
Initials of the name of the relative of the RA patient is given in brackets.
Beneath each patient's initial the HLA DRB1 allele combination(s) are given, as established by PCR using sequence-specific oligonucleotides
(see Materials and methods).
c
BI and GG are both related to BC (see Table 6) and are third-degree relatives of each other.
d
huCollp261–273
specific TCR- rearrangements shared among healthy individuals.
e
huCollp261–273 specific TCR- rearrangements shared only by the two
related individuals BI and GG. huCollp261–273, human collagen peptide 261–273; RA, rheumatoid arthritis; TCR, T-cell receptor.
Available online />Page 11 of 18
(page number not for citation purposes)
rangement was roughly 25% in each group of length (132
bases to 144 bases). However, we found the suggested core
motif C A S S E P
S
R
F
in nine out of 10 sequences starting with
CASSE of 138 bases in length, and in only in one out of 21
sequences starting with CASSE of 141 bases and 144 bases
in length (not shown). Thus, this motif may also be related to
response to huCollp261–273, and the two motives RGQPNT
and SEPRNT together may represent the shared rearrange-
ments for BV11-BJ2.2 of 138 bases. We did not find any obvi-
ous mechanism (such as, for instance, linkage to the other
DRB1 allele) by which some patients use only one and others
use both CDR3 rearrangements.
A total of 81 BV13b-BJ2.3 TCRs were sequenced (14 from
patient OE, 13 from VR, 28 from ST and 26 from MS). In this
case, we found no obviously similar sequences, although we
found at least one sequence of the expected length (199
bases) per each patient exhibiting the following motif: C A S S
X X S
V
G
G D
S
G
T D T Q. This motif is characterized by the pres-
ence of a G and a T spaced by one amino acid residue; this
amino acid is either S or D in patients OE, ST and VR. Both S
and D have a polar side chain, although that of D is negatively
charged and that of S is not. In all of the samples, the amino
acid preceding the conserved G has a short side chain (S in
patients OE and VR, V in patient ST, and G in patient MS),
although S is a polar amino acid whereas G and V are not. If
these TCR- chains were specific for huColl261–273/HLA
DR4 complexes, then the data suggest that G and T possibly
play a dominant role in establishing direct contact with the
antigen, whereas the flanking residues may be more relevant
in determining the appropriate tertiary structure [30]. The cor-
responding cDNA sequences exhibited differences in their
composition that are in part also accounted for by codon
degeneration.
Overall, we found no obvious similarity between the
sequences we obtained for collagen-specific expansions
(including that of the BV1-BJ2.6
+
cells homing to the synovia)
and those that were described in the synovia of a large collec-
tion of RA patients [21]. This difference may be due to the fact
that the cohort of patients we studied was composed exclu-
sively of DRB1 04
+
patients, and that we focused only on
huColl261–273-specific cells.
TCRs that expand in antigen-driven manner belong
mostly to CD45RA
-
T cells
CD45 isoforms and CD62L in parallel describe distinct sub-
sets of T cells. Effector and effector/memory T cells are
CD62L
low
, CD45RA
-
and CD45R0
+
, whereas naïve and cen-
tral/memory T cells are CD62L
high
, CD45RA
+
and CD45R0
-
[32]. We used this discrete distribution of surface markers to
establish the population to which T cells identified by immu-
noscopy as specific for huCollp261–273 belong.
PBMCs were obtained from patient RE, who had a DAS 4.8.
A portion of the cells was separated into CD19
+
and CD19
-
populations by magnetic sorting. CD19
-
cells were then sub-
jected to a further step of magnetic sorting for the enrichment
of CD45RA
+
and CD45RA
-
cells. Details of the expression of
CD45 isoforms on the enriched populations are reported in
Table 8.
Figure 3
Some T cells that expand in response to huCollp263–271 are spontaneously enriched in synovial fluidSome T cells that expand in response to huCollp263–271 are spontaneously enriched in synovial fluid. (a) BV-BJ spectra of three rearrangements
were obtained from PBMCs of patient OE cultured in the absence (control) or presence of huCollp263–271, or from cells harvested from inflamed
knee joint. (b) CDR3 sequences of TCRs carrying BV1-BJ2.6 obtained from collagen peptide-stimulated PBMCs or inflammatory synovial fluid from
patient OE. A box indicates that CDR3 sequences of the expected length that are present in multiple copies in both samples. huCollp261–273,
human collagen peptide 261–273; PBMC, peripheral blood mononuclear cell; TCR, T-cell receptor.
Arthritis Research & Therapy Vol 10 No 6 Ria et al.
Page 12 of 18
(page number not for citation purposes)
The four populations (PBMCs, total CD19
-
, CD45RA-
enriched CD19
-
[74% CD45RA
+
], CD45RA-depleted CD19
-
cells [0% CD45RA
+
cells]) were cultured in the absence or
presence of peptide antigen and of CD19
+
cells (as antigen-
presenting cells) for those populations that had been depleted
of CD19
+
cells. After 3 days, cells were harvested and sub-
jected to immunoscopy analysis for the BV-BJ rearrangements
under study. The results are reported in Table 8. PBMCs from
patient RE exhibited usage of four TCR rearrangements, three
of which (BV11-BJ2.2 [138 bases], BV13-BJ2.3 [201 bases]
and BV16-BJ1.6 [86 bases]) were shared with other RA
patients and one (BV16-BJ2.5 [81 bases]) was exhibited
solely by this individual patient. All of these rearrangements
were once again found (as expected) in the control sample
that was reconstituted by adding 3.2 × 10
6
CD19
-
cells and 2
× 10
5
CD19
+
cells. When we checked for the presence of
each of the rearrangements in the CD45RA-enriched or -
depleted populations, we found that three rearrangements
(BV11-BJ2.2 [138 bases], BV16-BJ1.6 [86 bases] and BV16-
BJ2.5 [81 bases]) were enriched in the CD45RA
-
population,
whereas cells carrying the BV13-BJ2.3 201-base rearrange-
ment co-eluted with CD45RA
+
cells.
To confirm the enrichment of BV11
+
cells in the CD45RA-
depleted population, we sequenced BV11-BJ2.2 CDR3 in the
CDR45RA-enriched and -depleted populations. Twelve
sequences were obtained from the CD45RA-enriched popu-
lation. Only one was of the expected 138 bases in length and
exhibited the following amino acid sequence: C A S S E S G
L S G E L. Six sequences were obtained from the CD45RA-
deleted sample. Two of them were of the expected 138 bases
in length and both exhibited the sequence C A S R G Q P N
T G E L, corresponding to one of the shared CDR3 of BV11
+
public cells. Thus, CDR3 sequencing confirms that BV11
+
cells detected in the peripheral blood of RA patients during
acute disease display an effector/effector memory phenotype.
Similarly, most of the TCRs that we identified as associated
with the response to huColl261–273 during acute bouts of
disease display this effector/effector memory phenotype. At
present we cannot establish whether cells that co-elute with
CD45RA
+
cells belong to the central memory or to a naïve cell
Table 6
Detection of BV11
+
T cells specific for huCollp261–273 is associated with disease activity
Disease status Patient Disease stage DAS BV11+ cellsa
Active OE Onset 6.7 +
FA Onset 6.0 -
AV Onset 6.2 -
VR Onset 5.2 +
ST Onset 6.2 -
MS Onset 6.2 +
OE Relapse 6.0 +
VR Relapse 3.7 +
VG Relapse 3.7 -
BC Relapse 3.7 +
RE Relapse 4.8 +
Moderate disease activity/remission OE 3.5 -
VR 2.6 -
ST 1.6 -
MS 1.6 -
OE 3.2 +
b
MS 1.6 +
b
VGC 0.46 -
MP 1.22 -
LM 0.9 -
a
+ presence or – absence of the huColl261–273 driven expansion of the BV11-BJ2.2 (138 bases) peak in peripheral blood mononuclear cells.
b
Patient relapsed at the following DAS control. DAS, Disease Activity Score; huCollp261–273, human collagen peptide 261–273.
Available online />Page 13 of 18
(page number not for citation purposes)
Table 7
Amino acid and cDNA sequences of the shared BV11-BJ2.2 (138 bases b) and BV13b-BJ2.3 (199 bases b) TCR CDR3 region in ERA
(early rheumatoid arthritis) patients
Region Patient Aminoacid sequences
a
Corresponding cDNA sequence
b
BV11-BJ2.2 (138b) OE C A S S E S R Y T TGTGCCAGCAGTGAATCCCGTTATACCGG
C A S R G Q P N
T TGTGCCAGCCGCGGACAGCCAAACACCGG
C A S R G Q P N
T
VR C A S S E P R N T TGTGCCAGCAGTGAACCTAGGAACACCGG
C A S S E P R N
T
C A S S E P R N
T
C A S S E P R N
T
C A S S E P R N
T
C A S S A V R N T
C A S S P A G N T
C A S T P S G G T
C A S S E L A D T
C A S S G R T S T
MS C A S R G Q P N T TGTGCCAGCCGCGGACAGCCAAACACCGG
C A S R G Q P N
T
C A S R G Q P N
T
C A S R G Q P N
T
C A S R G Q P N
T
C A S R G Q P N
T
C A S R G Q P N
T
C A S R G Q P N
T
C A S R G Q P N
T
C A S S E P R N
T
C A S S E N W N T TGTGCCAGCAGTGAACCTAGGAACACCGG
C A S T R D G H T
C A S S E N W N T
C A S S K S G L S
BC C A S S E S F N T TGTGCCAGCAGTGAATCGTTTAACACCGG
C A S R G Q P N
T
C A S R G Q P N
T TGTGCCAGCCGCGGACAGCCAAACACCGG
C A R Q D G D H T
C A S S G L A G A
BV13bBJ2.3 OE C A S S E A S G S T D TGTGCCAGCAGTGAGGCTAGCGGGAGCACAGATA
(199b) C A S S A V P G Q R D
C A S S L S G T A P D
Arthritis Research & Therapy Vol 10 No 6 Ria et al.
Page 14 of 18
(page number not for citation purposes)
population. However, their ability to proliferate promptly in the
presence of antigen without need for exogenously added
cytokines rather resembles what is expected of central mem-
ory cells [32].
Depletion of CD4
+
CD25
+
cells from PBMCs does not
restore proliferation in vitro of the original TCR
repertoire
Several mechanisms can play a role in the abrogation of the
antigen-driven proliferation of huCollp261–273-specific T
cells. They include depletion from peripheral blood of T cells
because of clonal exhaustion [33] or complement-mediated
lysis [35,36] (although this mechanism does not appear to be
relevant in the therapy based on tumour necrosis factor [TNF]-
VR C A S S L F S G D T D TGTGCCAGCAGTTTATTTAGCGGGGATACAGATA
C A S S L F S G D T
D
C A S S L H P G P T D
C A S S T Q A A S T D
C A S S L H P G P T D
ST C A S S R T V G D T D TGTGCCAGCAGCCGGACTGTAGGGGACACAGATA
C A S S R T V G D T
D
C A S S R T V G D T
D
C A S S D V G T G R D
C A S S D V G T G R D
C A S S D V G T G R D
MS C A S S L S G G GT D TGTGCCAGCAGTCTCAGCGGGGGAGGGACAGATA
C A S S D P D T S T D
C A S S E S G V A T D
C A S S V L A G KA D
C A S R V T G G P E L
a
Sequences corresponding to the shared motifs are presented in bold, underlined text.
b
Bases different from those found in the index patient OE
are presented in bold. TCR, T-cell receptor.
Table 7 (Continued)
Amino acid and cDNA sequences of the shared BV11-BJ2.2 (138 bases b) and BV13b-BJ2.3 (199 bases b) TCR CDR3 region in ERA
(early rheumatoid arthritis) patients
Table 8
Distribution of huColl261–273 specific T cells between CD45RA-enriched and CD45RA-depleted cells
Sample composition PBMC Total CD19
-
/CD19
+
CD19
-
CD45RA enriched/
CD19
+
CD19
-
CD45RA depleted/
CD19
+
CD45 isoform expression (% of
CD3
+
cells)
CD45RA
+
32% CD45RA
+
: 74%
CD45RO
+
: 4.2%
CD45RA
+
: 0%
CD45RO
+
: 54%
Rearrangement
BV11-BJ2.2 (138 bases) ++ - +
BV13-BJ2.3 (201 bases) ++ + -
BV16-BJ1.6 (86 bases) ++ - +
BV16-BJ2.5 (81 bases) ++ - +
Shown is the presence (+) or absence (-) of the huColl261–273 driven expansion of the indicated rearrangements. huCollp261–273, human
collagen peptide 261–273.
Available online />Page 15 of 18
(page number not for citation purposes)
blockers), as well as restoration of regulatory circuits. It has
been reported in fact that development of RA is linked to a
decrease in suppressor activity of CD4
+
CD25
+
suppressor
cells [37]. It has also been observed that treatment with the
TNF- blocker raises the number of these cells that can thus
downmodulate self-reactivity [38,39]. We tested the hypothe-
sis that failure of the original repertoire to expand in vitro after
stimulation with huCollp261–273 was due to the suppressive
activity of CD4
+
CD25
+
cells. We therefore compared the anti-
gen-driven expansion of the nine rearrangements in total
PBMCs and in PBMCs that had been depleted of CD4
+
CD25
+
cells by immunoaffinity.
Figure 4 shows CD4
+
CD25
+
cell content in the lymphocyte
population (panel a) and efficiency of CD4
+
CD25
+
cell deple-
tion (panel b) in the second sample obtained from patient OE
during remission. The enhancing effect on lymphocyte prolifer-
ative response to TCR crosslinking after CD4
+
CD25
+
T-cell
depletion and the blocking effect of an excess of this T-cell
subset is detailed in Figure 4c. These data show that function-
ally active Treg cells were present in the PBMCs of patients.
However, the immunoscopy analysis reported in Figure 4 pan-
els d and e revealed that depletion of CD4
+
CD25
+
cells did
not restore the proliferative ability of any of the rearrangements
that displayed antigen-driven expansion in the first analysis.
In addition, we also observed that T cells carrying the BV16-
BJ1.6 (83 bases) rearrangement (that belong to the 'original'
repertoire) were lost in the fraction that is depleted of
CD4
+
CD25
+
cells. This observation suggests that a part of
the collagen-specific repertoire may play a regulatory role.
Discussion
In this report we used modified BV-BJ immunoscopy to ana-
lyze a part of the TCR repertoire involved in the early prolifera-
tive response to huCollp261–273 in 12 DR 1 04
+
RA
patients and 5 DR 1 04
+
healthy relatives of RA patients. The
CDR3 BV-BJ spectratyping (that is about 10-fold more sensi-
tive than the classical BV-BC spectratyping) has shown to be
able to produce a detailed picture of immune responses
[29,40]. This technique needs a single round of proliferation
'in vitro' to highlight specific T cells in lymph nodes or periph-
eral blood, and allows the identification of a given TCR in tar-
get organs also [29,31,32]. In mouse this technique has
allowed the dissection of antigen-specific T-cell repertoires
(for examples [29,31,32]), showing that T-cell responses are
not spread on the entire available repertoire of CDR3-
regions. Rather, a limited number of rearrangements is respon-
sible for the entire response. Usage of these rearrangements
can be individual (the private repertoire) or shared among a
reasonable percentage of individuals (semi-private and public
repertoires). Public TCRs were identified in response to influ-
enza matrix protein, cytomegalovirus, Epstein-Barr virus, HIV
and simian immunodeficinecy virus in humans [41].
In the index case, in which complete BV-BJ spectratyping was
performed, we observed that the patient used a limited reper-
toire of TCR at onset of the disease. It was possible to define
a group of TCRs specific for huCollp261–273 shared among
RA DRB1 04
+
patients and distinct from the repertoire that is
shared among healthy control individuals. A part of the colla-
gen-specific repertoire was spontaneously enriched in the
synovial fluid obtained from the inflamed joint. In addition, a
large part of the repertoire detectable by immunoscopy during
acute presentation of RA appears to belong to the effector
CD45RA
-
population. These two observations together sup-
port the hypothesis that collagen-specific T cells were direct
bystanders of the acute presentation of the disease. Therapy
that reduced disease activity also reduced the proliferation of
this repertoire in response to huCollp261–273, and few new
rearrangements are recruited in the original collagen-specific
TCR repertoire during the course of the disease. Depletion of
CD4
+
CD25
+
cells did not restore the antigen-driven expan-
sion of T cells carrying the studied rearrangements, suggest-
ing that suppressor activity induced by therapy is apparently
not involved in the failure to proliferate of the studied cells. It
must be recognized that not all Tregs are depleted by deplet-
ing CD4
+
CD25
+
cells. Nevertheless, our results show that col-
lagen-driven T-cell expansion does not depend strictly on their
function.
In the present study we found that the TCR repertoire used by
this patient in the early phases of RA appears fairly limited. In
addition, only a few of the available huCollp261–273-specific
T cells actually homed to the synovia. Disease activity
remained low also when the BV11
+
self-reactive repertoire
reappeared and once again became detectable, whereas
DAS was once again high only when also those CDR3s that
identify T cells homing to the synovia at the onset of disease
were again detected in PBMCs. Therefore, it may be sug-
gested that the acute event relies on those CDR3s that belong
to T cells that can to home to the synovia. Thus, a therapeutic
intervention may focus on these T cells without the need to
deplete the entire self-reactive repertoire to achieve clinically
relevant results. In addition, the presence of the BV11
+
cells in
PBMCs may prove helpful in managing RA patients, if studies
in a large cohort can confirm that T cells belonging to this rep-
ertoire re-emerge ahead of disease reactivation.
Healthy relatives of RA patients show usage of a special set of
collagen-specific shared TCRs, distinct from those found in
patients. Further studies will be needed to establish whether
these collagen-specific T cells rather protect from disease. At
least two potential mechanisms may explain this modification
of the self-reactive repertoire observed. In the first possible
mechanism, RA-prone patients may be predisposed to rear-
range and allow the maturation in the thymus of T cells carrying
TCRs that are different from those produced in the DR4
+
patients, who will not develop disease. Such a predisposition
will result in T cells having a higher avidity for self-antigens
Arthritis Research & Therapy Vol 10 No 6 Ria et al.
Page 16 of 18
(page number not for citation purposes)
and/or a greater propensity of these cells to polarize toward
pathogenic phenotypes such as T-helper-1 or T-helper-17. A
second hypothesis is that the encounter with an environmental
crossreactive antigen causes a shift of the collagen-specific
TCR repertoire from that related to healthy status to one
involved in disease determination [32].
The observation that the TCR repertoire mostly involved in dis-
ease determination remains fairly stable during disease con-
veys interesting theoretical suggestions. Despite small
clonotype enlargement, we observed that it is in the majority of
the cases the initial repertoire that can be found in blood also
at later time points. Such a failure to modify the TCR repertoire
of self-reactive cells can be the result of two mechanisms. One
possibility is that central tolerance may reduce the autoreac-
tive repertoire. Alternatively, memory T cells persisting in lymph
nodes can prevent priming of naïve T cells by competition for
the antigen-presenting cell [42-44]. In any case, early block-
ade of the disease might prevent the late spread of TCR
usage.
It has been suggested that CD4
+
CD25
+
cells downregulate
immune responses acting via cell-cell contact or cytokine
secretion [45]. Their decrease has been associated with
development of self-reactive diseases (for example [46]). In
RA, however, it has been reported that the number of
CD4
+
CD25
+
cells in peripheral blood is comparable to that in
normal individuals, and that they accumulate in inflamed joints
[47,48], where they also suppress secretion of protective
cytokines [48]. Treatment with TNF- blocker in RA patients
Figure 4
CD4
+
CD25
+
cell depletion from PBMCs does not restore proliferation in vitro of the original TCR repertoireCD4
+
CD25
+
cell depletion from PBMCs does not restore proliferation in vitro of the original TCR repertoire. (a, b) Dual colour dot plot displaying
the co-expression of CD4 and CD25 in the lymphocyte population. The regions used to measure the proportion of CD4
+
CD25
high
(Treg cells) are
shown. (Panel a) Treg cells are 1.33% and 2.9% in the total lymphocyte population and within the CD4
+
subset, respectively. (Panel b) Treg cells
are efficiently removed (0.05% and 1.1% in the total lymphocyte population and within the CD4
+
subset, respectively) after depletion with anti-CD25
immunomagnetic microbeads. (c) Effect of Treg cell removal and of excess Treg cells on T-cell proliferative response. Bars show the proliferation
index measured by ModFit™/Cell Proliferation Model™ software, as detailed in the Materials and methods section. (d) RSI of the TCR repertoire
involved in the response to huCollp261–273 when examined in the unseparated PBMCs (see panel a). Dashed bars indicate the RSI of the BV11-
BJ2.2 (138 bases) rearrangement. (e) RSI of the TCR repertoire involved in the response to huCollp261–273 when examined in the CD4
+
CD25
+
-
depleted PBMC. huCollp261–273, human collagen peptide 261–273; PBMC, peripheral blood mononuclear cell; RSI, rate stimulation index; TCR,
T-cell receptor.
Available online />Page 17 of 18
(page number not for citation purposes)
improves the suppressive activity of these cells [38], possibly
preventing their apoptosis [49], which can thus downmodu-
late self-reactivity [37]. However, failure of collagen-specific T
cells to proliferate in response to peptide antigen did not
appear in this case to rely on CD4
+
CD25
+
cells (which con-
tain the Treg cells), even though the CD4
+
CD25
+
T cells were
demonstrated to be functionally active. It can be hypothesized
that other mechanisms may be employed to regulate the pres-
ence of self-reactive T cells during disease, such as activation-
induced cell death and presence of interleukin-10 or trans-
forming growth factor- producing cells. However, our data do
not permit discrimination among these or other mechanisms.
Further studies in early RA patients could provide more strong
data to support the hypothesis that the CDR3 sequences we
observed in this case do represent a common repertoire of the
TCR among T cells that are self-reactive to huCollp261–273.
Were this true, then new strategies could be envisioned with
diagnostic and therapeutic applications.
Conclusion
The huCollp261–273-specific TCR repertoire in peripheral
blood and synovial fluid is restricted to a limited number of
TCR- rearrangements. The majority of the repertoire is shared
between patients with early RA and it is modulated by therapy.
Monitoring the self-reactive TCR repertoire in peripheral blood
may allow prediction of disease relapse, providing a powerful
tool for patient management.
Competing interests
The authors declare that they have obtained a national patent
RM2007A000429 and an international PCT deposited on 6
August 2008: PCT/IB2008/053152National Patent.
Authors' contributions
FR has made substantial contributions to the conception and
design of the study, and analysis and interpretation of the data.
He drafted the manuscript and gave final approval of the ver-
sion to be published. RP, MDS, CN, GDS, AF and AB con-
ducted the research. MO and DA contributed analytical tools.
GF made substantial contributions to the conception and
design of the study, and analysis and interpretation of the data.
He drafted the manuscript and gave final approval of the ver-
sion to be published.
Acknowledgements
We thank Silvia Bosello, Anna Laura Fedele and Ilaria Cuoghi for collect-
ing patient data, and Barbara Tolusso for general support.
Written consent for publication was obtained from patients or their rela-
tives.
References
1. Russell AS: Quality-of-life assessment in rheumatoid arthritis.
Pharmacoeconomics 2008, 26:831-846.
2. Koivula MK, Aman S, Karjalainen A, Hakala M, Risteli J: Are there
autoantibodies reacting against citrullinated peptides derived
from type I and type II collagens in patients with rheumatoid
arthritis? Ann Rheum Dis 2005, 64:1443-1450.
3. Chaiamnuay S, Bridges SL Jr: The role of B cells and autoanti-
bodies in rheumatoid arthritis. Pathophysiology 2005,
12:203-216.
4. Burkhardt H, Sehnert B, Bockermann R, Engstrom A, Kalden JR,
Holmdahl R: Humoral immune response to citrullinated colla-
gen type II determinants in early rheumatoid arthritis. Eur J
Immunol 2005, 35:1643-1652.
5. Wooley PH, Luthra HS, Singh SK, Huse AR, Stuart JM, David CS:
Passive transfer of arthritis to mice by injection of human anti-
type II collagen antibody. Mayo Clin Proc 1984, 59:737-743.
6. Ronnelid J, Lysholm J, Engstrom-Laurent A, Klareskog L, Heyman
B: Local anti-type II collagen antibody production in rheuma-
toid arthritis synovial fluid. Evidence for an HLA-DR4-restricted
IgG response. Arthritis Rheum 1994, 37:1023-1029.
7. Rudolphi U, Rzepka R, Batsford S, Kaufmann SH, Mark K von der,
Peter HH, Melchers I: The B cell repertoire of patients with
rheumatoid arthritis. II. Increased frequencies of IgG
+
and IgA
+
B cells specific for mycobacterial heat-shock protein 60 or
human type II collagen in synovial fluid and tissue. Arthritis
Rheum 1997, 40:1409-1419.
8. Bajtner E, Nandakumar KS, Engstrom A, Holmdahl R: Chronic
development of collagen-induced arthritis is associated with
arthritogenic antibodies against specific epitopes on type II
collagen. Arthritis Res Ther 2005, 7:R1148-R1157.
9. Nandakumar KS, Bajtner E, Hill L, Bohm B, Rowley MJ, Burkhardt
H, Holmdahl R: Arthritogenic antibodies specific for a major
type II collagen triple-helical epitope bind and destabilize car-
tilage independent of inflammation. Arthritis Rheum 2008,
58:184-196.
10. Londei M, Savill CM, Verhoef A, Brennan F, Leech ZA, Duance V,
Maini RN, Feldmann M: Persistence of collagen type II-specific
T-cell clones in the synovial membrane of a patient with rheu-
matoid arthritis. Proc Natl Acad Sci USA 1989, 86:636-640.
11. Kim HY, Kim WU, Cho ML, Lee SK, Youn J, Kim SI, Yoo WH, Park
JH, Min JK, Lee SH, Park SH, Cho CS: Enhanced T cell prolifer-
ative response to type II collagen and synthetic peptide CII
(255–274) in patients with rheumatoid arthritis. Arthritis
Rheum 1999, 42:2085-2093.
12. Andersson IE, Dzhambazov B, Holmdahl R, Linusson A, Kihlberg J:
Probing molecular interactions within class II MHC Aq/glyco-
peptide/T-cell receptor complexes associated with collagen-
induced arthritis. J Med Chem 2007, 50:5627-5643.
13. Mitamura M, Nakano N, Yonekawa T, Shan L, Kaise T, Kobayashi
T, Yamashita K, Kikkawa H, Kinoshita M: T cells are involved in
the development of arthritis induced by anti-type II collagen
antibody. Int Immunopharmacol 2007, 7:1360-1368.
14. Rosloniec EF, Whittington KB, He X, Stuart JM, Kang AH: Colla-
gen-induced arthritis mediated by HLA-DR1 (*0101) and HLA-
DR4 (*0401). Am J Med Sci 2004, 327:169-179.
15. Stuart JM, Dixon FJ: Serum transfer of collagen-induced arthri-
tis in mice. J Exp Med 1983, 158:378-392.
16. Brand DD, Latham KA, Rosloniec EF: Collagen-induced arthritis.
Nat Protoc 2007, 2:1269-1275.
17. Backlund J, Carlsen S, Hoger T, Holm B, Fugger L, Kihlberg J, Bur-
khardt H, Holmdahl R:
Predominant selection of T cells specific
for the glycosylated collagen type II epitope (263–270) in
humanized transgenic mice and in rheumatoid arthritis. Proc
Natl Acad Sci USA 2002, 99:9960-9965.
18. Mima T, Ohshima S, Sasai M, Nishioka K, Shimizu M, Murata N,
Yasunami R, Matsuno H, Suemura M, Kishimoto T, Saeki Y: Dom-
inant and shared T cell receptor beta chain variable regions of
T cells inducing synovial hyperplasia in rheumatoid arthritis.
Biochem Biophys Res Commun 1999, 263:172-180.
19. Sekine T, Kato T, Masuko-Hongo K, Nakamura H, Yoshino S, Nish-
ioka K, Yamamoto K: Type II collagen is a target antigen of clon-
ally expanded T cells in the synovium of patients with
rheumatoid arthritis. Ann Rheum Dis 1999, 58:446-450.
20. Borght A Vander, Geusens P, Vandevyver C, Raus J, Stinissen P:
Skewed T-cell receptor variable gene usage in the synovium
of early and chronic rheumatoid arthritis patients and persist-
ence of clonally expanded T cells in a chronic patient. Rheu-
matology (Oxford) 2000, 39:1189-1201.
21. Sun W, Nie H, Li N, Zang YC, Zhang D, Feng G, Ni L, Xu R, Prasad
S, Robinson RR, Ho W, Sercarz E, Zhang JZ: Skewed T-cell
receptor BV14 and BV16 expression and shared CDR3
Arthritis Research & Therapy Vol 10 No 6 Ria et al.
Page 18 of 18
(page number not for citation purposes)
sequence and common sequence motifs in synovial T cells of
rheumatoid arthritis. Genes Immun 2005, 6:248-261.
22. Arnett FC, Edworthy SM, Bloch DA, Mcshane DJ, Fries JF, Cooper
NS, Healey LA, Kaplan SR, Liang MH, Luthra HS, Medsger TA Jr,
Mitchell DM, Neustadt DH, Pinals RS, Schaller JG, Sharp JT,
Wilder RL, Hunder GG: The American Rheumatism Association
1987 revised criteria for the classification of rheumatoid arthri-
tis. Arthritis Rheum 1988, 31:315-324.
23. Fransen J, van Riel PL: The Disease Activity Score and the
EULAR response criteria. Clin Exp Rheumatol 2005,
23:S93-S99.
24. Ria F, Gallard A, Gabaglia CR, Guery JC, Sercarz EE, Adorini L:
Selection of similar naive T cell repertoires but induction of
distinct T cell responses by native and modified antigen. J
Immunol 2004, 172:3447-3453.
25. Currier JR, Deulofeut H, Barron KS, Kehn PJ, Robinson MA:
Mitogens, superantigens, and nominal antigens elicit distinc-
tive patterns of TCRB CDR3 diversity. Hum Immunol 1996,
48:39-51.
26. ExPASy Proteomics Server [
]
27. Fattorossi A, Battaglia A, Buzzonetti A, Ciaraffa F, Scambia G,
Evoli A: Circulating and thymic CD4 CD25 T regulatory cells in
myasthenia gravis: effect of immunosuppressive treatment.
Immunology 2005, 116:134-141.
28. Fattorossi A, Battaglia A, Ferlini C: Lymphocyte activation asso-
ciated antigens. Methods Cell Biol 2001, 63:433-463.
29. Pannetier C, Cochet M, Darche S, Casrouge A, Zoller M, Kourilsky
P: The sizes of the CDR3 hypervariable regions of the murine
T-cell receptor beta chains vary as a function of the recom-
bined germ-line segments. Proc Natl Acad Sci USA 1993,
90:4319-4323.
30. Nicolo C, Di Sante G, Orsini M, Rolla S, Columba-Cabezas S,
Romano Spica V, Ricciardi G, Chan BM, Ria F: Mycobacterium
tuberculosis in the adjuvant modulates the balance of Th
immune response to self-antigen of the CNS without influenc-
ing a 'core' repertoire of specific T cells. Int Immunol 2006,
18:363-374.
31. Rolla S, Nicolo C, Malinarich S, Orsini M, Forni G, Cavallo F, Ria F:
Distinct and non-overlapping T cell receptor repertoires
expanded by DNA vaccination in wild-type and HER-2 trans-
genic BALB/c mice. J Immunol 2006, 177:7626-7633.
32. Penitente R, Nicolo C, Elzen P Van den, Di Sante G, Agrati C,
Aloisi F, Sercarz EE, Ria F: Administration of PLP139–151
primes T cells distinct from those spontaneously responsive
in vitro to this antigen. J Immunol 2008, 180:6611-6622.
33. Bingaman AW, Patke DS, Mane VR, Ahmadzadeh M, Ndejembi M,
Bartlett ST, Farber DL: Novel phenotypes and migratory proper-
ties distinguish memory CD4 T cell subsets in lymphoid and
lung tissue. Eur J Immunol 2005, 35:3173-3186.
34. Waldmann T: The contrasting roles of IL-2 and IL-15 in the life
and death of lymphocytes: implications for the immuno-
therapy of rheumatological diseases. Arthritis Res 2002,
4(suppl 3):S161-S167.
35. Vigna-Perez M, Abud-Mendoza C, Portillo-Salazar H, Alvarado-
Sanchez B, Cuevas-Orta E, Moreno-Valdes R, Baranda L, Pare-
des-Saharopulos O, Gonzalez-Amaro R: Immune effects of ther-
apy with Adalimumab in patients with rheumatoid arthritis.
Clin Exp Immunol 2005, 141:372-380.
36. Shen C, Assche GV, Colpaert S, Maerten P, Geboes K, Rutgeerts
P, Ceuppens JL: Adalimumab induces apoptosis of human
monocytes: a comparative study with infliximab and etaner-
cept. Aliment Pharmacol Ther 2005, 21:251-258.
37. Londei M: Role of regulatory T cells in experimental arthritis
and implications for clinical use. Arthritis Res Ther 2005,
7:118-120.
38. Ehrenstein MR, Evans JG, Singh A, Moore S, Warnes G, Isenberg
DA, Mauri C: Compromised function of regulatory T cells in
rheumatoid arthritis and reversal by anti-TNFalpha therapy. J
Exp Med 2004, 200:277-285.
39. Toubi E, Kessel A, Mahmudov Z, Hallas K, Rozenbaum M, Rosner
I: Increased spontaneous apoptosis of CD4
+
CD25
+
T cells in
patients with active rheumatoid arthritis is reduced by inflixi-
mab. Ann N Y Acad Sci 2005, 1051:506-514.
40. Matsumoto Y: Characterization of T cell receptor (TCR) of
organ-specific autoimmune disease-inducing T cells and TCR-
based immunotherapy with DNA vaccines. J Neuroimmunol
2000, 110:1-12.
41. Gras S, Kjer-Nielsen L, Burrows SR, McCluskey J, Rossjohn J: T-
cell receptor bias and immunity. Curr Opin Immunol 2008,
20:119-125.
42. Bikah G, Pogue-Caley RR, McHeyzer-Williams LJ, McHeyzer-Wil-
liams MG: Regulating T helper cell immunity through antigen
responsiveness and calcium entry. Nat Immunol 2000,
1:402-412.
43. Tian J, Gregori S, Adorini L, Kaufman DL: The frequency of high
avidity T cells determines the hierarchy of determinant
spreading. J Immunol 2001, 166:7144-7150.
44. Lanzavecchia A: Lack of fair play in the T cell response. Nat
Immunol 2002, 3:9-10.
45. Tang Q, Bluestone JA: The Foxp3
+
regulatory T cell: a jack of all
trades, master of regulation. Nat Immunol 2008, 9:239-244.
46. Liu MF, Wang CR, Fung LL, Wu CR: Decreased CD4
+
CD25
+
T
cells in peripheral blood of patients with systemic lupus ery-
thematosus. Scand J Immunol 2004, 59:198-202.
47. van Amelsfort JM, Jacobs KM, Bijlsma JW, Lafeber FP, Taams LS:
CD4
+
CD25
+
regulatory T cells in rheumatoid arthritis: differ-
ences in the presence, phenotype, and function between
peripheral blood and synovial fluid. Arthritis Rheum 2004,
50:2775-2785.
48. Mottonen M, Heikkinen J, Mustonen L, Isomaki P, Luukkainen R,
Lassila O: CD4
+
CD25
+
T cells with the phenotypic and func-
tional characteristics of regulatory T cells are enriched in the
synovial fluid of patients with rheumatoid arthritis. Clin Exp
Immunol 2005, 140:360-367.
49. Liu MF, Wang CR, Fung LL, Lin LH, Tsai CN: The presence of
cytokine-suppressive CD4
+
CD25
+
T cells in the peripheral
blood and synovial fluid of patients with rheumatoid arthritis.
Scand J Immunol 2005, 62:312-317.