Báo cáo y học: "The effects of infliximab therapy on the serum proteome of rheumatoid arthritis patients" pptx
Bạn đang xem bản rút gọn của tài liệu. Xem và tải ngay bản đầy đủ của tài liệu tại đây (725.86 KB, 11 trang )
Open Access
Available online />Page 1 of 11
(page number not for citation purposes)
Vol 11 No 2
Research article
The effects of infliximab therapy on the serum proteome of
rheumatoid arthritis patients
Ravi C Dwivedi
1,2
, Navjot Dhindsa
2
, Oleg V Krokhin
1,2
, John Cortens
1,2
, John A Wilkins
1,2
and
Hani S El-Gabalawy
1,2
1
Manitoba Centre for Proteomics and Systems Biology, University of Manitoba, 799-715 McDermot Avenue, Winnipeg, MB, R3E 3P4, Canada
2
Department of Internal Medicine, University of Manitoba, RR149-800 Sherbrook Street, Winnipeg, MB, R3A 1M4, Canada
Corresponding author: Hani S El-Gabalawy,
Received: 7 Jan 2009 Revisions requested: 30 Jan 2009 Revisions received: 25 Feb 2009 Accepted: 6 Mar 2009 Published: 6 Mar 2009
Arthritis Research & Therapy 2009, 11:R32 (doi:10.1186/ar2637)
This article is online at: />© 2009 Dwivedi et al.; licensee BioMed Central Ltd.
This is an open access article distributed under the terms of the Creative Commons Attribution License ( />),
which permits unrestricted use, distribution, and reproduction in any medium, provided the original work is properly cited.
Abstract
Introduction Although the clinical effects of infliximab therapy in
rheumatoid arthritis have been documented extensively, the
biological effects of this intervention continue to be defined. We
sought to examine the impact of infliximab therapy on the serum
proteome of rheumatoid arthritis patients by means of a mass
spectrometry-based approach.
Methods Sera from 10 patients with rheumatoid arthritis were
obtained prior to and following 12 weeks of infliximab therapy
using a standard clinical protocol. The sera were
immunodepleted of the 12 highest abundance proteins, labeled
by the iTRAQ (isobaric tagging for relative and absolute protein
quantification) technique, and analyzed by mass spectrometry to
identify proteomic changes associated with treatment.
Results An average of 373 distinct proteins were identified per
patient with greater than 95% confidence. In the 3 patients
demonstrating the most robust clinical responses, changes of
greater than 20% in the serum levels were observed in 39
proteins following treatment. The majority of these proteins were
regulated directly or indirectly by tumour necrosis factor-alpha
(TNF-α) and nuclear factor-kappa-B, with acute-phase proteins
being uniformly down-regulated. A number of proteins, including
members of the SERPIN family and S100A8, were down-
regulated irrespective of clinical response.
Conclusions The present study demonstrates that a robust
clinical response to infliximab is associated with the down-
regulation of a spectrum of serum proteins regulated by TNF-α,
and provides a possible basis for defining the broader biological
effects of the treatment in vivo.
Introduction
Rheumatoid arthritis (RA) is a clinically and biologically heter-
ogeneous disorder. Response to disease-modifying anti-rheu-
matic drug (DMARD) therapy is unpredictable, even in patient
groups that appear to be clinically homogeneous. The assess-
ment of clinical response to DMARD therapy involves the
acquisition and integration of patient-derived parameters
measured by visual analogue scales and functional assess-
ments such as the Health Assessment Questionnaire (HAQ),
physician-derived counts of swollen and tender joints, and lab-
oratory measures of the acute-phase response, usually the
level of C-reactive protein (CRP) or erythrocyte sedimentation
rate (ESR). For clinical trial purposes, these parameters are
used to calculate a single composite index, with the disease
activity score (DAS) being one of the most commonly used
indices in RA clinical metrology [1,2]. Despite the widespread
use of these indices in clinical trials, their performance as indi-
cators of response in individual RA patients is more problem-
atic [1]. Moreover, the biological basis for the clinical
responses is not well understood. There is thus an important
need for the development of biomarkers that more accurately
reflect the impact of specific therapies on the underlying dis-
ease process.
With the introduction of targeted biological anti-rheumatic
drug therapies, for which the mechanism of action is well
CRP: C-reactive protein; DAS: disease activity score; DAS28: disease activity score using 28 joint counts; DMARD: disease-modifying anti-rheumatic
drug; DTT: dithiothreitol; EULAR: European League Against Rheumatism; IAA: iodoacetamide; iTRAQ: isobaric tagging for relative and absolute pro-
tein quantification; LC: liquid chromatography; MS: mass spectrometry; MS/MS: tandem mass spectrometry; NF-κB: nuclear factor-kappa-B; NR:
non-responder; R: responder; RA: rheumatoid arthritis; T0: time point at baseline; T12: time point at 12 weeks; TNF-α: tumour necrosis factor-alpha.
Arthritis Research & Therapy Vol 11 No 2 Dwivedi et al.
Page 2 of 11
(page number not for citation purposes)
defined, there has been an increased understanding of patho-
genic mechanisms underlying RA [3]. In particular, the highly
successful use of tumour necrosis factor-alpha (TNF-α) inhib-
itors in clinical practice has highlighted the central role that
this cytokine plays in the pathogenesis of RA [4,5]. The biolog-
ical effects of this treatment have been evaluated at both the
systemic [6,7] and synovial [8-10] levels, although it remains
unclear how each of these contributes to the overall clinical
responses in the treated patients as measured using indices
such as the DAS. Importantly, the biological mechanisms
underlying a primary lack of response, a phenomenon
observed in at least one third of treated RA patients, remain to
be defined.
The availability of highly sensitive proteomic platforms pro-
vides the opportunity for a broad uncensored exploration of
the changes that occur in the proteome with the use of tar-
geted anti-rheumatic drug therapies such as infliximab, a
potent TNF-α inhibitor now widely used in routine clinical prac-
tice. These approaches can be applied to a spectrum of bio-
logical materials, including serum, urine, synovial fluid, and cell
populations. Because of their ease of acquisition in clinical
practice, serum and plasma are well suited for assessing the
effects of drug therapy in RA, but they are some of the most
complex biological protein mixtures to analyze. In part, this
relates to the preponderance of several high-abundance pro-
teins such as albumin and gammaglobulin [11]. These high-
abundance proteins mask the presence of potentially more
informative low-abundance proteins, which are present at con-
centrations that are orders of magnitude lower. These multi-
fold quantitative differences in the levels of serum proteins
have necessitated the implementation of approaches that aim
to reduce the complexity of the serum proteome by removing
a spectrum of high-abundance proteins to unmask the lower
abundance proteins, prior to undertaking the actual proteomic
analyses [11].
We undertook a study evaluating the effects of infliximab on
the serum proteome. We used a technique that depleted the
12 most abundant serum proteins, and then we labeled the
proteins using the iTRAQ (isobaric tagging for relative and
absolute protein quantification) technique to generate quanti-
tative data. Thus, the proteome of a serum sample obtained at
baseline was compared with that of a sample obtained after
12 weeks of infliximab therapy. The data generated support
the utility of this approach in defining quantitative changes that
occur in a wide spectrum of low-abundance proteins, and they
demonstrate consistent changes in TNF-α-regulated proteins,
particularly in the patients who had the most robust clinical
responses.
Materials and methods
Patients
Ten patients who met American College of Rheumatology cri-
teria for RA were included in this study [12]. The study proto-
col was approved by the Research Ethics Board of the
University of Manitoba, and all patients provided informed con-
sent. At the time of inclusion into the study, the patients were
all receiving methotrexate and had demonstrated an incom-
plete response to optimum methotrexate doses of 15 to 20 mg
weekly. A study rheumatologist undertook all clinical assess-
ments. A baseline serum sample (T0) was drawn for proteomic
analysis prior to initiation of infliximab. Patients were then
treated with infliximab using a standard clinical protocol of 3
mg/kg at weeks 0, 2, and 6 and then every 8 weeks thereafter.
A second serum sample was obtained for proteomic studies
at week 12 (T12), at which time all patients had received three
doses of infliximab. Patients were followed clinically for 52
weeks.
Depletion of high-abundance serum proteins
Serum samples (30 μL) were processed to remove the 12
most abundant serum proteins (albumin, IgG, IgM, IgA, trans-
ferrin, fibrinogen, alpha2-macroglobulin, alpha1-anti-trypsin,
haptoglobin, alpha1-acid glycoprotein, apolipoprotein A-I, and
apolipoprotein A-II) using antibody-based immunodepletion
spin columns in accordance with the protocol of the manufac-
turer (ProteomeLab™ IgY-12 high-capacity spin column;
Beckman Coulter, Inc., Fullerton, CA, USA). In short, serum
was incubated on an IgY-12 column for 20 minutes at room
temperature and the depleted serum in the unbound flow-
through was collected by centrifugation at 1,000 revolutions
per minute for 30 seconds. The retained proteins were
removed from the column and neutralized using buffers pro-
vided by the manufacturer. The regenerated column was used
for the processing of subsequent samples.
SDS-PAGE analysis
SDS-PAGE was performed to determine the quality of the
sample preparations. Twenty microlitres of samples containing
approximately 20 μg of serum, flow-through, or eluted IgY-12-
bound proteins was denatured and reduced by boiling after
combining with 5 μL of 5× SDS loading buffer containing 100
mM dithiothreitol (DTT) for 5 minutes. Twenty microlitres of
each fraction was loaded and separated on 4% to 12% gradi-
ent SDS-polyacrylamide (Invitrogen Canada Inc., Burlington,
ON, Canada). The gels were stained with gel-code blue
(Pierce, Rockford, IL, USA).
Sample preparation
Approximately 140 μg of processed serum proteins (as deter-
mined by the micro-bicinchoninic acid method; Pierce)
obtained after IgY-12 column treatment was adjusted to a 200
μL volume with 100 mM ammonium bicarbonate buffer. The
proteins in each sample were reduced with 10 mM (final con-
centration) DTT for 40 minutes at 56°C followed by alkylation
using 50 mM iodoacetamide (IAA) for 20 minutes at room tem-
perature. Excess of IAA was neutralized by the addition of 17
mM DTT for 20 minutes at room temperature. Proteins were
digested in a 1:50 trypsin/protein ratio for 16 hours at 37°C.
Available online />Page 3 of 11
(page number not for citation purposes)
Samples were frozen at -20°C and dried using a speed vac-
uum. Trypsin-digested peptides were purified using a
reversed-phase Scalar C-18 (1 × 100 mm, 5 μm, 100 Å) col-
umn (Agilent Technologies, Inc., Santa Clara, CA, USA).
iTRAQ labeling of peptides
Aliquots of 140 μg of each isolate were digested separately
with trypsin, and the resulting peptides were labeled with dif-
ferent reporter iTRAQ (Applied Biosystems, Foster City, CA,
USA) in accordance with manufacturer procedure. Labeled
samples were mixed in equal proportions and subjected to
two-dimensional high-performance liquid chromatography
(LC)-mass spectrometry (MS) analysis.
iTRAQ labeling allows for the simultaneous comparison of
multiple samples in a single MS analysis [13,14]. This
approach reduces some of the variability that can be encoun-
tered when comparing the results of samples that were ana-
lyzed in different experiments. The procedure involves the
labeling of peptides from separate samples with an isobaric
tag that contains one of the unique mass tags (for example,
114, 115, 116, or 117). The labeled peptides from the com-
parator samples are then combined in equal amounts and ana-
lyzed by MS. Thus, the basic premise of our analysis was that
most proteins would be unchanged between T0 and T12 and
would have reporter ion ratios of approximately 1 for their com-
ponent peptides. Proteins that have alterations in their con-
centrations will deviate above or below this ratio, depending
on the direction of the change.
Two-dimensional high-performance liquid
chromatography-mass spectrometry analysis
First dimension: peptide fractionation at pH 10
The peptides were separated using a recently developed two-
dimensional LC method that employs high-pH reversed-phase
separation in the first dimension [15-17]. Mixed iTRAQ-
labeled peptides derived from approximately 120 μg of total
protein were gradient-fractionated on a C18 X-Terra column
(1 × 100 mm, 5 μm, 100 Å; Waters Corporation, Milford, MA,
USA). Both eluents A (water) and B (90% acetonitrile) con-
tained 20 mM ammonium formate buffer (pH 10.0). A total of
60 fractions were collected using a gradient of 1% to 50% of
solvent B in 67 minutes at a flow rate of 150 μL/minute. Frac-
tions were dried and dissolved in 50 μL of eluent A (see next
section), and 20 μL was injected for analysis in the second
dimension.
Second dimension: liquid chromatography-electrospray
ionization-tandem mass spectrometry analysis
A splitless nano-flow Tempo LC system (Eksigent, Dublin, CA,
USA) with sample injection via a PepMap100 trap column (0.3
× 5 mm, 5 μm, 100 Å; Dionex Corporation, Sunnyvale, CA,
USA) and a 100 μm × 150 mm analytical column packed with
5 μm Luna C18(2) (Phenomenex, Torrance, CA, USA) was
used in the second-dimension separation prior to tandem MS
(MS/MS) analysis. Both eluents A (2% acetonitrile in water)
and B (98% acetonitrile) contained 0.1% formic acid as an
ion-pairing modifier. A 0.44% acetonitrile per minute linear
gradient (0% to 35% B in 80 minutes, 500 nL/minute) was
used for peptide elution, followed by a 5-minute wash with
80% B.
A QStar Elite QqTOF mass spectrometer (Applied Biosys-
tems) was used in standard MS/MS data-dependent acquisi-
tion mode with a nano-electrospray ionization source. Survey
MS spectra were collected (m/z 400 to 1,500) for 1 second
followed by three MS/MS measurements on the most intense
parent ions (80 counts/second threshold, +2 to +4 charge
state, and m/z 100 to 1,500 mass range for MS/MS), using
the manufacturer's 'smart exit' and 'iTRAQ' settings. Parent
ions previously targeted were excluded from repetitive MS/MS
acquisition for 60 seconds (mass tolerance of 50 mDa).
Database search and protein identification
The MS/MS data were analyzed using ProteinPilot software
version 2.0.1 (Applied Biosystems/MDS Sciex, Concord, ON,
Canada). The search parameters were complete modifications
of Cys alkylation with IAA, and inbuilt iTRAQ analysis residue
modifications settings were on. Those protein candidates with
greater than or equal to 95% identification confidence were
used for further analysis.
Functional categorization of proteins identified in serum
The annotation of protein cellular localization and biological
function was performed using Ingenuity software (Ingenuity
Systems, Inc., Redwood City, CA, USA).
Results
All of the patients studied were females with a mean age of
45.5 years (range 33 to 72) and a mean disease duration of
2.3 years (range 0.5 to 20), and all but one patient were sero-
positive for IgM rheumatoid factor. Disease activity was
assessed using the DAS28 (DAS using 28 joint counts)-CRP
method [18]. The mean (range) of the baseline DAS28 for the
patients was 5.8 (3.8 to 7.4) (Table 1). Response to infliximab
therapy was assessed by comparing the T0 and T12 DAS28
scores, and the European League Against Rheumatism
(EULAR) response criteria were applied [19,20]. A 'good'
response is defined as Δ (T0 minus T12) DAS28 of greater
than 1.2 from baseline and a current DAS28 of less than 3.2,
whereas a 'moderate' response requires a Δ DAS28 of greater
than 0.6 and less than 1.2 and a current DAS28 of greater
than 3.2 and less than 5.1. None of the patients had achieved
a 'good' response at T12 (Table 1), but patients 13, 16, 18,
and 23 had all achieved a 'moderate' response on the basis of
these criteria. Moreover, one of these individuals (10618)
actually had an increase in the CRP level despite a reduction
of 2.5 in the DAS28. We elected to exclude this last patient
from the 'responder' analysis since the increase in CRP was
likely to be an important confounder in the serum proteomic
Arthritis Research & Therapy Vol 11 No 2 Dwivedi et al.
Page 4 of 11
(page number not for citation purposes)
analysis. Thus, subjects 10613, 10616, and 10623 were con-
sidered the most homogeneous responders (Rs), and for the
purposes of the proteomic analyses, the remaining subjects
were considered to be non-responders (NRs).
The aim of this study was to compare the protein composition
of the sera of RA patients at baseline (T0) and following 12
weeks of infliximab treatment (T12) to determine how protein
composition changed during this period. The sera were immu-
nodepleted of the 12 most abundant proteins as these pro-
teins constitute more than 90% of the serum protein content
by mass and their presence interferes with the identification of
potentially more informative lower abundance species [11,21].
Protein estimations indicated that there were reductions of
between 87% and 92% in the serum samples following IgY-
based immunodepletion (Additional data file 1). This was fur-
ther supported by a comparison of the SDS-PAGE analysis of
starting serum, IgY flow-through, and the retentate from the
same serum (see Additional data file 2 for representative
examples). Nevertheless, based on their subsequent identifi-
cation by MS, these high-abundance proteins were clearly not
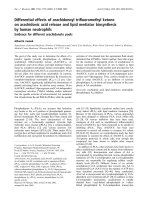
removed completely from the sera. The depleted serum sam-
ples were subsequently processed and labeled with iTRAQ
reagent as shown in the work flow outlined in Figure 1.
The MS-MS analysis identified an average total of 697 pro-
teins, of which 373 were identified with greater than or equal
to 95% confidence (Additional data file 3). Only the latter pro-
teins were used for quantitative comparisons. In total, 83 pro-
teins were identified in all samples, whereas 108 were
identified in 9 out of 10 samples. Importantly, within a given
patient set, there was almost complete correlation between
the proteins identified in the two serum samples. These data
indicate that the inter-individual differences in the serum pro-
teome are considerably larger than the intra-individual
differences.
In analyzing the paired samples, we assumed that the majority
of proteins would not substantially change in their relative lev-
els and that, as such, the ratio for most proteins would remain
at 1.0. Indeed, our analysis of these ratios indicated that nearly
80% of the proteins identified had a ratio of approximately 1.0,
suggesting that the majority of the identified proteins were not
significantly changed during treatment with infliximab. The
remaining 20% of proteins displayed some variability between
the T0 and T12 samples.
Analysis of proteome changes based on clinical
response
As indicated above, the clinical responses of the patients to
infliximab were heterogeneous. Based on the data shown in
Table 1 and the response criteria defined by Fransen and Van
Riel [20], the patients were classified as optimum Rs or NRs,
keeping in mind the limitations of the dichotomous classifica-
tion discussed above. Thus, for the purpose of this analysis,
patients 10613, 10616, and 10623 were classified in the R
group, with the remainder classified in the NR group. On this
basis, the proteins that changed significantly in either or both
groups are shown in Table 2. There was a downregulation in
the majority of these detected proteins, and where detected in
Table 1
Patients and their classification according to responses based on disease activity score and C-reactive protein level after 12 weeks
of infliximab treatment
Patient ID number DAS28 Δ DAS EULAR DAS28 response
a
CRP mg/L Δ CRP
Baseline (T0) Week 12 (T12) Baseline (T0) Week 12 (T12)
10611 5.7 5.2 0.5 NR 4.3 29.1 -24.8
10612 6.2 7.6 -1.4 NR 37.4 139.0 -101.6
10613 5.8 3.6 2.3 R 13.0 9.0 4.0
10616 6.8 3.9 2.9 R 46.0 1.0 45.0
10618 6.3 3.8 2.5 NR
b
43.3 52.0 -8.7
10619 3.2 3.7 -0.5 NR 6.0 8.0 -2.0
10620 4.9 5.1 -0.2 NR 17.1 2.3 14.8
10621 3.8 4.2 -0.5 NR 68.0 68.0 0.0
10622 6.0 6.6 -0.6 NR 24.4 86.2 -61.8
10623 6.2 4.5 1.7 R 51.3 12.4 38.9
a
Patients were deemed to be European League Against Rheumatism (EULAR) responders (Rs) if they had a reduction in DAS28 of greater than
or equal to 1.2; all others were considered non-responders (NRs) for analysis purposes.
b
Subject 10618 achieved a reduction in DAS28 of 2.5,
but C-reactive protein (CRP) level increased at T12; thus, to ensure homogeneity in the R group, we excluded this patient from the group. DAS,
disease activity score; DAS28, disease activity score using 28 joint counts.
Available online />Page 5 of 11
(page number not for citation purposes)
both groups, this was quantitatively larger in the R group
(Additional data file 4). Of note, the mean T12/T0 CRP ratio
was 1.39 in the NR group, which was consistent with a mean
increase in the CRP level of 26.3 mg/L as detected by neph-
elometry. A CRP ratio could not be accurately determined in
the R group analysis as this protein was not detected in the
T12 sample from 2 out of 3 patients with 95% confidence
score, P-value of 0.001–0.05 and EF ≤ 2.0. The T12/T0 ratio
for other proteins known to be associated with the acute-
phase response, such as ceruloplasmin and complement pro-
teins, was consistently lower in the R group compared with the
NR group, suggesting that with successful therapy there was
a greater reduction in the absolute levels compared with
baseline.
To understand the potential biological relevance of the
changes in protein expression in this group, we examined the
possible interactions of those proteins which were differen-
tially regulated following the treatment. Out of the complete list
of protein ratios identified in the R group (Additional data file
5) and the NR group (Additional data file 6), only those pro-
teins that had a greater than or equal to 95% confidence
score, P-value of less than or equal to 0.001 to 0.05, and an
effort factor (EF) value of less than or equal to 2.0 and that
were present in at least two thirds (≥66%) of this patient pop-
ulation were selected for pathway analysis. The output of
these analyses indicates known direct or indirect interactions
based on current literature and also serves to provide informa-
tion about pathological states in which these have been
observed.
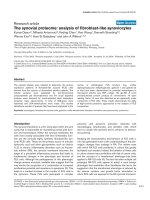
The 39 proteins identified in the R group, as shown in Table 2,
were included in the pathway analysis (proteins with ≥ 1.2 fold
ratio changes were used for network generation). This analysis
used 23 functions/pathway-eligible molecules and 22 network
generation-eligible molecules. As shown in Figure 2, the asso-
ciated network featured TNF-α and nuclear factor-kappa-B
(NF-κB) at the centre. The closest interacting partners of TNF-
α and NF-κB (either direct or indirect interaction shown by
solid or dashed arrows, respectively) were down-regulated.
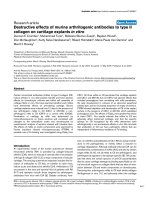
Moreover, the analysis indicated that the 'acute-phase
response signaling' canonical pathway was most significantly
affected in the R group, followed by the complement and
coagulation pathways, as shown in Figure 3. As noted above,
several of the complement proteins are acute-phase reactants
and can be categorized in the former pathway.
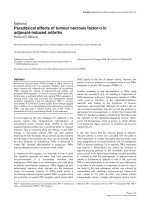
The 28 proteins identified in the NR group, as shown in Table
2, were similarly analyzed. These data are shown in Figure 4. It
should be noted that, although this network also featured TNF-
α prominently at the centre, the down-regulated molecules
were more distally associated, whereas the proximal proteins
such as CRP and apolipoprotein-A1 were up-regulated in this
group. Thus, the profile of the differentially regulated proteins
in the NR group was distinct from that of the R group. How-
ever, there were 2.7-fold fewer proteins that met the threshold
criteria for inclusion in the NR group than in the R group. This
may have excluded a number of interesting candidate proteins
that could serve to distinguish infliximab responders from non-
responders.
Figure 1
Experimental design of the studyExperimental design of the study. 2D LC, two-dimensional liquid chromatography; ESI-LC-MS/MS, electrospray ionization liquid chromatography
tandem mass spectrometry; iTRAQ, isobaric tagging for relative and absolute protein quantification; TNF-α, tumour necrosis factor-alpha.
Arthritis Research & Therapy Vol 11 No 2 Dwivedi et al.
Page 6 of 11
(page number not for citation purposes)
Table 2
Proteins with changes between week 12 and baseline identified in the responder and non-responder groups
Protein name Average ratio Protein ID
Responder Non-responder
Anti-thrombin III variant 1.27 0.86 gi|576554
Ceruloplasmin 0.80 0.95 gi|1620909
Complement component 3 0.84 0.92 gi|40786791
Complement component 5 0.89 0.94 gi|38016947
Complement component 7 precursor 0.65 0.89 gi|45580688
Complement factor H 0.82 1.06 gi|56203410
Keratin 1 1.72 0.69 gi|17318569
Keratin 2 1.60 0.70 gi|47132620
ORM2 0.52 0.64 gi|48145977
Orosomucoid 1 0.48 0.60 gi|55958974
Plasminogen 0.85 0.91 gi|56203917
Serum albumin precursor 0.72 1.18 gi|6013427
Unnamed protein product 1.10 0.86 gi|29581
Unnamed protein product 0.71 0.89 gi|1335098
Angiotensinogen (ser [or cys]) proteinase inhibitor 1.19 ND gi|37790798
Anti-(ED-B) scFV 1.19 ND gi|3152364
Apolipoprotein A1 0.69 ND gi|4960066
C1 inhibitor 0.74 ND gi|29535
CarboNDypeptidase N polypeptide 1 50 kD 0.73 ND gi|55960072
Carnosinase 1 0.8 ND gi|21071039
Coagulation factor NDII-Mie 1.11 ND gi|24899162
Complement C1s 0.89 ND gi|6407558
Complement component 1, r subcomponent 0.82 ND gi|23243256
Complement component 2 0.87 ND gi|55961814
Cystatin C 1.51 ND gi|296643
Hypothetical protein 1.17 ND gi|51476334
Insulin-like growth factor-binding protein 0.81 ND gi|19344010
Inter-alpha-trypsin inhibitor heavy-chain H1 0.89 ND gi|825630
Keratin 10 1.91 ND gi|40354192
Leucine-rich alpha-2-glycoprotein 1 0.68 ND gi|47125362
PeroNDiredoNDin 2 isoform b 0.52 ND gi|33188452
Serpin peptidase inhibitor 0.83 ND gi|50659080
Serpin peptidase inhibitor, clade F 0.79 ND gi|21594846
SERPINC1 protein 0.75 ND gi|18490839
Transferrin 0.72 ND gi|37747855
Transthyretin 1.44 ND gi|48145933
Unnamed protein product 0.87 ND gi|29888
Available online />Page 7 of 11
(page number not for citation purposes)
Discussion
The present study examined the effects of a standard clinical
infliximab therapy protocol on the serum proteome of RA
patients. Since the biological target of this therapeutic mono-
clonal antibody is clearly defined to be TNF-α, we anticipated
that this analysis might potentially provide mechanistic data on
the systemic effects of this intervention. The results demon-
strate the feasibility of this broad-based discovery approach,
but they also point out the inherent difficulties in reconciling
the clinical and biological effects of the treatment.
Inhibition of TNF-α has emerged as a highly effective therapy
in many RA patients who have not responded to other forms
of disease-modifying therapy such as methotrexate [4,5]. Yet
the clinical response to TNF-α inhibitors is heterogeneous, as
illustrated in the present study. Although the biological basis
for this heterogeneity remains largely unknown, it can be spec-
ulated that the clinical response encompasses systemic
effects as well as effects on the target tissue, the synovium. It
is commonly observed that infliximab infusion has dramatic
and rapid-onset effects on systemic features of RA such as
fatigue, even after a single intravenous infusion. In contrast, the
synovial effects of infliximab may not become apparent for sev-
eral weeks, possibly several months. The primary time point
chosen for analysis in this study, 12 weeks, is the point at
which the majority of patients have a clinical response. It
should be added that analysis of the clinical responses at sub-
sequent time points did not reveal major changes in the trends
observed at 12 weeks (data not shown).
Although numerous studies have attempted to define specific
biomarkers for disease activity and response to therapy in RA,
a limited number of proteomic studies have attempted to mine
the entire proteome of the serum or synovial fluid for candidate
biomarkers. One study used surface-enhanced laser desorp-
tion ionization (SELDI) to identify potential candidates and
demonstrated that an increase in myeloid-related protein 8,
possibly in a citrullinated form, was associated with RA, albeit
non-specifically [22]. Liao and colleagues [23] used a two-
dimensional LC MS/MS-based approach to analyze synovial
fluid proteins with molecular weights of less than 40 kDa from
patients with erosive or non-erosive RA (n = 5 per group). The
relative abundance of proteins was determined using spectral
counting. Subsequently, multiple reaction monitoring was
used to examine the sera of another 15 donors (normal, ero-
sive, and non-erosive RA) for the presence of the candidate
biomarkers identified in the original studies. There was an
increase in CRP and several S100 protein family calcium-bind-
ing proteins in the synovial fluids of patients with erosive RA
compared with those with non-erosive disease. It was also
observed that CRP, S100A8 (calgranulin A), S100A9 (cal-
granulin B), and S100A12 (calgranulin C) were markedly ele-
vated in the sera of patients with erosive disease compared
with the other groups.
Recently, a report comparing the proteome changes in sera of
RA patients immediately prior to and 24 hours after infusion
with infliximab was published [24]. Expression levels were
compared for proteins with molecular weights of less than 30
Vitamin D-binding protein precursor 0.88 ND gi|139641
Vitronectin 0.86 ND gi|14326449
Alpha1-anti-chymotrypsin ND 1.06 gi|1340142
Alpha-2-glycoprotein 1, zinc ND 0.82 gi|4502337
Apo-B100 precursor ND 1.5 gi|28780
Apolipoprotein H precursor ND 0.9 gi|4557327
Coagulation factor II precursor ND 0.91 gi|4503635
Complement component C8 beta chain precursor ND 0.91 gi|20141201
C-reactive protein ND 1.39 gi|30224
Hp2-alpha ND 0.47 gi|296653
IGHM protein ND 1.37 gi|49256421
Immunoglobulin kappa L chain VLJ region ND 1.38 gi|21669449
Mutant beta-globin ND 1.29 gi|18418633
Protein S alpha ND 0.88 gi|190442
SERPIND1 ND 0.84 gi|47678677
Unnamed protein product ND 0.88 gi|28375497
All proteins had a greater than or equal to 95% confidence score for identification, P-value of less than or equal to 0.001 to 0.05, and an EF value
of less than or equal to 2.0 and were present in two thirds of the patient group. ND, not determined. EF, error factor.
Table 2 (Continued)
Proteins with changes between week 12 and baseline identified in the responder and non-responder groups
Arthritis Research & Therapy Vol 11 No 2 Dwivedi et al.
Page 8 of 11
(page number not for citation purposes)
kDa. The relative quantitation was based on the number of sig-
nificant scoring peptides identified per protein, with increased
numbers of peptides being interpreted as an indication of
increased protein concentration. That study contrasts with
ours in that we used a depletion method that selectively
Figure 2
Ingenuity pathway analysis of proteins displaying alterations in expression patterns following infliximab treatment in patients deemed to be respondersIngenuity pathway analysis of proteins displaying alterations in expression patterns following infliximab treatment in patients deemed to be respond-
ers. (See Results for response definitions.) The network diagram shows the relationship between the indicated proteins by solid or dashed lines,
which represent direct or indirect interactions, respectively. Up-regulated proteins are shown in red, and down-regulated proteins are shown in
green. The network is centred on tumour necrosis factor-alpha (TNF-α) and nuclear factor-kappa-B (NF-κB) as reflected by the number of interac-
tions associated with these proteins.
Figure 3
Ingenuity pathway analysis showing canonical pathways of the 39 differentially expressed proteins after infliximab treatment in the responder groupIngenuity pathway analysis showing canonical pathways of the 39 differentially expressed proteins after infliximab treatment in the responder group.
The pathways are indicated on the y-axis. The x-axis indicates the significance score (negative log of P-value calculated using Fisher exact test). FXR,
farnesoid × Receptor; LXR, liver × receptor; PPARα, peroxisome proliferator activated receptor-alpha; Pt, patient; RXR, retinoid × receptor.
Available online />Page 9 of 11
(page number not for citation purposes)
removed the most abundant serum proteins, thus allowing us
to examine the full range of proteins. Moreover, we used a
quantitation method, iTRAQ, which directly compares relative
protein abundance rather than indirect comparative methods
such as peptide or spectral intensity counts. Arguably, the
most important difference between the two studies was the
timing of the second sample, with ours being at 12 weeks, a
time at which the clinical response to infliximab is evident.
Assessing the clinical response in individual RA patients is
challenging. In part, this is a result of the heterogeneity of clin-
ical states that are seen in RA and that are attributed to dis-
ease activity. Thus, an RA patient may feel subjectively better
with treatment and have fewer tender joints and yet continue
to have many swollen joints and elevated acute-phase reac-
tants, whereas another RA patient may experience exactly the
opposite. The two patients may demonstrate very similar
changes in composite indices such as the DAS28. The clinical
data generated in the context of the present study serve to
illustrate these difficulties. In attempting to define a dichoto-
mous R/NR outcome after 12 weeks of infliximab therapy, we
used one of the best-validated approaches to data analysis,
the EULAR response criteria [19]. Four individuals had sizable
reductions in their DAS28 scores (mean Δ DAS28 of 2.35),
although none achieved a 'good' EULAR response as they did
not achieve a DAS28 of less than 3.2 at the 12-week time
point. However, this pool of 4 Rs included an individual who,
despite a reduction of 2.5 in DAS28, actually had a CRP
increase at T12. We elected to exclude this individual from the
R group in order to achieve the greatest degree of biological
homogeneity in this group.
Since the present study focused on analyzing changes in the
serum proteome in response to infliximab therapy, correlation
with CRP level was particularly relevant to the analysis. CRP is
the most sensitive biomarker for systemic inflammation and is
widely used in clinical practice to guide RA therapy. In non-
inflammatory conditions, this protein is virtually undetectable in
the serum, and under the influence of pro-inflammatory
cytokines, particularly interleukin-6, CRP synthesis and secre-
tion by the liver increase several fold, along with a spectrum of
other proteins collectively classified as acute-phase reactants
[25]. This includes amyloid A protein, ceruloplasmin, hap-
toglobin, and several complement proteins. In the optimum-
response R group, CRP was generally undetectable in the
T12 samples and thus a ratio could not be derived. In the
paired serum samples from the NRs, the mean CRP ratio
detected by MS was 1.39, indicating an increase in CRP level,
which correlated well with the levels as determined by neph-
elometry. This suggests that the proteomic ratios were indeed
reflective of the actual protein levels in the serum. In the case
of ceruloplasmin and several complement proteins known to
be part of the acute-phase response, the ratios were consist-
ently lower in the R group than the NR group, further support-
ing this conclusion.
Figure 4
Ingenuity pathway analysis of proteins displaying alterations in expression patterns following infliximab treatment in patients deemed to be non-respondersIngenuity pathway analysis of proteins displaying alterations in expression patterns following infliximab treatment in patients deemed to be non-
responders. (See Results for response definitions.) A network analysis of the differentially expressed proteins in the non-responder group indicates
that, as with the responder network shown in Figure 2, tumour necrosis factor (TNF) is at the centre of the network but the down-regulated proteins
are more distal, whereas more proximal proteins such as C-reactive protein (CRP) are up-regulated.
Arthritis Research & Therapy Vol 11 No 2 Dwivedi et al.
Page 10 of 11
(page number not for citation purposes)
In contrast to these effects on acute-phase proteins, which
overall tended to follow expected patterns, a number of
detected proteins were down-regulated in both Rs and NRs.
These included SERPINC1, S100A8, PRDX2, C1R, APOA1,
SERPINF2, SERPING1, ORM1, and ORM2 (Table 2 and Fig-
ures 2 and 4). Of note, the changes in S100A8 were identified
by Sekigawa and colleagues [24] in their study of the short-
term effects of infliximab and were also reported by Liao and
colleagues [23] in their work to identify protein biomarkers for
RA. The SERPINs are a family of serine proteases involved in
a spectrum of biological pathways and are of particular rele-
vance to the coagulation pathway. Hereditary deficiencies in
SERPINC1 (anti-thrombin 3) are known to increase the risk of
thrombosis [26]. The overall impact of infliximab therapy on the
coagulation pathway is not well defined, but the available data
suggest that key pro-coagulant proteins are reduced [27,28].
This is potentially of considerable importance since RA is
known to increase the risk of thrombotic events such as myo-
cardial infarction and this risk may be modified by TNF-α inhib-
itors [29]. The proteomic data generated from this study do
not provide a clear indication of how the coagulation pathway
is impacted, particularly since serum rather than plasma was
analyzed. Nevertheless, the results do point to the fact that
TNF-α inhibition may impact on coagulation proteins, poten-
tially independently of its effects on inflammatory pathways.
The ultimate impact on the risk of thrombotic events requires
large longitudinal clinical studies.
In summary, we provide evidence that MS-based proteomic
techniques using a labeling method such as iTRAQ can be
used to generate quantitative data about the changes that
occur in the serum proteome in the context of targeted thera-
peutic interventions such as infliximab. Since serum is one of
the most complex biological fluids, depletion of high-abun-
dance proteins such as albumin and gammaglobulin is a key
step in allowing the detection of low-abundance but potentially
informative proteins. Our study also points out the inadequacy
of the currently available clinical methods for assessing dis-
ease activity in individual patients, particularly if the biological
basis of these responses is to be understood.
Conclusion
The present study demonstrates that a robust clinical
response to infliximab is associated with the downregulation of
a spectrum of serum proteins regulated by TNF-α, and pro-
vides a possible basis for defining the broader biological
effects of the treatment in vivo.
Competing interests
This work was funded, in part, by an unrestricted research
grant from Schering-Plough Canada (Kirkland, QC, Canada),
and HSE-G has served as a consultant on scientific advisory
boards for Schering-Plough Canada. The other authors
declare that they have no competing interests.
Authors' contributions
RCD designed the experiments, processed samples, acquired
and analyzed the data, and participated in writing the manu-
script. ND acquired the samples and the clinical data. OVK
performed the mass spectrometry and biochemical separa-
tions. JC performed the bioinformatics analysis. JAW
designed the study, analyzed the data, and participated in writ-
ing the manuscript. HSE-G designed the study, acquired clin-
ical data, analyzed the study results, and participated in writing
the manuscript. All authors read and approved the final
manuscript.
Additional files
The following Additional files are available online:
Additional file 1
Depletion efficiency and total amount of proteins
recovered (μg) from 30 μl of serum in flow through after
IgY-12 column treatment. The recovered proteins were
further used for proteomic analysis.
See />supplementary/ar2637-S1.doc
Additional file 2
SDS-PAGE analysis of proteins from serum and at
different stages of IgY-12 depletion. (Lane (1) Marker,
(2,5) Serum, (3,6) Flow through collected after depletion
of proteins from IgY-12 column, and (4,7) proteins eluted
from the column. Lane 2,3,4 represent T0 and lane 5,6,7
represent T12 stage of serum sample).
See />supplementary/ar2637-S2.tiff
Additional file 3
Summary of the Mass Spectrometry results for all 10
samples.
See />supplementary/ar2637-S3.doc
Additional file 4
Summary of the numbers of proteins observed displaying
alterations in expression levels following treatment (# of
proteins P ≤ 0.001–0.05, EF ≤ 2.0, ≥ 95% confidence
for identification).
See />supplementary/ar2637-S4.doc
Additional file 5
Proteins present in any of the R group that displayed ≥2
fold changes in relative expression levels. (P ≤ 0.001–
0.05, EF ≤ 2.0, ≥ 95% confidence for identification).
See />supplementary/ar2637-S5.doc
Available online />Page 11 of 11
(page number not for citation purposes)
Acknowledgements
Funding for this study was provided by the Canadian Arthritis Network
Centres of Excellence and by Schering-Plough Canada. Personal post-
doctoral fellowship support was provided to RCD by the Health Science
Foundation, Canada. The authors thank Donna Hart and Denise Jacobs
for their help in conducting the study and Keng Wong for his help in
sample processing.
References
1. Pincus T, Sokka T: Quantitative measures for assessing rheu-
matoid arthritis in clinical trials and clinical care. Best Pract
Res Clin Rheumatol 2003, 17:753-781.
2. Pincus T: The American College of Rheumatology (ACR) Core
Data Set and derivative 'patient only' indices to assess rheu-
matoid arthritis. Clin Exp Rheumatol 2005, 23:S109-S113.
3. Calabrese LH: Molecular differences in anticytokine therapies.
Clin Exp Rheumatol 2003, 21:241-248.
4. Singh R, Robinson DB, El-Gabalawy HS: Emerging biologic
therapies in rheumatoid arthritis: cell targets and cytokines.
Curr Opin Rheumatol 2005, 17:274-279.
5. Tracey D, Klareskog L, Sasso EH, Salfeld JG, Tak PP: Tumor
necrosis factor antagonist mechanisms of action: a compre-
hensive review. Pharmacol Ther 2008, 117:244-279.
6. Valesini G, Iannuccelli C, Marocchi E, Pascoli L, Scalzi V, Di FM:
Biological and clinical effects of anti-TNFalpha treatment.
Autoimmun Rev 2007, 7:35-41.
7. Marotte H, Gineyts E, Miossec P, Delmas PD: Effects of inflixi-
mab therapy on biological markers of synovium activity and
cartilage breakdown in patients with rheumatoid arthritis. Ann
Rheum Dis 2008 in press.
8. Ernestam S, af KE, Catrina AI, Sundberg E, Engstrom M, Klareskog
L, Ulfgren AK: Synovial expression of IL-15 in rheumatoid
arthritis is not influenced by blockade of tumour necrosis
factor. Arthritis Res Ther 2006, 8:R18.
9. Wijbrandts CA, Dijkgraaf MG, Kraan MC, Vinkenoog M, Smeets
TJ, Dinant H, Vos K, Lems WF, Wolbink GJ, Sijpkens D, Dijkmans
BA, Tak PP: The clinical response to infliximab in rheumatoid
arthritis is in part dependent on pretreatment tumour necrosis
factor alpha expression in the synovium. Ann Rheum Dis 2008,
67:1139-1144.
10. Kruithof E, Baeten D, Van Den BF, Mielants H, Veys EM, De KF:
Histological evidence that infliximab treatment leads to down-
regulation of inflammation and tissue remodelling of the syn-
ovial membrane in spondyloarthropathy. Ann Rheum Dis
2005, 64:529-536.
11. Anderson NL, Anderson NG: The human plasma proteome: his-
tory, character, and diagnostic prospects. Mol Cell Proteomics
2002,
1:845-867.
12. Arnett FC, Edworthy SM, Bloch DA, McShane DJ, Fries JF, Cooper
NS, Healey LA, Kaplan SR, Liang MH, Luthra HS: The American
Rheumatism Association 1987 revised criteria for the classifi-
cation of rheumatoid arthritis. Arthritis Rheum 1988,
31:315-324.
13. Aggarwal K, Choe LH, Lee KH: Shotgun proteomics using the
iTRAQ isobaric tags. Brief Funct Genomic Proteomic 2006,
5:112-120.
14. Zieske LR: A perspective on the use of iTRAQ reagent technol-
ogy for protein complex and profiling studies. J Exp Bot 2006,
57:1501-1508.
15. Spicer V, Yamchuk A, Cortens J, Sousa S, Ens W, Standing KG,
Wilkins JA, Krokhin OV: Sequence-specific retention calculator.
A family of peptide retention time prediction algorithms in
reversed-phase HPLC: Applicability to various chromato-
graphic conditions and columns. Analytical Chemistry 2007,
79:8762-8768.
16. Gilar M, Olivova P, Daly AE, Gebler JC: Orthogonality of separa-
tion in two-dimensional liquid chromatography. Anal Chem
2005, 77:6426-6434.
17. Dwivedi RC, Spicer V, Harder M, Antonovici M, Ens W, Standing
KG, Wilkins JA, Krokhin OV: Practical implementation of 2D
HPLC scheme with accurate peptide retention prediction in
both dimensions for high-throughput bottom-up proteomics.
Anal Chem 2008, 80:7036-7042.
18. DAS-score.nl [ />]
19. Van Riel PL, van Gestel AM, Putte LB van de: Development and
validation of response criteria in rheumatoid arthritis: steps
towards an international consensus on prognostic markers.
Br J Rheumatol 1996, 35(Suppl 2):4-7.
20. Fransen J, Van Riel PL: The Disease Activity Score and the
EULAR response criteria. Clin Exp Rheumatol 2005,
23:S93-S99.
21. Baussant T, Bougueleret L, Johnson A, Rogers J, Menin L, Hall M,
Aberg PM, Rose K: Effective depletion of albumin using a new
peptide-based affinity medium. Proteomics 2005, 5:973-977.
22. de Seny D, Fillet M, Meuwis MA, Geurts P, Lutteri L, Ribbens C,
Bours V, Wehenkel L, Piette J, Malaise M, Merville MP: Discovery
of new rheumatoid arthritis biomarkers using the surface-
enhanced laser desorption/ionization time-of-flight mass
spectrometry ProteinChip approach. Arthritis Rheum 2005,
52:3801-3812.
23. Liao H, Wu J, Kuhn E, Chin W, Chang B, Jones MD, O'Neil S,
Clauser KR, Karl J, Hasler F, Roubenoff R, Zolg W, Guild BC: Use
of mass spectrometry to identify protein biomarkers of dis-
ease severity in the synovial fluid and serum of patients with
rheumatoid arthritis. Arthritis Rheum 2004, 50:3792-3803.
24. Sekigawa I, Yanagida M, Iwabuchi K, Kaneda K, Kaneko H, Taka-
saki Y, Jung G, Sone S, Tanaka Y, Ogawa H, Takamori K: Protein
biomarker analysis by mass spectrometry in patients with
rheumatoid arthritis receiving anti-tumor necrosis factor-
alpha antibody therapy. Clin Exp Rheumatol 2008, 26:261-267.
25. Gabay C, Kushner I: Acute-phase proteins and other systemic
responses to inflammation. N Engl J Med 1999, 340:448-454.
26. Heijboer H, Brandjes DP, Buller HR, Sturk A, ten Cate JW: Defi-
ciencies of coagulation-inhibiting and fibrinolytic proteins in
outpatients with deep-vein thrombosis. N Engl J Med 1990,
323:1512-1516.
27. Ingegnoli F, Fantini F, Favalli EG, Soldi A, Griffini S, Galbiati V,
Meroni PL, Cugno M: Inflammatory and prothrombotic biomar-
kers in patients with rheumatoid arthritis: effects of tumor
necrosis factor-alpha blockade. J Autoimmun 2008,
31:175-179.
28. Agirbasli M, Inanc N, Baykan OA, Direskeneli H: The effects of
TNF alpha inhibition on plasma fibrinolytic balance in patients
with chronic inflammatory rheumatical disorders. Clin Exp
Rheumatol 2006,
24:580-583.
29. Giles JT, Post W, Blumenthal RS, Bathon JM: Therapy Insight:
managing cardiovascular risk in patients with rheumatoid
arthritis. Nat Clin Pract Rheumatol 2006, 2:320-329.
Additional file 6
Proteins present in any of the NR group that displayed ≥
2 fold changes in relative expression levels. (P ≤ 0.001–
0.05, EF ≤ 2.0, ≥ 95% confidence for identification).
See />supplementary/ar2637-S6.doc