Báo cáo y học: "Blood autoantibody and cytokine profiles predict response to anti-tumor necrosis factor therapy in rheumatoid arthriti" pps
Bạn đang xem bản rút gọn của tài liệu. Xem và tải ngay bản đầy đủ của tài liệu tại đây (1.35 MB, 13 trang )
Open Access
Available online />Page 1 of 13
(page number not for citation purposes)
Vol 11 No 3
Research article
Blood autoantibody and cytokine profiles predict response to
anti-tumor necrosis factor therapy in rheumatoid arthritis
Wolfgang Hueber
1,2
, Beren H Tomooka
1,2
, Franak Batliwalla
3
, Wentian Li
3
, Paul A Monach
4,5
,
Robert J Tibshirani
6
, Ronald F Van Vollenhoven
7
, Jon Lampa
7
, Kazuyoshi Saito
8
, Yoshiya Tanaka
8
,
Mark C Genovese
1
, Lars Klareskog
7
, Peter K Gregersen
3
and William H Robinson
1,2
1
Department of Medicine, Division of Immunology & Rheumatology, Stanford University, 269 Campus Drive, mail code 5166, Stanford, CA 94305,
USA
2
GRECC, VA Palo Alto Health Care Systems, 3801 Miranda Ave, mailstop 154R, Palo Alto, CA 94304, USA
3
Feinstein Institute of Medical Research, North Shore LIJ Health System, 350 Community Drive, Manhasset, NY 11030, USA
4
Joslin Diabetes Center, One Joslin Place, Boston, MA 02215, USA
5
Brigham and Women's Hospital, 75 Francis Street, Boston, MA 02115 USA
6
Department of Statistics, 390 Serra Mall, Stanford University, Stanford, CA 94305, USA
7
Karolinska Institutet, Building D2:02, SE-171 76 Stockholm, Sweden
8
First Department of Internal Medicine, University of Occupational & Environmental Health, 1-1 Iseigaoka, Yahata-nishi, Kitakyushu 807-8555, Japan
Corresponding author: Wolfgang Hueber,
Received: 7 Dec 2008 Revisions requested: 21 Jan 2009 Revisions received: 4 May 2009 Accepted: 21 May 2009 Published: 21 May 2009
Arthritis Research & Therapy 2009, 11:R76 (doi:10.1186/ar2706)
This article is online at: />© 2009 Hueber et al.; licensee BioMed Central Ltd.
This is an open access article distributed under the terms of the Creative Commons Attribution License ( />),
which permits unrestricted use, distribution, and reproduction in any medium, provided the original work is properly cited.
Abstract
Introduction Anti-TNF therapies have revolutionized the
treatment of rheumatoid arthritis (RA), a common systemic
autoimmune disease involving destruction of the synovial joints.
However, in the practice of rheumatology approximately one-
third of patients demonstrate no clinical improvement in
response to treatment with anti-TNF therapies, while another
third demonstrate a partial response, and one-third an excellent
and sustained response. Since no clinical or laboratory tests are
available to predict response to anti-TNF therapies, great need
exists for predictive biomarkers.
Methods Here we present a multi-step proteomics approach
using arthritis antigen arrays, a multiplex cytokine assay, and
conventional ELISA, with the objective to identify a biomarker
signature in three ethnically diverse cohorts of RA patients
treated with the anti-TNF therapy etanercept.
Results We identified a 24-biomarker signature that enabled
prediction of a positive clinical response to etanercept in all
three cohorts (positive predictive values 58 to 72%; negative
predictive values 63 to 78%).
Conclusions We identified a multi-parameter protein biomarker
that enables pretreatment classification and prediction of
etanercept responders, and tested this biomarker using three
independent cohorts of RA patients. Although further validation
in prospective and larger cohorts is needed, our observations
demonstrate that multiplex characterization of autoantibodies
and cytokines provides clinical utility for predicting response to
the anti-TNF therapy etanercept in RA patients.
Introduction
Rheumatoid arthritis (RA) is a prototypical systemic autoim-
mune disease that affects 1% of the world population. TNF
antagonists have become the most widely used biological
therapies for patients with RA [1]. Based on criteria to quantify
response to therapy with disease-modifying anti-rheumatic
drugs [2], 30 to 50% of patients achieved an ACR50 or
greater response to anti-TNF therapies in sentinel clinical trials
[3-5]. American College of Rheumatology (ACR) response cri-
teria are a composite index of measures indicative of the per-
centage improvement over baseline that was achieved by an
individual patient while on treatment for at least 12 weeks, with
ACR: American College of Rheumatology; COMP: cartilage oligomeric matrix protein; ELISA: enzyme-linked immunosorbent assay; IL: interleukin;
MCP-1: monocyte chemoattractant protein-1; PAM: prediction analysis of microarrays; PBS: phosphate-buffered saline; RA: rheumatoid arthritis;
SAM: significance analysis of microarrays; TNF: tumor necrosis factor.
Arthritis Research & Therapy Vol 11 No 3 Hueber et al.
Page 2 of 13
(page number not for citation purposes)
ACR20 the primary measure of efficacy [6]. Clinical trials,
however, generally focus on homogeneous populations that
frequently include more severely ill patients who are more likely
to show statistically significant improvement over placebo
[7,8]. In contrast, large observational studies of the mixed pop-
ulations of RA patients typical of clinical practice indicate that
longer term response rates to anti-TNF therapies may be con-
siderably lower than those reported in these landmark clinical
trials [7-10].
Great need exists for molecular biomarkers for the prediction
of response to anti-TNF therapies, and a number of candidate
markers are currently under investigation, including genetic
and protein markers [11]. RA is associated with the produc-
tion of multiple autoantibody specificities and the dysregula-
tion of multiple cytokines, which are both present in the serum
proteome in RA patients [12]. Since cytokines and potentially
autoantibodies contribute to the pathogenesis of RA, we rea-
soned that characterization of spectra of serum autoantibod-
ies and cytokines, rather than characterizing the entire serum
proteome, might yield tractable biomarkers for guiding anti-
TNF therapy in RA.
We previously reported the development of antigen microar-
rays and application of these arrays to characterize autoanti-
body phenotypes associated with a variety of autoimmune
diseases [13]. We further developed RA antigen microarrays,
and applied these arrays to identify autoantibody profiles that
molecularly stratify RA patients into clinical subgroups [14].
We have also demonstrated the utility of blood cytokine profil-
ing to subclassify patients with early RA, and demonstrated an
association of elevated blood levels of the proinflammatory
cytokines TNF, IL-1β, IL-6, IL-13, IL-15 and granulocyte- mac-
rophage colony-stimulating factor with autoantibody targeting
of citrullulinated antigens [12].
In the present report, we describe application of a multi-step
proteomics approach using RA antigen arrays and cytokine
arrays to discover and validate a multivariable biomarker for
prediction of response to the anti-TNF therapy etanercept,
using sera derived from three independent cohorts of patients
with RA. The workflow of the studies is outlined in Figure 1.
Materials and methods
Patient sera
Pretreatment sera from three cohorts of patients with the diag-
nosis of RA based on the ACR classification criteria [15], who
were initiated on therapy with the anti-TNF therapy etanercept
(Enbrel
®
, Amgen, Thousand Oaks, CA, USA), were analyzed
using synovial antigen microarrays (except for the third
cohort), ELISAs, and a multiplex 12-cytokine bead assay. The
cytokines assayed were selected based on previous screen-
ing studies using a 22-cytokine assay [12].
The three cohorts included 29 Caucasian patients from the
ABCoN cohort of the North American Rheumatoid Arthritis
Consortium (US cohort), 43 Caucasian patients seen at
Swedish tertiary care centers and collected through the Karo-
linska-lead EiRA initiative (Swedish cohort), and 21 Japanese
patients (Japanese cohort). The patients' demographic, clini-
cal and serologic characteristics are summarized in Table 1
and Additional data file 1. All patients signed informed consent
and all sera were collected under and in accordance with Insti-
tutional Review Board-approved protocols at each institution.
Blood samples were obtained at baseline (pretreatment sam-
ple) and at least 3 months after initiation of therapy with etaner-
cept. Analysis of the pretreatment samples was performed for
the present study. Response to therapy with etanercept was
assessed at least 3 months after etanercept was started,
based on the ACR criteria for improvement [2]. All samples
were immediately aliquoted upon receipt at the Stanford
research laboratory, and separate aliquots were used for each
assay to minimize the effects of additional freeze- thaw cycles.
Cytokine assay
All cytokine measurements were performed using the Luminex
×200 platform, following a previously described optimized
assay protocol [12]. Briefly, to minimize potential false-positive
elevations of cytokine measurements due to rheumatoid factor
and other heterophilic antibodies that can cross-link the cap-
ture and detection antibodies, HeteroBlock
®
was added to
achieve a final concentration of 3 μg/ml, as previously
described in detail [12]. For the studies performed herein, we
utilized a custom 12-plex human cytokine FLEX
®
kit (Upstate,
Millipore, Billerica, MA, USA) that included beads specific for
TNFα, IL-1α, IL-1β, IL-6, IL12p40, IL-12p70, IL-15, granulo-
cyte- macrophage colony-stimulating factor, fibroblast growth
factor-2 (FGF-2), monocyte chemoattractant protein-1 (MCP-
1), eotaxin, and IFNγ-inducible protein 10.
RA antigen microarrays
The production of RA antigen microarrays was previously
described in detail [13,14]. Briefly, more than 500 peptides
and proteins representing candidate autoantigens in RA were
printed at 0.2 μg/μl onto derivatized Epoxy ArrayIt
®
micro-
scope slides (ArrayIt
®
; TeleChem International Inc., Sunny-
vale, CA, USA) using a robotic arrayer. The arrays were
blocked and probed with sera at 1:200 dilutions, and bound
serum autoantibodies detected using Cy3-conjugated goat
anti-human IgG secondary antibodies (Jackson ImmunoRe-
search Laboratories, Inc. West Grove, PA, USA). Probed
arrays were scanned with a GenePix 4000B scanner (MDS
Analytical Technologies, Sunnyvale, CA, USA), and antibody
reactivities quantified using GenePix Pro 5.0 software.
Peptides cfc(48–65)cit1 (shown in Figure 1) and peptides
cfc(48–65)cit2 (listed in Table 2) are identical except for a dif-
ference in the degree of citrullination: cfc(48–65)cit1 has one
Available online />Page 3 of 13
(page number not for citation purposes)
arginine residue citrullinated, and cfc(48–65)cit2 has two
arginine residues citrullinated.
Enzyme-linked immunsorbent assay
Peptides and fibrinogen protein from human plasma (Calbio-
chem, Gibbstown, NJ, USA) were coated onto medium-bind-
ing 96-well flat-bottom polystyrene plates (Costar, Corning
Inc, Corning, NY, USA) at 1 μg peptide/ml at 4°C overnight.
Plates were then washed and blocked for 1 hour at room tem-
perature using 5% dry milk in PBS, and incubated for 90 min-
utes using serum at 1:200 dilution in PBS. Horseradish
peroxidase-conjugated anti-human IgG secondary antibodies
(horseradish peroxidase-conjugated goat anti-human IgG,
Fcγ-fragment specific; Jackson Immuno Research Laborato-
ries Inc., West Grove, PA, USA) were used at 1:20,000 dilu-
tions, and bound autoantibodies were detected by
chemoluminescence (Onestep
®
TMB ELISA; Pierce, Rock-
ford, IL, USA).
Data analysis
The data analysis was performed using significance analysis of
microarrays (SAM) (version 1.21) and prediction analysis of
microarrays (PAM) (version 1.23), and the hierarchical cluster-
ing software Cluster
®
and TreeView
®
[16], as described previ-
ously [14,17]. PAM uses internal cross-validation by which
90% of the training samples are randomly selected 10 times,
followed by one-by-one class prediction of the remaining 10%
of samples, thus identifying classification errors and overfitting
[18]. PAM was used in the training, cross-validation and pre-
diction analyses described. The general-purpose statistical
package R has also been used for the analysis [19].
Non-normalized datasets were used for all analyses in the arti-
cle. Although this approach limits the ability to detect differ-
ences in the low signal intensity range, the rationale for this
approach is based on the observation that high-level reactivi-
ties became significantly distorted when z-normalization pro-
cedures were applied.
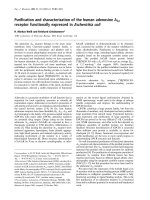
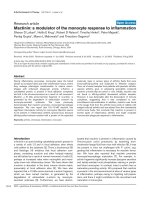
Figure 1
Workflow of experiments and types of analysisWorkflow of experiments and types of analysis. Upper panel: in the discovery steps, synovial antigen microarrays and multiplex cytokine assays were
employed to determine candidate molecules that are differentially expressed in pretreatment sera of etanercept responders (≥ ACR50) and nonre-
sponders (< ACR20). Multiple array experiments were performed, each followed by significance analysis of microarrays (SAM) to identify the high-
est-scoring discriminators. Middle panel: further testing was performed with three independent cohorts using standard ELISAs, followed by
prediction of response in three cohorts of etanercept-treated patients using prediction analysis of microarrays (PAM). Bottom panel: for training and
testing, PAM was used to identify the best discriminators (training step; which identified a 24-biomarker panel) and then the utility of these discrimi-
nators for predicting response to etanercept was determined (testing). ACR, American College of Rheumatology response.
Arthritis Research & Therapy Vol 11 No 3 Hueber et al.
Page 4 of 13
(page number not for citation purposes)
Results
Expansion of RA antigen microarrays for profiling
autoantibodies in RA sera
To further develop previously-described RA autoantigen
microarrays [14], we expanded the number of peptide and
protein autoantigens on the arrays. The arrays used in the
experiments described herein were 2,180-feature arrays that
include > 540 proteins and peptides, representing the follow-
ing candidate RA antigens: biglycan; decorin; fibromodulin;
clusterin; osteoglycin; fibrinogen; type I, type II, and type V col-
lagens; vimentin; filaggrin; serine protease 11; apolipoprotein
E; calpastatin; glucose-6-phosphate isomerase; heat shock
proteins HSP60, HSP70, HSP90, and BiP; hnRNP-A2/B1;
histones H2A and H2B; and cartilage oligomeric matrix pro-
tein (COMP), vitronectin and fibronectin. Candidate antigens
were selected based on literature searches and screening
experiments. Briefly, for the antigen screening experiments,
immune complexes were isolated from RA cartilage and syno-
vial tissues, and the protein antigens contained in the synovial
immune complexes were identified by mass spectrometry (PM,
manuscript in preparation). Identified proteins were, when
available, purchased from commercial sources and peptides
representing the candidate antigens synthesized for printing
on arrays. Overlapping 20-amino acid peptides, both native
and containing citrulline substitutions, were synthesized on a
commercial custom peptide synthesis platform using Fmoc
chemistry (PepScreen
®
; Sigma Genosys, St Louis, MO,
USA).
In line with and expanding earlier results using smaller 225-
antigen arrays, we observed on the > 540-antigen arrays spe-
cific and differential serum autoantibody reactivities to COMP,
clusterin, osteoglycin, apolipoprotein E, histones H2A and
H2B, serine protease 11, and other candidate antigens. Rep-
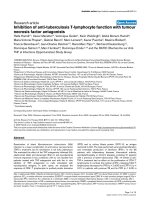
resentative array images of antibody reactivities are shown for
sera from two different patients with RA; one patient that
exhibited low serum autoantibody reactivity (Figure 2a) and
another that exhibited high serum autoantibody reactivity (Fig-
ure 2b). A selection of antigen targets that were differentially
recognized by serum antibodies in patients RA1 and RA2 are
highlighted in the figures in colored boxes (Figure 2a, b).
Selected array reactivities include citrullinated peptides (cfc1,
reactive with anti-cyclic citrullinated peptide antibody-positive
RA serum) and native control peptides (cfc0, no reactivity with
RA sera). Features were normalized to IgG/M, and quantifica-
tion of the highlighted features is summarized in Figure 2c.
To determine the correlation of antigen array and ELISA
results from a subset of peptide antigens, several native and
citrulline-substituted peptides were tested in ELISA experi-
ments. We observed moderate to strong correlations for these
peptide antigens, with correlation coefficients R
2
ranging from
0.49 for clusterin(386–405)cit to > 0.92 for hFibA(211–
230)cit (see Additional data file 2).
Exploratory profiling using samples from the ABCoN
cohort
Pretreatment autoantibody profiles differentiate anti-TNF
therapy responders from nonresponders
We screened 29 pretreatment serum samples from the
ABCoN cohort using RA antigen microarrays. SAM identified
differential pretreatment levels of autoantibodies that were
present at elevated levels in etanercept responders (response
≥ ACR50) as compared with nonresponders (response, <
ACR20). A representative result of the top-scoring SAM-iden-
Table 1
Demographic, clinical and serologic characteristics of the three
cohorts
Cohort Parameter
US-based (ABCoN)
Age (years) 50 (35 to 78)
Female sex 23 (79)
CCP2 56.6 (1.2 to 500)
CRP (mg/l) 60 (2 to 79)
ACR response < 20 15 (51.7)
ACR response > 50 14 (48.3)
Shared epitope present 16/24 (66)
Disease duration (months) 96 (12 to 396)
Swedish
Age (years) 54 (32 to 77)
Female sex 34 (79)
CCP2 n.d.
CRP (mg/l) 37.5 (10 to 166)
ACR response < 20 19 (44.2)
ACR response > 50 24 (55.8)
Shared epitope present n.d.
Disease duration (months) 108 (1 to 464)
Japanese
Age (years) 56 (24 to 76)
Female sex 20 (95%)
CCP2 n.d.
Rheumatoid factor (units) 66.9 (14.9 to 1,675)
CRP (mg/l) 55 (33 to 75)
ACR response < 20 9/21 (29.0)
ACR response > 70 12/21 (38.7)
Shared epitope present n.d.
Disease duration (months) 151 (11 to 444)
Data presented as median (range) or n (%). ACR, American College
of Rheumatology; CCP, cyclic citrullinated peptide; n.d., not
determined.
Available online />Page 5 of 13
(page number not for citation purposes)
tified autoantigens (false discovery rate (q values) ≤ 4.3%) is
presented in Figure 3, and hierarchical cluster analysis was
performed to organize and visualize relationships between
samples and antigens (Cluster
®
software). A compiled list of
the top-scoring antigens identified in multiple screening exper-
iments is presented in Table 2. The SAM-identified top-scoring
antigens were overlapping but were not completely identical
between array screening experiments. While all of the antigens
presented in Table 2 were identified as top scorers in multiple
array experiments, a few were ranked below the threshold for
the top-scoring antigens identified in the experiment used to
generate the representative cluster shown in Figure 3.
Cytokine profiling using a bead-array system
We performed multiplex cytokine profiling using the Luminex
bead array system and methods previously optimized to mini-
mize the impact of rheumatoid factor [12]. Our analysis of 12
cytokines in the initial 29 ABCoN samples characterized did
not reveal significant differences between responders and
nonresponders based on both linear regression as well as
SAM and PAM analysis, probably due to a substantial number
of patients with very low or undetectable levels of many of the
cytokines (data not shown). When 64 further samples from
etanercept-treated patients from two additional cohorts
became available, and cytokine profiling results from this larger
Table 2
Candidate biomarkers identified in array screening experiments, subsequently used for training and cross-validation in PAM
Variable Peptide sequence SwissProt ID
Autoantigens
Acetyl-calpastatin(184–203) Ace-DPMSSTYIEELGKREVTIPP- [NH]
2
[Swiss-Prot:P20810]
Apolipoprotein E(277–296)cit A [cit]LKSWFEPLVEDMQ [cit]QWAG [Swiss-Prot:P02649
]
Cfc(48–65)cit2 TIHAHPGS [cit]RGG [cit]HGYHH [Swiss-Prot:P20930
]
Clusterin(170–188) QTHMLDVMQDHFSRASSID [Swiss-Prot:P10909
]
Clusterin(334–353)cit2 AE [cit]LT [cit]KYNELLKSYQWKML [Swiss-Prot:P10909
]
Fibrinogen A(616–635)cit3 THSTK [cit]GHAKS [cit]PV [cit]GIHTS [Swiss-Prot:P02671
]
Fibromodulin(246–265) LEQLYMEHNNVYTVPDSYFR [Swiss-Prot:Q06828
]
H2B/e(1–20) MPEPVKSAPVPKKGSKKAIN [Swiss-Prot:Q16778
]
HSP60(287–297) VLNRLKVGLQV [Swiss-Prot:P10809
]
Osteoglycin(176–195) NQLLKLPVLPPKLTLFNAKY [Swiss-Prot:P20774
]
Serine protease 11(433–452) VIISINGQSVVSANDVSDVI [Swiss-Prot:Q92743
]
Biglycan(247–266) EDLLRYSKLYRLGLGHNQIR [Swiss-Prot:P21810
]
Cartilage oligomeric matrix protein(453–472) NSAQEDSDHDGQGDACDDDD [Swiss-Prot:P49747
]
Fibrinogen cit n.a. [Swiss-Prot:P02671
]
Cytokines and chemokines
Eotaxin n.a. [Swiss-Prot:P51671
]
Fibroblast growth factor-2 n.a. [Swiss-Prot:P09038
]
Granulocyte- macrophage colony-stimulating factor n.a. [Swiss-Prot:P04141
]
IL-12p40 n.a. [Swiss-Prot:P29460
]
IL-12p70 n.a. [Swiss-Prot:P29459
]
IL-15 n.a. [Swiss-Prot:P40933
]
IL-1α n.a. [Swiss-Prot:P01583
]
IL-1β n.a. [Swiss-Prot:P01584
]
IL-6 n.a. [Swiss-Prot:P05231
]
IFNγ-inducible protein 10 n.a. [Swiss-Prot:P02778
]
TNFα n.a. [Swiss-Prot:P01375
]
Monocyte chemoattractant protein-1 n.a. [Swiss-Prot:P13500
]
n.a., not applicable; PAM, prediction analysis of microarrays.
Arthritis Research & Therapy Vol 11 No 3 Hueber et al.
Page 6 of 13
(page number not for citation purposes)
set of samples were analyzed by regression analysis, however,
significant differences in baseline cytokine levels were identi-
fied in responders (response ≥ ACR50) as compared with
nonresponders (response ≤ ACR20). These results are pre-
sented in detail below.
Combinations of autoantibody and cytokines improve
differentiation of etanercept responders from
nonresponders
To determine whether combinations of cytokines and autoan-
tibodies might provide superior differentiation of pretreatment
samples derived from etanercept responders and nonre-
sponders, we next performed SAM analysis on integrated anti-
gen array and cytokine datasets obtained for the 29 ABCoN
samples. This analysis demonstrated that a panel of antigens
and cytokines more effectively differentiated baseline samples
derived from responders and nonresponders (q < 3; data not
shown). Based on these preliminary observations, combined
autoantibody and cytokine analyses were used in the subse-
quent experiments outlined below with the objective to
develop a multi-parameter biomarker for predicting response
to etanercept therapy.
Autoantibody and cytokine profiling of pretreatment
samples derived from three cohorts
In the next series of experiments, we utilized pretreatment sam-
ples from three independent cohorts of etanercept new-start
RA patients. These cohorts included the US-based ABCoN
cohort, a Swedish cohort, and a Japanese cohort.
Analysis of cytokines
In a first step, concentrations of 12 cytokines were measured
and analyzed by logistic regression in all 93 pretreatment sam-
ples derived from the three independent cohorts. When
cytokine results from baseline samples derived from respond-
ers and nonresponders were compared, TNF and IL-15 were
elevated in responders as compared with nonresponders (P <
0.05), while MCP-1 and IL-6 exhibited a trend towards being
elevated in responders as compared with nonresponders (P <
0.1).
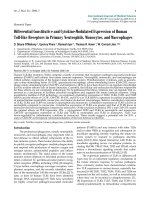
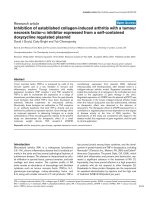
Figure 2
Rheumatoid arthritis antigen microarraysRheumatoid arthritis antigen microarrays. Rheumatoid arthritis (RA) antigen microarrays were used for autoantibody profiling of sera derived from
patients with RA prior to initiation of etanercept therapy. (a), (b) Array results from two representative RA patients. Yellow features are false-colored
features utilized for array orientation, while green features represent autoantibody reactivities. Selected autoantibody reactivities are highlighted in
colored boxes. (c) Quantification of the highlighted features. ApoE, apolipoprotein E; COMP, cartilage oligomeric matrix protein.
Available online />Page 7 of 13
(page number not for citation purposes)
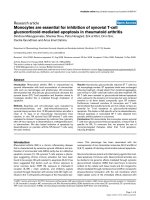
To visualize results from logistic regression analysis of
cytokines from all three cohorts, Figure 4 presents trendlines
for six of the 12 cytokines in all three cohorts. The grey dots in
Figure 4 demonstrate the best-fit logistic regression curve.
The x values indicate cytokine concentrations, while in the y
dimension an artificial noise value was added to achieve better
visual separation of the actual cytokine values. Overall, the
trends for all analyzed cytokines showed higher baseline
serum concentrations in the responders as compared with the
nonresponders (grey trendlines in all panels of Figure 4; see
also Additional data file 3).
The classification error rates, however, were determined to be
39.8% to 48.4%; thus, taken alone, pretreatment blood
cytokine levels appear to be of no practical utility in classifying
the likelihood for response to etanercept therapy. We con-
cluded that only in combination with other biomarkers do pre-
treatment blood cytokine concentrations contribute to a
predictive biomarker signature for response to etanercept.
Analysis of autoantibodies only
Based on the initial RA antigen array experiments in the
ABCoN cohort described above, to further test candidate anti-
body biomarkers with the greatest predictive utility we devel-
oped peptide ELISAs for the most promising peptide antigens.
All 93 pretreatment samples from etanercept new-start
patients were analyzed with these ELISAs, and the relative
autoantibody measurements optical density (OD) values were
used for further analyses. Since relative expression levels were
the primary measure of interest for these assays, no standard
curves for calculation of antibody concentrations were devel-
oped. All measurements from the single-antigen ELISAs were
combined with the measurements from the bead-array
cytokine assay for integrated analysis of cytokine and autoan-
tibody profiles in baseline samples derived from all three
cohorts of etanercept new-start RA patients.
Combined autoantibody and cytokine profiles are most
predictive for response to etanercept in three independent
cohorts
PAM with error plots of training and cross-validation are shown
in Figure 5. To illustrate their parallelism, the graphs for training
and cross-validation were overlaid and presented in one
image. A threshold was determined that allowed optimal seg-
regation of the pretreatment samples derived from responders
and nonresponders; the prediction threshold that enabled
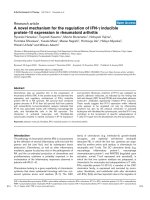
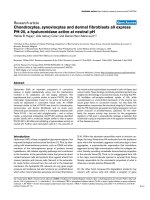
Figure 3
Elevated pretreatment autoantibody profiles in etanercept responders compared with nonresponders in the ABCoN cohortElevated pretreatment autoantibody profiles in etanercept responders compared with nonresponders in the ABCoN cohort. Significance analysis of
microarrays (SAM) and hierarchical clustering were applied to identify and display autoantibody profiles that differentiate etanercept responders
from nonresponders; results from one of several representative experiments are presented. SAM was utilized to identify antigens with statistical dif-
ferences in antibody reactivity between etanercept responders (≥ ACR50) and nonresponders (< ACR20), and the statistically significant hits are
listed to the right of the heatmap (false discovery rate q < 4.3%). The SAM-identified variables and individual patients were then hierarchically clus-
tered, and results presented in tree dendrograms that represent the relationships in reactivities between patients as well as between antigens. Red
font, citrullinated antigens; black font, native antigens. Patients are listed across the top of the heatmap image, and the ACR response rate for each
patient is indicated. Red bar, responder cluster; green bar, nonresponder cluster. Numbers of misclassified samples are shown for each cluster.
Array fluorescence units are color coded and indicated in the bar in the right upper corner of the image. ACR, American College of Rheumatology
response; CCP, cyclic citrullinated peptide.
Arthritis Research & Therapy Vol 11 No 3 Hueber et al.
Page 8 of 13
(page number not for citation purposes)
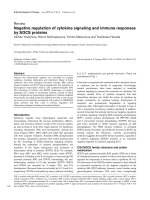
Figure 4
Elevated pretreatment blood cytokines are associated with response to etanercept therapyElevated pretreatment blood cytokines are associated with response to etanercept therapy. Logistic regression analysis was applied to cytokine
measurements in 93 samples derived from three cohorts of etanercept new-start rheumatoid arthritis patients. Green circles, samples from the Japa-
nese cohort; red circles, samples from the ABCoN cohort; blue circles, samples from the Swedish cohort; grey circles, the best-fit logistic regres-
sion curve; x values, actual cytokine concentrations; y values, an artificial noise value was added to achieve better visual separation of the actual
cytokine values. P values are shown for each cytokine. The grey bar links the actual responder or nonresponder label of a sample with the logistic
regression result of the same sample (probability of being a responder). For better readability, only six cytokines are shown. MCP-1, monocyte che-
moattractant protein-1.
Available online />Page 9 of 13
(page number not for citation purposes)
best differentiation with the minimal number of predictors was
identified to be 0.14 (T
(0.14)
) (Figure 5, vertical bar). Twenty-
four parameters were included in the signature at T
(0.14)
, and
the PAM rank list of these parameters including their corre-
sponding scores for responders and nonresponders are
shown in Figure 6b. The list comprised 13 antigens and 11
cytokines.
To further test the biomarker signature identified at T
(0.14)
, and
to determine its utility for prediction of response in each cohort
independently, the 24-parameter classifier was then applied to
the three cohorts individually. Prediction probabilities were
calculated for the responder and nonresponder classes. Clas-
sification errors as well as positive predictive values and neg-
ative predictive values are shown in the corresponding tables
for each cohort (Figure 6c). In summary, the positive predictive
value ranged from 58% (Japanese cohort) to 72% (ABCoN),
and the negative predictive value ranged from 63% (Swedish
cohort) to 78% (Japanese cohort).
Discussion
We describe the proteomic screening and discovery of a 24-
biomarker signature in pretreatment samples derived from RA
patients for class prediction of response to therapy with the
anti-TNF therapy etanercept. We developed and tested the
signature using three independent population-based cohorts
from the USA, Sweden and Japan. Our results indicate that
the 24-variable biomarker has utility to predict good to excel-
lent response to etanercept therapy (equivalent to response ≥
ACR50 for the ABCoN and Swedish cohorts, and to response
≥ ACR70 for the Japanese cohort), and to predict lack of
response to etanercept therapy (response < ACR20). This
biomarker signature enabled superior pretreatment classifica-
tion of response in three ethnically diverse cohorts, in compar-
ison with a theoretical benchmark based on clinical
observation and previous experience in population-based
cohorts (one-third of patients no response, one-third of
patients partial response, and one-third of patients good
response).
Identification of clinical predictors and development of molec-
ular biomarkers have been hampered by many factors, includ-
ing the molecular complexity and clinical heterogeneity of RA,
the inherent difficulty in classifying response to therapy that
appears random and does not follow a Gaussian distribution
[20], and the lack of enabling technologies to broadly screen
for potential biomarkers. Several single-cohort studies
reported associations of acute phase parameters [21],
genetic factors [22], Fcγ receptor type IIIA polymorphisms
[23], – 308 TNFα gene polymorphisms [24], and rheumatoid
factor or anti-citrulline autoantibody titers [25] with response
to anti-TNF therapies. Nevertheless, studies investigating mul-
tiple cohorts using proteomic-scale biomarker signatures have
not yet been reported. Although providing great potential,
genomic and proteomic profiles identified in single cohorts of
patients have frequently failed to replicate when subsequently
applied to independent cohorts [26].
To address this unmet clinical need and some of the above-
mentioned limitations, we applied proteomics technologies to
characterize pretreatment samples from three independent
cohorts, whereby all patients were treated with a single anti-
TNF therapy (etanercept).
Using data from all three cohorts, we identified a panel of pro-
teins, characterized by elevations of both serum antibody and
cytokine concentrations, which were associated with patients
who exhibited clinically good response (≥ ACR50) and excel-
lent response (≥ ACR70) to etanercept therapy (positive pre-
dictive value = 58 to 71%). In contrast, patients who exhibited
minimal or no significant response to etanercept therapy after
3 months or more were found to predominantly lack this
biomarker signature (response < ACR20; negative predictive
value = 63 to 78%).
The RADIUS program – the Rheumatoid Arthritis DMARD
Intervention and Utilization Study [8], which follows two multi-
center observational registries of thousands of RA patients
Figure 5
Identification of a 24-antibody and cytokine biomarker that differenti-ates pretreatment etanercept responders from nonrespondersIdentification of a 24-antibody and cytokine biomarker that differenti-
ates pretreatment etanercept responders from nonresponders. Predic-
tion analysis of microarrays (PAM) was applied to establish a rank list of
the variables, by training PAM on all 93 samples. An overlay of error
plots derived from PAM analysis of the 93 samples is displayed. First,
PAM was trained on the multi-parameter biomarker; blue, training error
graph. Second, internal cross-validation of the dataset was performed;
red, overall error of the cross-validation. For better readability, error bars
are shown for the cross-validation graph only. The number of markers is
shown in ascending order from right to left across the top of the panel,
and the selected PAM-derived threshold is indicated.
Arthritis Research & Therapy Vol 11 No 3 Hueber et al.
Page 10 of 13
(page number not for citation purposes)
Figure 6
Prediction of responders and nonrespondersPrediction of responders and nonresponders. Calculations of classification errors for (a) the PAM training/cross-validation step on all cohorts com-
bined, and (c) the PAM prediction steps for the three cohorts individually (top panel, ABCoN cohort; middle panel, Swedish cohort; bottom panel,
Japanese cohort). R, responder; NR, nonresponder; NPV, negative predictive value; PPV, positive predictive value. (b) Complete biomarker of 24
discriminators listed according to rank order, with associated scores for nonresponders and responders in the right and far-right columns, respec-
tively. ApoE, apolipoprotein E; COMP, cartilage oligomeric matrix protein; FGF-2, fibroblast growth factor-2; GM-CSF, granulocyte- macrophage
colony-stimulating factor; IP-10, IFNγ-inducible protein 10; MCP-1, monocyte chemoattractant protein-1.
Available online />Page 11 of 13
(page number not for citation purposes)
from rheumatology practices – demonstrated that ACR
response rates were notably lower as compared with the sen-
tinel clinical trials. This observation might suggest that the
benchmark for novel biomarkers to predict response in general
rheumatology practice could be different from the benchmark
for clinical trials. It is possible that, with further refinement and
use of Good Laboratory Practice assays, autoantibody and
cytokine profiling could provide significantly higher predictive
values for predicting response to anti-TNF therapies. A
biomarker that increases the precision of pretreatment predic-
tion of the ACR50 response (that is, from 50 to 70%) provides
the potential to have a significant impact on clinical decision-
making and potentially trial design [27].
Our study investigated samples from three population-based
cohorts. Within the US-based ABCoN cohort, for which the
multi-parameter biomarker demonstrated the best response
prediction, analysis of the responders exhibiting an ACR50
response or greater provided a positive predictive value of
71% (Figure 6c). In the Japanese cohort, the level of positive
prediction observed was lower (positive predictive value =
58%), while the biomarker identified Japanese nonresponders
with a negative predictive value of almost 80%, which was the
highest of any predictive value seen in this study.
Some of the markers in the 24-variable biomarker signature
were previously proposed to have some value for prediction,
such as MCP-1 [28] and titers of autoantibodies targeting cer-
tain citrullinated antigens or mixtures thereof, as measured in
the cyclic citrullinated peptide ELISAs [29,30]. Our data cor-
roborate these earlier notions since several citrullinated pep-
tides emerged as useful variables, as well as MCP-1
demonstrating a near-significant trend of being elevated in
responders. Newly described markers include several native
and nonfilaggrin-derived citrullinated antigen epitopes as pre-
sented in Table 2. Our data also demonstrate that cytokines
alone are probably insufficient to accurately predict treatment
responses in a general population, and combinations of
autoantibodies and cytokines provide increased predictive util-
ity across ethnically diverse and clinically heterogeneous RA
populations. Additional markers (imaging, genetic, clinical)
may eventually have to be incorporated into a definitive panel
of biomarkers [31], for the future development of a prediction
score that could be applied for reliable patient stratification.
Although the present study utilizes samples from three cohorts
of patients, important limitations remain: the number of sam-
ples per cohorts is relatively small; a number of samples dem-
onstrated undetectable serum levels of cytokines; the
quantification of response to therapy in RA is intrinsically inac-
curate since response classification is based on short term fol-
low-up; and our data may underestimate the predictive value
of these biomarkers for predicting response to anti-TNF ther-
apy since concomitant disease-modifying anti-rheumatic drug
medication in the three cohorts was not uniform. Moreover, a
full validation in independent cohorts of the identified markers
is not presented in this paper. Because of the small sample
numbers in the individual cohorts and the fact that the experi-
ments were performed over a 3-year period, the present article
represents a discovery and testing study. The training was per-
formed on the full dataset, and the resulting panel of markers
was tested in the three individual cohorts. These limitations
indicate the need for larger validation studies and prospective
serum proteome studies in cohorts where longer-term
response outcomes are available.
Conclusions
We identified a 24-parameter autoantibody and cytokine
biomarker that enables pretreatment classification and predic-
tion of etanercept responders in three cohorts of patients with
RA. Although further validation in prospective and larger
cohorts is needed, it is proposed that the multi-parameter pro-
tein biomarker presented in this study will facilitate the devel-
opment of molecular biomarkers with even higher predictive
utilities for guiding use of anti-TNF therapy and other disease-
modifying therapies in RA patients.
Competing interests
The authors declare that US and international patent applica-
tions were filed for biomarkers to guide selection of therapy in
RA, and option agreements for this intellectual property have
been signed with third-party companies.
Authors' contributions
WH and WHR conceived of the study and designed the arthri-
tis antigen arrays. PAM performed immunoprecipitation exper-
iments and mass spectrometry studies. WH and BHT carried
out the microarray experiments, and multiplex cytokine and
ELISA experiments. RJT, WL and BHT performed the statisti-
cal analysis. FB, RFvV, JL, LK, YT, KS, PKG and MCG partici-
pated in design and coordination. WH drafted the manuscript.
All authors read and approved the final manuscript.
Additional files
The following Additional files are available online:
Additional data file 1
Excel file containing a table that summarizes the clinical
characteristics of the Japanese cohort, including co-
medications.
See />supplementary/ar2706-S1.xls
Arthritis Research & Therapy Vol 11 No 3 Hueber et al.
Page 12 of 13
(page number not for citation purposes)
Acknowledgements
The authors are grateful to Maya BenBarak for technical help with data
analysis, to Markus Britschgi for critically reading the manuscript, and to
the members of the Robinson laboratory for scientific input. The present
work was funded by an Arthritis Foundation Investigator Award, NIH
NHLBI contract N01 HV 28183, NIH NIAMS AI069160, and Veterans
Affairs Health Care System funding to WHR.
References
1. Feldmann M, Maini R: Role of cytokines in rheumatoid arthritis:
an education in pathophysiology and therapeutics. Immunol
Rev 2008, 223:7-19.
2. Felson DT, Anderson JJ, Boers M, Bombardier C, Furst D, Gold-
smith C, Katz LM, Lightfoot R Jr, Paulus H, Strand V, Tugwell P,
Weinblatt M, Williams HJ, Wolfe W, Kieszak : American College
of Rheumatology. Preliminary definition of improvement in
rheumatoid arthritis. Arthritis Rheum 1995, 38:727-735.
3. Maini R, St Clair E, Breedveld F, Furst D, Kalden J, Weisman M,
Smolen J, Emery P, Harriman G, Feldmann M: Infliximab (chi-
meric anti-tumour necrosis factor α monoclonal antibody) ver-
sus placebo in rheumatoid arthritis patients receiving
concomitant methotrexate: a randomised phase III trial. Lan-
cet 1999, 354:1932-1939.
4. Weinblatt M, Keystone E, Furst D, Moreland L, Weisman M, Bir-
bara C, Teoh L, Fischkoff S, Chartash E: Adalimumab, a fully
human anti-tumor necrosis factor alpha monoclonal antibody,
for the treatment of rheumatoid arthritis in patients taking con-
comitant methotrexate: the ARMADA trial. Arthritis Rheum
2003, 48:35-45.
5. Weinblatt ME, Kremer JM, Bankhurst AD, Bulpitt KJ, Fleischmann
RM, Fox RI, Jackson CG, Lange M, Burge DJ: A trial of etaner-
cept, a recombinant tumor necrosis factor receptor:Fc fusion
protein, in patients with rheumatoid arthritis receiving meth-
otrexate. N Engl J Med 1999, 340:253-259.
6. Felson D, Anderson J, Lange M, Wells G, LaValley M: Should
improvement in rheumatoid arthritis clinical trials be defined
as fifty percent or seventy percent improvement in core set
measures, rather than twenty percent? Arthritis Rheum 1998,
41:1564-1570.
7. Kievit W, Fransen J, Oerlemans AJ, Kuper HH, Laar MA van der, de
Rooij DJ, De Gendt CM, Ronday KH, Jansen TL, van Oijen PC,
Brus HL, Adang EM, van Riel PL: The efficacy of anti-TNF in
rheumatoid arthritis, a comparison between randomised con-
trolled trials and clinical practice. Ann Rheum Dis 2007,
66:1473-1478.
8. Weaver AL, Lautzenheiser RL, Schiff MH, Gibofsky A, Perruquet
JL, Luetkemeyer J, Paulus HE, Xia HA, Leff JA, Investigators TR:
Real-world effectiveness of select biologic and DMARD mon-
otherapy and combination therapy in the treatment of rheuma-
toid arthritis: results from the RADIUS observational registry.
Curr Med Res Opin 2006, 22:185-198.
9. Chen Y, Jobanputra P, Barton P, Jowett S, Bryan S, Clark W, Fry-
Smith A, Burls A: A systematic review of the effectiveness of
adalimumab, etanercept and infliximab for the treatment of
rheumatoid arthritis in adults and an economic evaluation of
their cost-effectiveness.
Health Technol Assess 2006,
10:1-229.
10. Zink A, Strangfeld A, Schneider M, Herzer P, F H, Stoyanova-
Scholz M, Wassenberg S, Kapelle A, Listing J: Effectiveness of
tumor necrosis factor inhibitors in rheumatoid arthritis in an
observational cohort study: comparison of patients according
to their eligibility for major randomized clinical trials. Arthritis
Rheum 2006, 54:3399-3407.
11. Ranganathan P: Pharmacogenomics of tumor necrosis factor
antagonists in rheumatoid arthritis. Pharmacogenomics 2005,
6:481-490.
12. Hueber W, Tomooka BH, Zhao X, Kidd BA, Drijfhout JW, Fries JF,
van Venrooij WJ, Metzger AL, Genovese MC, Robinson WH: Pro-
teomic analysis of secreted proteins in early rheumatoid
arthritis: anti-citrulline autoreactivity is associated with up reg-
ulation of proinflammatory cytokines. Ann Rheum Dis 2007,
66:712-719.
13. Robinson WH, DiGennaro C, Hueber W, Haab BB, Kamachi M,
Dean EJ, Fournel S, Fong D, Genovese MC, de Vegvar HE, Skriner
K, Hirschberg DL, Morris RI, Muller S, Pruijn GJ, van Venrooij WJ,
Smolen JS, Brown PO, Steinman L, Utz PJ: Autoantigen microar-
rays for multiplex characterization of autoantibody responses.
Nat Med 2002, 8:295-301.
14. Hueber W, Kidd BA, Tomooka BH, Lee BJ, Bruce B, Fries JF,
Sonderstrup G, Monach P, Drijfhout JW, van Venrooij WJ, Utz PJ,
Genovese MC, Robinson WH: Antigen microarray analysis
defines subtypes of rheumatoid arthritis. Arthritis Rheum
2005, 52:2645-2655.
15. Arnett F, Edworthy S, Bloch D, McShane D, Fries J, Cooper N,
Healey L, Kaplan S, Liang M, Luthra H: The American Rheuma-
tism Association 1987 revised criteria for the classification of
rheumatoid arthritis. Arthritis Rheum 1988, 31:315-324.
16. Eisen Lab [ />]
17. Tibshirani R, Hastie T, Narasimhan B, Chu G: Diagnosis of multi-
ple cancer types by shrunken centroids of gene expression.
Proc Natl Acad Sci USA 2002, 99:6567-6572.
18. PAM: Prediction Analysis for Microarrays [http://www-
stat.stanford.edu/~tibs/PAM/index.html]
19. The R Project for Statistical Computing [http://www.r-
project.org/]
20. Van Vollenhoven R, Klareskog L: Clinical responses to tumor
necrosis factor alpha antagonists do not show a bimodal dis-
tribution: data from the Stockholm Tumor Necrosis Factor
alpha Followup Registry. Arthritis Rheum 2003, 48:1500-1503.
21. Buch M, Seto Y, Bingham S, Bejarano V, Bryer D, White J, Emery
P: C-reactive protein as a predictor of infliximab treatment out-
come in patients with rheumatoid arthritis: defining subtypes
of nonresponse and subsequent response to etanercept.
Arthritis Rheum 2005, 52:42-48.
22. Liu C, Batliwalla F, Li W, Lee A, Roubenoff R, Beckman E, Khalili
H, Damle A, Kern M, Plenge RM, Coenen MJ, Behrens TW, Carulli
JP, Gregersen PK: Genome-wide association scan identifies
candidate polymorphisms associated with differential
response to anti-TNF treatment in rheumatoid arthritis. Mol
Med 2008, 14:575-581.
23. Tutuncu Z, Kavanaugh A, Zvaifler N, Corr M, Deutsch R, Boyle D:
Fcγ receptor type IIIA polymorphisms influence treatment out-
comes in patients with inflammatory arthritis treated with
tumor necrosis factor alpha-blocking agents. Arthritis Rheum
2005, 52:2693-2696.
24. Seitz M, Wirthmuller U, Moller B, Villiger PM: The -308 tumour
necrosis factor-alpha gene polymorphism predicts therapeu-
tic response to TNF alpha-blockers in rheumatoid arthritis and
spondyloarthritis patients. Rheumatology 2007, 46:93-96.
25. Potter C, Hyrich KL, Tracey A, Lunt M, Plant D, Symmons DP,
Thomson W, Worthington J, Emery P, Morgan AW, Wilson AG,
Isaacs J, Barton A, BRAGGSS: Association of rheumatoid fac-
tor and anti-cyclic citrullinated peptide positivity, but not car-
riage of shared epitope or PTPN22 susceptibility variants, with
Additional data file 2
Adobe Illustrator file containing a figure that shows the
analysis of microarray reactivities by conventional ELISA.
Array-determined digital fluorescence units (arrayFU) are
plotted on the x axis and optical density values are
plotted on the y axis. Coefficients of linear regression
analysis (R
2
) are shown for each peptide.
See />supplementary/ar2706-S2.pdf
Additional data file 3
Adobe Illustrator file containing a figure that
demonstrates logistic regression analysis of the six other
cytokines not shown in Figure 4. See Figure 4 for details.
See />supplementary/ar2706-S3.pdf
Available online />Page 13 of 13
(page number not for citation purposes)
anti-tumour necrosis factor response in rheumatoid arthritis.
Ann Rheum Dis 2009, 68:69-74.
26. Rifai N, Gillette M, Carr S: Protein biomarker discovery and val-
idation: the long and uncertain path to clinical utility. Nat Bio-
technol 2006, 24:971-983.
27. O'Dell JR: Therapeutic strategies for rheumatoid arthritis. N
Engl J Med 2004, 350:2591-2602.
28. Fabre S, D AM, Dossat N, Guisset C, Cohen J, Cristol J, Daures J,
Jorgensen C: Protein biochip array technology for cytokine pro-
filing predicts etanercept responsiveness in rheumatoid
arthritis. Clin Exp Immunol 2008 in press.
29. Braun-Moscovici Y, Markovits D, Zinder O, Schapira D, Rozin A,
Ehrenburg M, Dain L, Hoffer E, Nahir A, Balbir-Gurman A: Anti-
cyclic citrullinated protein antibodies as a predictor of
response to anti-tumor necrosis factor-alpha therapy in
patients with rheumatoid arthritis. J Rheumatol 2006,
33:497-500.
30. Vis M, Bos W, Wolbink G, Voskuyl A, Twisk J, Stadt R Van de,
Hamann D, Dijkmans B, Lems W: IgM-rheumatoid factor, anti-
cyclic citrullinated peptide, and anti-citrullinated human fibrin-
ogen antibodies decrease during treatment with the tumor
necrosis factor blocker infliximab in patients with rheumatoid
arthritis. J Rheumatol 2008, 35:425-428.
31. Smolen J, Aletaha D, Grisar J, Redlich K, Steiner G, Wagner O:
The need for prognosticators in rheumatoid arthritis. Biologi-
cal and clinical markers: where are we now? Arthritis Res Ther
2008, 10:208.