Báo cáo y học: " Impaired glucose transporter-1 degradation and increased glucose transport and oxidative stress in response to high glucose in chondrocytes from osteoarthritic versus normal human cartilag" pps
Bạn đang xem bản rút gọn của tài liệu. Xem và tải ngay bản đầy đủ của tài liệu tại đây (1.41 MB, 11 trang )
Open Access
Available online />Page 1 of 11
(page number not for citation purposes)
Vol 11 No 3
Research article
Impaired glucose transporter-1 degradation and increased
glucose transport and oxidative stress in response to high glucose
in chondrocytes from osteoarthritic versus normal human
cartilage
Susana C Rosa
1
, Juliana Gonçalves
1
, Fernando Judas
2
, Ali Mobasheri
3
, Celeste Lopes
1
and
Alexandrina F Mendes
1
1
Center for Neurosciences and Cell Biology, and Faculty of Pharmacy, University of Coimbra, 3004-517 Coimbra, Portugal
2
Orthopaedics Department, University Hospital of Coimbra, Avenida Bissaya Barreto, Bloco de Celas, 3000-075 Coimbra, Portugal
3
Division of Veterinary Medicine, School of Veterinary Science and Medicine, Sutton Bonington Campus, University of Nottingham, Sutton Bonington
LE12 5RD, UK
Corresponding author: Alexandrina F Mendes,
Received: 26 Nov 2008 Revisions requested: 21 Jan 2009 Revisions received: 29 Apr 2009 Accepted: 2 Jun 2009 Published: 2 Jun 2009
Arthritis Research & Therapy 2009, 11:R80 (doi:10.1186/ar2713)
This article is online at: />© 2009 Rosa et al.; licensee BioMed Central Ltd.
This is an open access article distributed under the terms of the Creative Commons Attribution License ( />),
which permits unrestricted use, distribution, and reproduction in any medium, provided the original work is properly cited.
Abstract
Introduction Disorders that affect glucose metabolism, namely
diabetes mellitus (DM), may favor the development and/or
progression of osteoarthritis (OA). Thus far, little is known
regarding the ability of chondrocytes to adjust to variations in the
extracellular glucose concentration, resulting from hypoglycemia
and hyperglycemia episodes, and so, to avoid deleterious
effects resulting from deprivation or intracellular accumulation of
glucose. The aim of this study was to compare the ability of
normal and OA chondrocytes to regulate their glucose transport
capacity in conditions of insufficient or excessive extracellular
glucose and to identify the mechanisms involved and eventual
deleterious consequences, namely the production of reactive
oxygen species (ROS).
Methods Chondrocytes, isolated from normal and OA human
cartilage, were maintained in high-density monolayer cultures, in
media without or with 10 or 30 mM glucose. Glucose transport
was measured as the uptake of 2-deoxy-
D-glucose (2-DG).
Glucose transporter-1 (GLUT-1) mRNA and protein content
were evaluated by real-time RT-PCR and western blot,
respectively. ROS production was measured with 2',7'-
dichlorodihydrofluorescein diacetate.
Results Basal and IL-1β-induced 2-DG uptake, including the
affinity (1.066 ± 0.284 and 1.49 ± 0.59 mM) and maximal
velocity (0.27 ± 0.08 and 0.33 ± 0.08 nmol/μg protein/hour),
and GLUT-1 content were identical in normal and OA
chondrocytes. Glucose deprivation increased 2-DG uptake and
GLUT-1 protein both in normal and OA chondrocytes. Exposure
to high glucose (30 mM) for 18 or 48 hours decreased those
parameters in normal but not in OA chondrocytes. GLUT-1
mRNA levels were unaffected by high glucose, either in normal
or OA chondrocytes. The high glucose-induced reduction in
GLUT-1 protein in normal chondrocytes was reversed by
treatment with a lysosome inhibitor. High glucose induced ROS
production, which lasted significantly longer in OA than in
normal chondrocytes.
Conclusions Normal human chondrocytes adjust to variations
in the extracellular glucose concentration by modulating GLUT-
1 synthesis and degradation which involves the lysosome
pathway. Although capable of adjusting to glucose deprivation,
OA chondrocytes exposed to high glucose were unable
downregulate GLUT-1, accumulating more glucose and
producing more ROS. Impaired GLUT-1 downregulation may
constitute an important pathogenic mechanism by which
conditions characterized by hyperglycemia, like DM, can
promote degenerative changes in chondrocytes that can
facilitate the progression of OA.
2-DG: 2-deoxy-D-glucose; DM: diabetes mellitus; DMEM: Dulbecco's modified Eagle's medium; GLUT-1: glucose transporter-1; IL: interleukin; NF:
nuclear factor; OA: osteoarthritis; PBS: phosphate-buffered saline; PCR: polymerase chain reaction; RGM: regular glucose medium; ROS: reactive
oxygen species; RT: reverse transcriptase; TNF: tumor necrosis factor.
Arthritis Research & Therapy Vol 11 No 3 Rosa et al.
Page 2 of 11
(page number not for citation purposes)
Introduction
Osteoarthritis (OA) is the most common musculoskeletal dis-
order and a major cause of disability that affects diarthrodial
joints, being characterized by cartilage degradation, accompa-
nied by local inflammation and changes in the subchondral
bone. Increasing age, excessive loading or injury, genetic pre-
disposition and obesity are important risk factors for the devel-
opment and progression of OA [1,2]. Present evidence,
including epidemiologic studies, suggests the existence of a
positive correlation between OA and conditions that affect
glucose metabolism; namely, glucose imbalance, metabolic
dysfunction and diabetes mellitus (DM) [3-6]. The association
between DM and OA has already been suggested in early epi-
demiologic studies that showed a higher incidence of radio-
graphic OA, with an earlier onset and more severe
manifestations, in diabetic patients [7]. Nevertheless, the fact
that the incidence of both OA and DM, especially type 2 DM,
increases with age raises the possibility that these two condi-
tions coexist by chance alone [8]. In this case, whether the
metabolic and systemic disturbances, due to hyperglycemia
and/or altered insulin plasma levels characteristic of DM, have
consequences in joint tissues is largely unknown, but several
mechanisms may contribute to aggravate OA and promote its
progression, especially in type 2 DM patients [9].
Despite improved therapeutic possibilities, strict control of gly-
cemia in diabetic patients is still impossible, so that hypergly-
cemia and, less frequently, hypoglycemic episodes occur in
those patients [10]. Since fully developed articular cartilage is
an avascular tissue, glucose reaches chondrocytes through
diffusion from the synovial fluid [11], where its concentration is
identical to and reflects that in the plasma, both under normal
conditions and in noninflammatory and inflammatory types of
arthritis, excluding those associated with infections [12]. To
our knowledge, no information is available comparing the syn-
ovial fluid and plasma glucose concentrations in diabetic
patients, and, despite many possible complicating factors,
DM-related variations in glycemia are likely to cause similar
changes in the synovial fluid glucose concentration, and thus
affect glucose delivery to the articular cartilage. Articular
chondrocytes are highly glycolytic cells, requiring a steady
supply of glucose for optimal energy production and cell
homeostasis, as well as for anabolic functions; namely, the
synthesis of cartilage matrix molecules [1]. As such, articular
chondrocytes may be especially sensitive to alterations in the
synovial fluid glucose concentration due to hypoglycemia and/
or hyperglycemia episodes.
Studies evaluating the role of high and low extracellular glu-
cose concentrations in articular chondrocyte functions are
scarce, but glucose deprivation or inhibition of its uptake were
shown to increase the expression of matrix metalloproteinase-
2 [13], an enzyme that contributes to cartilage degradation in
late OA. In another study, exposure to either low or high glu-
cose concentrations induced insulin-like growth factor-1
resistance and decreased proteoglycan synthesis, which may
constitute important pathogenic mechanisms in OA [14].
Exposure to elevated glucose concentrations was also shown
to decrease dehydroascorbate transport into chondrocytes,
which can compromise the synthesis of type II collagen [15].
Furthermore, in intervertebral disc cells, which share many
common phenotypic characteristics with articular chondro-
cytes, glucose deprivation has been shown to reduce the syn-
thesis of type II collagen [16], which is the major collagen in
the articular cartilage matrix [1].
The molecular mechanisms involved in the effects reported in
those studies were not elucidated, but increased production
of reactive oxygen species (ROS) has been shown to mediate
the damaging effects of hyperglycemia in various cell types
[17]. Moreover, ROS contribute to the pathogenesis of OA by
mediating many of the effects induced by catabolic cytokines,
such as IL-1β, in articular chondrocytes [1]. Among other
responses, ROS have been shown to decrease the synthesis
and induce the degradation of cartilage matrix proteins [18], to
promote cell death [19], and to alter the regulation of tran-
scription factors such as activator protein-1 [20] and NF-κB
[21] that are involved in cartilage degradation and joint inflam-
mation [1,22].
Facilitated glucose transport represents the first rate-limiting
step in glucose utilization by chondrocytes, and thus may con-
tribute to any effects due to changes in plasma and synovial
glucose concentrations. Several members of the facilitative
glucose transporter family – the GLUT/SLC2A transporters –
have been identified in human articular chondrocytes, among
which glucose transporter-1 (GLUT-1) is especially important
as it is regulated by both anabolic and catabolic stimuli, while
others, like glucose transporter-3, are constitutively expressed
and unaffected by those stimuli [13,23-25]. In addition, various
cell types have been shown to adjust to high and low glucose
concentrations, mimicking hyperglycemia and hypoglycemia
episodes, by changing the GLUT-1 content and the rate of glu-
cose transport [26-28]. Moreover, a recent study reported that
glucose uptake in equine chondrocytes represents a constant
fraction of the glucose concentration in the culture medium
[29], implying that glucose transport in these cells depends on
the extracellular glucose concentration. Whether and how
human chondrocytes can also adjust their glucose transport
capacity to changes in the extracellular glucose concentration,
and whether modulation of GLUT-1 content is involved, remain
to be elucidated.
The aim of the present study was therefore to determine and
compare the ability of normal and OA chondrocytes to modu-
late the GLUT-1 content and glucose transport in response to
high and low extracellular glucose concentrations, since failure
to do so may cause cell damage and affect chondrocyte func-
tions, contributing to the development and progression of OA,
especially in DM patients. Since the results obtained showed
Available online />Page 3 of 11
(page number not for citation purposes)
that OA chondrocytes, unlike their normal counterparts, are
unable to downregulate the GLUT-1 content and glucose
transport when exposed to high glucose concentrations, the
molecular mechanisms involved in GLUT-1 downregulation
were investigated. Furthermore, and to determine whether
altered glucose transport in OA chondrocytes under high glu-
cose conditions can have deleterious consequences on their
functions, the production of ROS was compared in normal and
OA chondrocytes.
Materials and methods
Cartilage samples and chondrocyte culture
Human knee cartilage was collected from the distal femoral
condyles of 15 multiorgan donors (28 to 35 years old, mean
age 31 years; normal cartilage) or with informed consent from
18 patients (52 to 77 years old, mean age 66 years; OA carti-
lage) undergoing total knee replacement surgery at the Ortho-
pedic Department of the University Hospital of Coimbra. The
Ethics Committee of the University Hospital of Coimbra
approved all of the procedures.
Chondrocytes were isolated by enzymatic digestion as
described previously [30]. Nonproliferating monolayer cul-
tures were established from each cartilage sample, allowed to
recover in medium containing 5% fetal bovine serum for 24
hours, serum-starved overnight and maintained thereafter in
serum-free culture medium. The cells were subsequently cul-
tured, for the periods indicated in the figure legends, in glu-
cose-free DMEM (glucose deprivation), Ham's F-12 (regular
glucose medium (RGM), which contains 10 mM glucose) or
Ham's F-12 supplemented with 20 mM
D-glucose to yield a
final glucose concentration of 30 mM (high glucose medium).
In selected experiments described in the Results section,
Ham's F-12 was supplemented with 20 mM mannitol to deter-
mine whether the observed responses to high glucose were
due to osmotic effects. Recombinant human IL-1β 30 ng/ml
(Peprotech, Rocky Hill, NJ, USA), the proteasome inhibitor,
MG-132 10 μM (Calbiochem, La Jolla, CA, USA), and the lys-
osome inhibitor, chloroquine 20 μM (Sigma Chemical Co., St
Louis, MO, USA), were added to the chondrocyte cultures as
indicated in the Results section and the figure legends.
2-Deoxy-D-glucose uptake assay
Glucose transport was determined by measuring the net
uptake of 2-deoxy-
D-glucose (2-DG) (Sigma Chemical), a non-
metabolizable analogue of glucose. Briefly, chondrocytes
were incubated in glucose-free DMEM containing 0.5 mM 2-
DG and 0.5 μCi/ml [2,6-
3
H]-2-DG (GE Healthcare, Little
Chalfont, UK) with a specific activity of 53 Ci/mmol, at 37°C
for 30 minutes, in the presence or absence of cytochalasin B
10 μM (Calbiochem), a specific inhibitor of the majority of the
facilitative glucose transporters, to determine the nonspecific
uptake. The affinity and maximal velocity of 2-DG uptake were
deduced from Michaelis–Menten plots obtained with 2-DG
concentrations ranging from 0 to 5 mM. For each sample, the
nonspecific uptake was subtracted from the total uptake, after
normalization to the respective protein concentration.
Western blot analysis
Whole cell lysates were prepared in RIPA buffer and the pro-
tein concentration was measured using the bicinchoninic
acid/copper (II) sulphate protein assay kit (Sigma Chemical).
The samples (25 μg protein) and molecular weight markers
(All blue, Precision Plus molecular weight markers; Bio-Rad
Laboratories Inc., Hercules, CA, USA) were subjected to
SDS-PAGE and electroblotted onto polyvinylidene difluoride
(PVDF) membranes, which were probed with a rabbit polyclo-
nal antibody to human GLUT-1 (1:4,000 dilution; FabGennix
Inc. International, Frisco, TX, USA) and then with an anti-rabbit
alkaline phosphatase-conjugated secondary antibody
(1:20,000 dilution; GE Healthcare). Immune complexes were
detected with the Enhanced ChemiFluorescence reagent (GE
Healthcare) in a Storm 840 scanner (GE Healthcare). A
mouse anti-actin monoclonal antibody (1:10,000 dilution; Mil-
lipore Corporation, Billerica, MA, USA) was used to measure
the expression of this housekeeping gene product as an inter-
nal control. The intensity of the bands was analyzed using
ImageQuant™ TL (GE Healthcare).
Total RNA extraction and quantitative real-time RT-PCR
Total RNA was extracted with TRIzol (Invitrogen, Paisley, UK),
analyzed using Experion RNA StdSens Chip (Bio-Rad Labora-
tories) and quantified in a NanoDrop ND-1000 Spectropho-
tometer (NanoDrop Technologies, Inc., Wilmington, DE, USA)
at 260 nm. The cDNA was reverse transcribed using the
iScript™ Select cDNA Synthesis Kit (Bio-Rad Laboratories).
Specific sets of primers for GLUT-1 and endogenous control
genes were designed using Beacon Designer software (PRE-
MIER Biosoft International, Palo Alto, CA, USA). Details of the
forward and reverse primers for the genes evaluated are pre-
sented in Table 1. Quantitative real-time RT-PCR was per-
formed with iTaq™ DNA polymerase using iQ™ SYBR Green
Supermix (BioRad Laboratories).
The efficiency of the amplification reaction for each gene was
calculated by running a standard curve of serially diluted
cDNA sample, and the specificity of the amplification products
was checked by analysis of the melting curve. Gene expres-
sion changes were analyzed using the built-in iQ5 Optical sys-
tem software version 2, which enables the analysis of the
results with the Pfaffl method, a variation of the ΔΔCT method
corrected for gene-specific efficiencies. The results for GLUT-
1 were normalized using two housekeeping genes, β-actin and
cyclophilin A, determined with Genex
®
software (MultiD Anal-
yses AB, Göteborg, Sweden) as the most stable under the
experimental conditions used.
Measurement of reactive oxygen species production
The intracellular production of ROS was measured using 2',7'-
dichlorodihydrofluorescein diacetate (Molecular Probes,
Arthritis Research & Therapy Vol 11 No 3 Rosa et al.
Page 4 of 11
(page number not for citation purposes)
Eugene, OR, USA) – a nonfluorescent probe that diffuses
freely into cells, being hydrolyzed by intracellular esterases to
2',7'-dichlorodihydrofluorescein, which is cell membrane
impermeable. In the presence of ROS, 2',7'-dichlorodihy-
drofluorescein is oxidized to 2',7'-dichlorofluorescein, a highly
fluorescent compound.
After culture in RGM or high glucose medium for the periods
indicated in the figure legends, chondrocytes were loaded
with 5 μM 2',7'-dichlorodihydrofluorescein diacetate in PBS
(pH 7.4) for 20 minutes at 37°C and resuspended in PBS. The
fluorescence intensity was measured immediately using a
fluorometer (LS50B; Perkin-Elmer, Waltham, MA, USA), with
excitation set at 495 nm and emission set at 520 nm. The cell
suspensions were then centrifuged and lysed in 10 mM Tris–
HCl, 10 mM NaCl, 3 mM MgCl
2
, 0.5% Nonidet P-40, protease
inhibitors (Roche, Indianapolis, IN, USA), pH 7.5. The protein
concentration of the supernatants was measured using the
bicinchoninic acid/copper (II) sulfate protein assay kit (Sigma
Chemical). The fluorescence intensity of each sample was nor-
malized to the total protein content.
Statistical analysis
Statistical significance was assessed by two-way analysis of
variance followed by a Bonferroni post test and an unpaired
Student's t test for multiple and single comparisons, respec-
tively, using GraphPad Prism version 5.00 (GraphPad Soft-
ware, San Diego, CA, USA).
Results
Basal and IL-1β-induced glucose transport and GLUT-1
content in normal and osteoarthritis chondrocytes
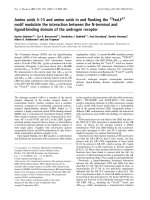
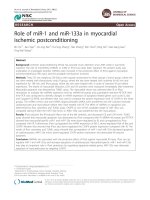
Figure 1a reveals that the basal 2-DG uptake was identical in
normal and OA chondrocytes. Furthermore, cytochalasin B
inhibited 2-DG uptake by approximately 90% (data not
shown), suggesting that glucose transport is almost entirely
mediated by glucose transporters both in normal and OA
chondrocytes. The intrinsic activities of the glucose transport-
ers in normal and OA chondrocytes were also similar, as indi-
cated by the analogous values for affinity (1.07 ± 0.28 and
1.49 ± 0.59 mM, respectively) and maximal velocity (0.27 ±
0.08 and 0.33 ± 0.08 nmol/μg protein/hour, respectively)
obtained from the Michaelis–Menten plots presented in Figure
1b. Accordingly, GLUT-1 protein content did not differ signifi-
cantly between the normal and OA chondrocyte cultures (Fig-
ure 1c).
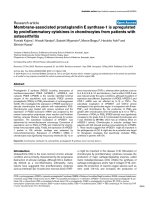
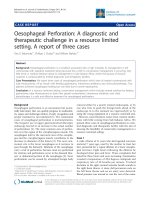
Upon stimulation with IL-1β 30 ng/ml, the 2-DG uptake and
GLUT-1 protein and mRNA levels increased similarly in normal
and OA chondrocytes, relative to the respective untreated
cells (Figure 2). This indicates that OA chondrocytes regulate
glucose transport and GLUT-1 levels in response to IL-1β as
efficiently as their normal counterparts.
Modulation of glucose transport by the extracellular
glucose concentration in normal and osteoarthritis
chondrocytes
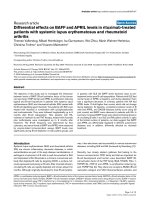
Normal and OA chondrocytes responded similarly to glucose
deprivation, significantly increasing the 2-DG uptake relative
to cells maintained in RGM (10 mM glucose) (Figure 3). In
contrast, 2-DG uptake by normal chondrocytes cultured under
high (30 mM) glucose concentrations for either 18 or 48 hours
was approximately 30% lower than that found in their respec-
tive controls, that is, normal chondrocytes maintained in RGM
for 48 hours. On the contrary, the 2-DG uptake in OA
chondrocytes subjected to high glucose for either 18 or 48
hours did not change relative to their respective control cells
cultured in RGM for 48 hours, but was significantly higher than
that found in their normal counterparts cultured under high glu-
cose concentrations for the same periods of time.
To control for possible osmotic effects, normal and OA
chondrocytes were cultured in Ham's F-12 medium supple-
mented with 20 mM mannitol. In this condition, no changes in
2-DG uptake were found either in normal or OA chondrocytes
relative to the respective control cells cultured in RGM (data
not shown).
Table 1
Oligonucleotide primer pairs used for quantitative real-time RT-PCR
Gene Primer sequence (5'-3') Product length (base pairs) GenBank accession number
Glucose transporter-1 Forward: CGTCTTCATCATCTTCACTG 148 [Genbank:NM_006516]
Reverse: CTCCTCGGGTGTCTTATC
β-Actin Forward: AACTACCTTCAACTCCAT 161 [Genbank:NM_001101]
Reverse: TGATCTTGATCTTCATTGTG
Cyclophilin A Forward: CAGTCCCAGGAAGTGTCAATG 155 [Genbank:NM_021130
]
Reverse: CAGCGTCTCACTATGTTGCC
Available online />Page 5 of 11
(page number not for citation purposes)
Modulation of GLUT-1 protein content by the
extracellular glucose concentration in normal and
osteoarthritis chondrocytes
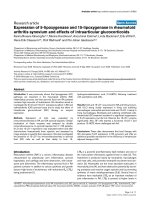
Glucose deprivation for 48 hours significantly increased the
total GLUT-1 protein levels both in normal chondrocytes (Fig-
ure 4a) and in OA chondrocytes (Figure 4b), relative to their
respective controls cultured under RGM for the same period.
Since this increase (approximately 30%), either in normal or
OA chondrocytes, is of the same magnitude as that found for
glucose uptake (approximately 25%), it is likely to account for
most, if not all, of the extra glucose transport capacity induced
by glucose deprivation.
The total GLUT-1 protein content was markedly decreased in
normal chondrocytes incubated with 30 mM glucose for 18 or
48 hours (Figure 4a), but remained unchanged in OA cells cul-
tured under the same conditions (30 mM glucose), relative to
those cultured in RGM, independently of the duration of expo-
sure to high glucose (Figure 4b).
As regards 2-DG uptake, no differences were found in the
GLUT-1 protein content in normal and OA chondrocytes cul-
tured in mannitol-supplemented medium relative to their
respective control cells maintained in RGM (data not shown).
Role of high extracellular glucose on GLUT-1 mRNA
levels
To ascertain whether the differences in total GLUT-1 protein
content induced by culture of normal and OA chondrocytes
under high glucose were due to alterations in GLUT-1 gene
expression, quantitative real-time RT-PCR analysis was per-
formed. The results obtained show that GLUT-1 mRNA levels,
Figure 1
Basal glucose transport and glucose transporter-1 protein in normal and osteoarthritis chondrocytesBasal glucose transport and glucose transporter-1 protein in normal and osteoarthritis chondrocytes. (a) 2-Deoxy-
D-glucose (2-DG) transport into
normal (n = 6) and osteoarthritis (OA) (n = 9) chondrocytes. (b) Concentration dependence of 2-DG influx into normal and OA chondrocytes fitted
to the Michaelis–Menten model to determine the affinity and maximal velocity. Each value is the mean ± standard deviation of five independent exper-
iments performed in duplicate. (c) Glucose transporter-1 (GLUT-1) protein normalized to the respective actin band in normal (n = 9) and OA (n = 9)
chondrocyte cultures. Bars = mean ± standard deviation.
Arthritis Research & Therapy Vol 11 No 3 Rosa et al.
Page 6 of 11
(page number not for citation purposes)
expressed as the fold increase relative to the respective con-
trol cells maintained in RGM, were not affected by culture of
either normal or OA chondrocytes with high glucose for 6, 12
or 24 hours (Figure 5).
Role of the lysosome and the proteasome on GLUT-1
downregulation
To determine the contribution of the major protein degradation
pathways to the decrease in the total GLUT-1 protein content
found in normal chondrocytes exposed to high glucose (Figure
4a), specific inhibitors of the proteasome (MG-132) and lyso-
some (chloroquine) were used. Since both inhibitors were
toxic to chondrocytes for periods longer than 6 hours (data not
shown), they were added to the chondrocyte cultures only for
the last 6 hours of a total 18-hour incubation period in the
presence of 30 mM glucose. Treatment of normal chondro-
cytes cultured under high glucose with 20 μM MG-132 had no
effect on GLUT-1 protein levels, whereas 20 μM chloroquine
partially reversed the high-glucose-induced GLUT-1
decrease, augmenting GLUT-1 protein by approximately 20%,
relative to chondrocytes cultured in the absence of this inhibi-
tor (Figure 6).
High-glucose-induced reactive oxygen species
production in normal and osteoarthritis chondrocytes
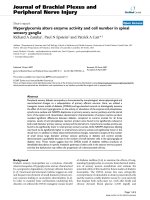
As a positive control, normal and OA chondrocyte cultures
were treated with IL-1β 30 ng/ml for 1 hour, which increased
the fluorescence intensity by approximately 40% relative to the
respective control cells (Figure 7a).
Chondrocytes were loaded with the probe to detect ROS pro-
duction after being cultured under regular or high glucose con-
ditions for 1 hour or 18 hours. The fluorescence intensity
detected in each condition was therefore due solely to the
Figure 2
Stimulation of glucose transport and glucose transporter-1 expression by IL-1β in normal and osteoarthritis chondrocytesStimulation of glucose transport and glucose transporter-1 expression by IL-1β in normal and osteoarthritis chondrocytes. (a) 2-Deoxy-
D-glucose (2-
DG) transport into normal (n = 4) and osteoarthritis (OA) (n = 5) chondrocytes stimulated or not with IL-1β 30 ng/ml for 48 hours. (b) Glucose trans-
porter-1 (GLUT-1) protein normalized to the respective actin band in normal (n = 4) and OA (n = 9) chondrocyte cultures, stimulated or not with IL-
1β 30 ng/ml for 48 hours. Results expressed as the percentage relative to the respective control cells. MW, molecular weight marker. (c) GLUT-1
mRNA levels in normal (n = 3) and OA (n = 3) chondrocyte cultures stimulated or not with IL-1β 30 ng/ml for 12 hours. Results are expressed as the
fold increase relative to the respective untreated cells. *P < 0.05 and ***P < 0.001 relative to untreated cells. Bars = mean ± standard deviation.
Available online />Page 7 of 11
(page number not for citation purposes)
amount of ROS produced during the 20-minute incubation
with the probe and not to the total amount produced during
the previous 1-hour or 18-hour culture periods. In these condi-
tions, the fluorescence intensity of normal and OA chondro-
cytes that had been incubated in high glucose medium for 1
hour increased similarly when compared with their respective
control cells maintained in RGM (Figure 7b). This indicates
that exposure of both normal and OA chondrocytes to a high
glucose concentration rapidly increases the intracellular pro-
duction of ROS.
After this initial increase, ROS production returned to control
levels in normal chondrocytes that had been cultured under
high glucose for 18 hours, while OA chondrocytes still pro-
duced increased amounts of ROS, identical to those found in
cells that had been cultured under high glucose for only 1 hour
(Figure 7b).
Discussion
The present study has demonstrated that normal and OA
chondrocytes isolated from human articular cartilage do not
differ in their relative capacity for glucose transport and GLUT-
1 content. Moreover, GLUT-1 is constitutively expressed in
both normal and OA chondrocytes (Figure 1). The kinetic char-
acteristics of glucose uptake in normal and OA chondrocytes,
as reflected by the affinity and maximal velocity values deter-
mined, are in the same range, although slightly higher, as those
previously reported in bovine chondrocytes [31]. These results
are in agreement with other studies [23,32], although GLUT-1
Figure 3
Modulation of glucose transport by different extracellular glucose con-centrationsModulation of glucose transport by different extracellular glucose con-
centrations. 2-Deoxy-
D-glucose (2-DG) uptake into normal (n = 6) and
osteoarthritis (OA) (n = 9) chondrocytes cultured in media with 0 mM,
10 mM (regular glucose medium (RGM)) or 30 mM glucose (high glu-
cose medium (HGM)) for 18 or 48 hours. Results expressed as the
percentage relative to the respective control cells maintained in RGM.
***P < 0.001 relative to cells maintained in RGM,
§§§
P < 0.001
between normal and OA chondrocytes exposed to the same glucose
concentration for the same period. Bars = mean ± standard deviation.
Figure 4
Modulation of glucose transporter-1 protein content by different extra-cellular glucose concentrationsModulation of glucose transporter-1 protein content by different extra-
cellular glucose concentrations. Glucose transporter-1 (GLUT-1) pro-
tein normalized to the respective actin band in chondrocytes cultured in
media with 0 mM, 10 mM (regular glucose medium (RGM)) or 30 mM
glucose (high glucose medium (HGM)) for 18 or 48 hours. (a) Normal
chondrocytes (n = 4). (b) Osteoarthritis chondrocytes (n = 6). Results
expressed as the percentage relative to the respective control cells
maintained in RGM. **P < 0.01 and ***P < 0.001 relative to cells main-
tained in RGM. Bars = mean ± standard deviation.
Arthritis Research & Therapy Vol 11 No 3 Rosa et al.
Page 8 of 11
(page number not for citation purposes)
expression in chondrocytes has also been reported to be
exclusively inducible [24] and to be either increased [32] or
decreased [33] in OA chondrocytes relative to normal cells.
The reasons for these discrepancies are unclear, but OA in
humans is now understood to be a broad continuum and it is
possible that GLUT-1 expression is increased and then
decreased at early and later stages of the disease. Alterna-
tively, the observed differences may be related to species
investigated or to the culture conditions used in these studies.
Nonetheless, we cannot discard the possibility that in situ nor-
mal and OA human chondrocytes can express distinctly differ-
ent GLUT-1 levels – especially due to the presence in the OA
joint of proinflammatory catabolic cytokines such as IL-1β,
which has been shown to induce GLUT-1 expression both in
the present study (Figure 2) and in other studies, along with
TNF-α and IL-6 [24,25].
Regulation of GLUT-1 has been shown to occur in various cell
types and to involve changes at the transcriptional or post-
transcriptional levels, depending on the stimulus and cell type
considered [27,28,33]. Furthermore, subcellular redistribution
between the plasma membrane, intracellular compartments of
the Golgi apparatus and protein degradation structures, such
as the lysosome, have been shown to mediate high-glucose-
induced and low-glucose-induced changes in GLUT-1 protein
content and hexose uptake capacity [27,34,35].
In the present study, glucose deprivation similarly upregulated
2-DG transport (Figure 3) and GLUT-1 protein levels (Figure
4) in normal and OA chondrocytes. This upregulation was also
observed in other cells, being considered a protective mecha-
nism that maximizes the cell's ability to capture glucose and
thus to overcome stressful conditions, such as glucose scar-
city or even deprivation [36,37]. Under such conditions, glyco-
gen stores act as a source of sugars [38]. When those stores
are depleted, due to persistence or recurrence of glucose
shortage or deprivation, a hypoglycosylated form of GLUT-1
accumulates [39] and alternative sources of sugars, such as
glycoproteins, may start to be used [38]. In a previous study
using the human chondrocytic cell line C-28/I
2
, glucose depri-
vation elicited the appearance and accumulation of the
hypoglycosylated form of GLUT-1 [40]. In the current study,
however, no such band was detected in either normal or OA
chondrocytes (Figure 4). This indicates that human chondro-
cytes deprived of glucose can still carry on processes such as
protein glycosylation, suggesting they can store more glyco-
gen than transformed C28/I
2
cells.
In contrast, normal chondrocytes responded to high glucose
by decreasing the 2-DG uptake (Figure 3) and the total GLUT-
1 content (Figure 4a), suggesting that downregulation of
GLUT-1 mediates the decrease in glucose transport. This
mechanism can protect articular chondrocytes against the del-
eterious effects of excessive intracellular glucose accumula-
tion, as seen in other cells [28,41,42]. Accordingly, after the
initial increase, ROS production in normal chondrocytes
exposed to high glucose concentrations for 18 hours returned
to control levels (Figure 7b), accompanying the decrease in
GLUT-1 content – whereas ROS production remained ele-
vated in OA chondrocytes (Figure 7b), paralleling their inability
to downregulate glucose uptake and the GLUT-1 content (Fig-
ures 3 and 4b). Since ROS are involved in the pathophysiol-
ogy of OA, their prolonged production when OA chondrocytes
are exposed to excessive amounts of glucose is likely to
Figure 5
Regulation of glucose transporter-1 mRNA levels by high glucoseRegulation of glucose transporter-1 mRNA levels by high glucose.
Quantitative real-time RT-PCR analysis of glucose transporter-1
(GLUT-1) mRNA levels in chondrocyte cultures exposed to 30 mM glu-
cose (high glucose medium (HGM)) for 6, 12 or 24 hours or main-
tained in regular glucose medium (RGM). (a) Normal chondrocytes (n
= 3). (b) Osteoarthritis chondrocytes (n = 3). Results expressed as the
fold increase relative to the respective control cells maintained in RGM.
Bars = mean ± standard deviation.
Available online />Page 9 of 11
(page number not for citation purposes)
directly damage those cells and to aggravate catabolic proc-
esses that can contribute to OA progression in diabetic
patients. On the other hand, the increased production of ROS
observed in normal chondrocytes (Figure 7b), although lasting
a shorter time than in OA cells, may not be devoid of deleteri-
ous effects, especially if prolonged exposure to high glucose
occurs, as may be the case in poorly controlled diabetic
patients.
Lysosomal degradation is probably the main mechanism
accounting for high-glucose-induced GLUT-1 downregulation
in normal chondrocytes, since GLUT-1 mRNA levels remained
unchanged (Figure 5a) and only the lysosome inhibitor (chlo-
roquine) effectively counteracted the GLUT-1 decrease (Fig-
ure 6). This observation is in agreement with studies in other
cells where high glucose, glucose re-feeding after deprivation
or diabetic conditions led to GLUT-1 routing to intracellular
compartments followed by lysosomal degradation
[26,27,34,35]. Since GLUT-1 mRNA levels remained
unchanged in OA chondrocytes exposed to high glucose con-
centrations (Figure 5b), their inability to downregulate the
GLUT-1 content (Figure 4b) is probably due to impaired
GLUT-1 protein degradation. Further studies are required to
identify the primary defect responsible for that impairment,
which may lie in any process from glucose sensing and metab-
olism to GLUT-1 intracellular trafficking and lysosomal degra-
dation. Whether that defect already exists or is induced by
exposure to high glucose also warrants further investigation.
From another perspective, the inability of chondrocytes to
modulate GLUT-1 gene transcription in response to high glu-
cose concentrations, unlike other cells [28,39], may render
chondrocytes especially susceptible to hyperglycemia epi-
sodes – especially when the episodes are prolonged, as is
often the case in poorly controlled type 2 DM patients. In such
circumstances, augmented GLUT-1 degradation may not be
sufficient to prevent deleterious increases in the intracellular
glucose concentration. This insufficiency is even more striking
in OA chondrocytes, which completely failed to downregulate
both 2-DG uptake (Figure 3) and GLUT-1 protein (Figure 4b)
under high glucose concentrations.
Conclusions
The present study has shown that normal human chondro-
cytes adjust to variations in the extracellular glucose concen-
tration by modulating GLUT-1 synthesis and degradation
Figure 6
Roles of the proteasome and the lysosome in mediating high-glucose-induced downregulation of glucose transporter-1 proteinRoles of the proteasome and the lysosome in mediating high-glucose-induced downregulation of glucose transporter-1 protein. Glucose trans-
porter-1 (GLUT-1) protein content normalized to the respective actin band in normal chondrocytes (n = 3) cultured in regular glucose medium
(RGM) or in high glucose medium (HGM, 30 mM) with or without 20 μM chloroquine or 10 μM MG-132 added for the last 6 hours of a total 18-hour
incubation period. Results expressed as the percentage relative to untreated cells maintained in RGM. **P < 0.01 relative to cells maintained in
RGM,
§
P < 0.01 between glucose 30 mM with or without 20 μM chloroquine. Bars = mean ± standard deviation.
Arthritis Research & Therapy Vol 11 No 3 Rosa et al.
Page 10 of 11
(page number not for citation purposes)
through the lysosome pathway. OA chondrocytes are unable
to adjust to high extracellular glucose, however, showing
defective GLUT-1 downregulation that leads to the intracellu-
lar accumulation of glucose, and increased oxidative stress.
This downregulation can constitute an important pathogenic
mechanism by which conditions characterized by hyperglyc-
emia, such as DM and other situations involving impaired glu-
cose metabolism, can promote degenerative changes in
chondrocytes that facilitate the development and progression
of OA.
Competing interests
The authors declare that they have no competing interests.
Authors' contributions
SCR carried out chondrocyte cultures under different glucose
concentrations, 2-DG uptake assays, some of the western
blots, the ROS production assay and real-time RT-PCR exper-
iments, and participated in the study design and in drafting the
manuscript. JG isolated and set up the chondrocyte cultures
and performed some experiments. FJ collected normal and OA
cartilage and participated in the study design. AM collabo-
rated in the 2-DG uptake assays and the study design, and
revised the manuscript. CL participated in the study design.
AFM conceived of, designed and coordinated the study, set
up some chondrocyte cultures and drafted the manuscript. All
authors made intellectual contributions to the project and read
and approved the final manuscript.
Acknowledgements
The present work was supported by grant PTDC/SAU-OSM/67936/
2006 from the Portuguese Foundation for Science and Technology
(FCT). SCR is supported by a PhD fellowship (SFRH/BD/19763/2004)
from the FCT.
References
1. Goldring MB: Update on the biology of the chondrocyte and
new approaches to treating cartilage diseases. Best Pract Res
Clin Rheumatol 2006, 20:1003-1025.
2. Buckwalter JA, Martin JA: Osteoarthritis. Adv Drug Deliv Rev
2006, 58:150-167.
3. Hart DJ, Doyle DV, Spector TD: Association between metabolic
factors and knee osteoarthritis in women: the Chingford
Study. J Rheumatol 1995, 22:1118-1123.
4. Del Rosso A, Cerinic MM, De Giorgio F, Minari C, Rotella CM,
Seghier G: Rheumatological manifestations in diabetes melli-
tus. Curr Diabetes Rev 2006, 2:455-466.
5. Sturmer T, Brenner H, Brenner RE, Gunther KP: Non-insulin
dependent diabetes mellitus (NIDDM) and patterns of oste-
oarthritis. The Ulm osteoarthritis study. Scand J Rheumatol
2001, 30:169-171.
6. Rojas-Rodriguez J, Escobar-Linares LE, Garcia-Carrasco M,
Escarcega RO, Fuentes-Alexandro S, Zamora-Ustaran A: The
relationship between the metabolic syndrome and energy-uti-
lization deficit in the pathogenesis of obesity-induced oste-
oarthritis. Med Hypotheses 2007, 69:860-868.
7. Waine H, Nevinny D, Rosenthal J, Joffe IB: Association of oste-
oarthritis and diabetes mellitus. Tufts Folia Med 1961, 7:13-19.
8. Burner TW, Rosenthal AK: Diabetes and rheumatic diseases.
Curr Opin Rheumatol 2009, 21:50-54.
9. Mobasheri A, Bondy CA, Moley K, Mendes AF, Rosa SC, Richard-
son S, Hoyland JA, Barrett-Jolley R, Shakibaei M: Articular
chondrocytes: expression, distribution and functional regula-
tion of GLUT isoforms by hypoxia, hypoxia mimetics, growth
factors and pro-inflammatory cytokines. Adv Anat Embryol Cell
Biol 2008, 200:1-84.
10. Stenina OI: Regulation of vascular genes by glucose. Curr
Pharm Des 2005, 11:2367-2381.
11. Maroudas A: Distribution and diffusion of solutes in articular
cartilage. Biophys J 1970, 10:365-379.
12. Brannan SR, Jerrard DA: Synovial fluid analysis. J Emerg Med
2006, 30:331-339.
Figure 7
Modulation of reactive oxygen species production by IL-1β and high glucoseModulation of reactive oxygen species production by IL-1β and high
glucose. (a) Reactive oxygen species (ROS) production in normal and
osteoarthritis (OA) chondrocytes treated with or without IL-1β 30 ng/ml
for 1 hour (n = 4). (b) ROS production in normal and OA chondrocytes
(n = 5) cultured in regular glucose medium (RGM) or in high glucose
medium (HGM, 30 mM) for the periods indicated and then loaded with
5 μM 2',7'-dichlorodihydrofluorescein diacetate for 20 minutes at 37°C,
as described in Materials and methods. Results expressed as the per-
centage relative to the respective control cells maintained in RGM. **P
< 0.01 and ***P < 0.001 relative to the respective control cells main-
tained in RGM,
§§§
P < 0.001 between normal and OA chondrocytes
exposed to the same glucose concentration for the same period. Bars
= mean ± standard deviation.
Available online />Page 11 of 11
(page number not for citation purposes)
13. Richardson S, Neama G, Phillips T, Bell S, Carter SD, Moley KH,
Moley JF, Vannucci SJ, Mobasheri A: Molecular characterization
and partial cDNA cloning of facilitative glucose transporters
expressed in human articular chondrocytes; stimulation of 2-
deoxyglucose uptake by IGF-I and elevated MMP-2 secretion
by glucose deprivation. Osteoarthritis Cartilage 2003,
11:92-101.
14. Kelley KM, Johnson TR, Ilan J, Moskowitz RW: Glucose regulation
of the IGF response system in chondrocytes: induction of an
IGF-I-resistant state. Am J Physiol 1999, 276:R1164-R1171.
15. McNulty AL, Stabler TV, Vail TP, McDaniel GE, Kraus VB: Dehy-
droascorbate transport in human chondrocytes is regulated by
hypoxia and is a physiologically relevant source of ascorbic
acid in the joint. Arthritis Rheum 2005, 52:2676-2685.
16. Johnson W, Stephan S, Roberts S: The influence of serum, glu-
cose and oxygen on intervertebral disc cell growth in vitro:
implications for degenerative disc disease. Arthritis Res Ther
2008, 10:R46.
17. Rolo AP, Palmeira CM: Diabetes and mitochondrial function:
role of hyperglycemia and oxidative stress. Toxicol Appl Phar-
macol 2006, 212:167-178.
18. Tiku ML, Shah R, Allison GT: Evidence linking chondrocyte lipid
peroxidation to cartilage matrix protein degradation. Possible
role in cartilage aging and the pathogenesis of osteoarthritis.
J Biol Chem 2000, 275:20069-20076.
19. Blanco FJ, Ochs RL, Schwarz H, Lotz M: Chondrocyte apoptosis
induced by nitric oxide. Am J Pathol 1995, 146:75-85.
20. Mendes AF, Caramona MM, Carvalho AP, Lopes MC: Hydrogen
peroxide mediates interleukin-1β-induced AP-1 activation in
articular chondrocytes: implications for the regulation of iNOS
expression. Cell Biol Toxicol 2003, 19:203-214.
21. Mendes AF, Caramona MM, Carvalho AP, Lopes MC: Differential
roles of hydrogen peroxide and superoxide in mediating IL-1-
induced NF-κB activation and iNOS expression in bovine artic-
ular chondrocytes. J Cell Biochem 2003, 88:783-793.
22. Henrotin YE, Bruckner P, Pujol JP: The role of reactive oxygen
species in homeostasis and degradation of cartilage. Osteoar-
thritis Cartilage 2003, 11:
747-755.
23. Mobasheri A, Neama G, Bell S, Richardson S, Carter SD: Human
articular chondrocytes express three facilitative glucose trans-
porter isoforms: GLUT1, GLUT3 and GLUT9. Cell Biol Int 2002,
26:297-300.
24. Shikhman AR, Brinson DC, Valbracht J, Lotz MK: Cytokine regu-
lation of facilitated glucose transport in human articular
chondrocytes. J Immunol 2001, 167:7001-7008.
25. Shikhman AR, Brinson DC, Lotz MK: Distinct pathways regulate
facilitated glucose transport in human articular chondrocytes
during anabolic and catabolic responses. Am J Physiol Endo-
crinol Metab 2004, 286:E980-E985.
26. Greco-Perotto R, Wertheimer E, Jeanrenaud B, Cerasi E, Sasson
S: Glucose regulates its transport in L8 myocytes by modulat-
ing cellular trafficking of the transporter GLUT-1. Biochem J
1992, 286(Pt 1):157-163.
27. Sasson S, Kaiser N, Dan-Goor M, Oron R, Koren S, Wertheimer E,
Unluhizarci K, Cerasi E: Substrate autoregulation of glucose
transport: hexose 6-phosphate mediates the cellular distribu-
tion of glucose transporters. Diabetologia 1997, 40:30-39.
28. Alpert E, Gruzman A, Totary H, Kaiser N, Reich R, Sasson S: A nat-
ural protective mechanism against hyperglycaemia in vascular
endothelial and smooth-muscle cells: role of glucose and 12-
hydroxyeicosatetraenoic acid. Biochem J 2002, 362:413-422.
29. Schneider N, Mouithys-Mickalad A, Lejeune JP, Duyckaerts C,
Sluse F, Deby-Dupont G, Serteyn D: Oxygen consumption of
equine articular chondrocytes: influence of applied oxygen
tension and glucose concentration during culture. Cell Biol Int
2007, 31:878-886.
30. Rosa SC, Judas F, Lopes MC, Mendes AF: Nitric oxide synthase
isoforms and NF-κB activity in normal and osteoarthritic
human chondrocytes: regulation by inducible nitric oxide.
Nitric Oxide 2008, 19:276-283.
31. Windhaber RA, Wilkins RJ, Meredith D: Functional characterisa-
tion of glucose transport in bovine articular chondrocytes.
Pflugers Arch 2003, 446:572-577.
32. Pfander D, Cramer T, Swoboda B: Hypoxia and HIF-1α in oste-
oarthritis. Int Orthop 2005, 29:6-9.
33. Peansukmanee S, Vaughan-Thomas A, Carter SD, Clegg PD, Tay-
lor S, Redmond C, Mobasheri A: Effects of hypoxia on glucose
transport in primary equine chondrocytes in vitro and evidence
of reduced GLUT-1 gene expression in pathologic cartilage in
vivo. J Orthop Res 2009, 27:
529-535.
34. Ortiz PA, Honkanen RA, Klingman DE, Haspel HC: Regulation of
the functional expression of hexose transporter GLUT-1 by
glucose in murine fibroblasts: role of lysosomal degradation.
Biochemistry 1992, 31:5386-5393.
35. Fernandes R, Carvalho AL, Kumagai A, Seica R, Hosoya K, Teras-
aki T, Murta J, Pereira P, Faro C: Downregulation of retinal
GLUT1 in diabetes by ubiquitinylation. Mol Vis 2004,
10:618-628.
36. Yun H, Lee M, Kim S-S, Ha J: Glucose deprivation increases
mRNA stability of vascular endothelial growth factor through
activation of AMP-activated protein kinase in DU145 prostate
carcinoma. J Biol Chem 2005, 280:9963-9972.
37. Natsuizaka M, Ozasa M, Darmanin S, Miyamoto M, Kondo S,
Kamada S, Shindoh M, Higashino F, Suhara W, Koide H, Aita K,
Nakagawa K, Kondo T, Asaka M, Okada F, Kobayashi M: Syner-
gistic up-regulation of hexokinase-2, glucose transporters and
angiogenic factors in pancreatic cancer cells by glucose dep-
rivation and hypoxia. Exp Cell Res 2007, 313:3337-3348.
38. McMahon RJ, Frost SC: Glycogen: a carbohydrate source for
GLUT-1 glycosylation during glucose deprivation of 3T3-L1
adipocytes. Am J Physiol 1996, 270:E640-E645.
39. McMahon RJ, Frost SC: Nutrient control of GLUT1 processing
and turnover in 3T3-L1 adipocytes. J Biol Chem 1995,
270:12094-12099.
40. Rosa SC, Mobasheri A, Lopes MC, Mendes AF: Glucose trans-
port in immortalized human chondrocytes (C-28/I
2
) in nor-
moxia and hypoxia [abstract]. Osteoarthritis Cartilage 2006,
14(Suppl B):P179.
41. Totary-Jain H, Naveh-Many T, Riahi Y, Kaiser N, Eckel J, Sasson S:
Calreticulin destabilizes glucose transporter-1 mRNA in vas-
cular endothelial and smooth muscle cells under high-glucose
conditions. Circ Res 2005, 97:1001-1008.
42. Cohen G, Riahi Y, Alpert E, Gruzman A, Sasson S: The roles of
hyperglycaemia and oxidative stress in the rise and collapse
of the natural protective mechanism against vascular
endothelial cell dysfunction in diabetes. Arch Physiol Biochem
2007, 113:259-267.