Báo cáo y học: "Nerve growth factor and receptor expression in rheumatoid arthritis and spondyloarthritsi" potx
Bạn đang xem bản rút gọn của tài liệu. Xem và tải ngay bản đầy đủ của tài liệu tại đây (636.86 KB, 9 trang )
Open Access
Available online />Page 1 of 9
(page number not for citation purposes)
Vol 11 No 3
Research article
Nerve growth factor and receptor expression in rheumatoid
arthritis and spondyloarthritis
Christian Barthel
1
, Nataliya Yeremenko
2
, Roland Jacobs
1
, Reinhold E Schmidt
1
,
Michael Bernateck
3
, Henning Zeidler
4
, Paul-Peter Tak
2
, Dominique Baeten
2
and Markus Rihl
1
1
Clinic for Immunology and Rheumatology, Hannover Medical School (MHH), Carl-Neuberg-Strasse 1, Hannover 30625, Germany
2
Division of Clinical Immunology and Rheumatology, Academic Medical Center (AMC), University of Amsterdam, Meibergdreef 9, Amsterdam, 1105,
The Netherlands
3
Department of of Anesthesiology, Pain Clinic, Hannover Medical School (MHH), Carl-Neuberg-Strasse 1, Hannover, 30625, Germany
4
Rheumatologikum Hannover, Rathenaustrasse 13/14, Hannover, 30159, Germany
Corresponding author: Markus Rihl,
Received: 12 Nov 2008 Revisions requested: 16 Dec 2008 Revisions received: 11 May 2009 Accepted: 2 Jun 2009 Published: 2 Jun 2009
Arthritis Research & Therapy 2009, 11:R82 (doi:10.1186/ar2716)
This article is online at: />© 2009 Barthel et al.; licensee BioMed Central Ltd.
This is an open access article distributed under the terms of the Creative Commons Attribution License ( />),
which permits unrestricted use, distribution, and reproduction in any medium, provided the original work is properly cited.
Abstract
Introduction We previously described the presence of nerve
growth factor receptors in the inflamed synovial compartment.
Here we investigated the presence of the corresponding nerve
growth factors, with special focus on nerve growth factor (NGF).
Methods mRNA expression levels of four ligands (NGF, brain
derived growth factor (BDNF), neurotrophin (NT)-3, NT-4) and
their four corresponding receptors (tyrosine kinase (trk) A, trkB,
trkC, NGFRp75) were determined in the synovial fluid (SF) cells
of 9 patients with rheumatoid arthritis (RA) and 16 with
spondyloarthritis (SpA) and compared with 7 osteoarthritis (OA)
patients. NGF was also determined in synovial tissue (ST)
biopsies of 10 RA and 10 SpA patients. The production of NGF
by monocytes and lymphocytes was assessed by flow cytometry
of SF cells, synovial tissue derived fibroblast-like synoviocytes
(FLS) were assessed by ELISA on culture supernatant.
Results SF cell analysis revealed a clear BDNF and NGF mRNA
expression, with significantly higher NGF expression in RA and
SpA patients than in the OA group. NGF expression was higher
in ST samples of RA as compared to SpA. Using intracellular
FACS analysis, we could demonstrate the presence of the NGF
protein in the two inflammatory arthritis groups on both CD3+ T
lymphocytes and CD14+ cells, i.e. monocytes/macrophages,
whereas cultured FLS did not produce NGF in vitro.
Conclusions Neurotrophins and especially NGF are expressed
in the synovial fluid and tissue of patients with peripheral
synovitis. The presence of neurotrophins as well as their
receptors, in particular the NGF/trkA-p75 axis in peripheral
synovitis warrants further functional investigation of their active
involvement in chronic inflammatory arthritis.
Introduction
There is increasing evidence for the presence of neuronal
growth factors in chronic inflammatory arthritis. Neurotrophins
(nerve growth factor (NGF), brain-derived neurotrophic factor
(BDNF), and the neurotrophins NT-3 and NT-4) constitute a
family of growth factors essential for the development, prolifer-
ation, differentiation, and survival of neuronal as well as various
non-neuronal cells. Neurotrophins bind to their specific high-
affinity receptors tyrosine kinase (trk) A (NGF), trkB (BDNF,
NT-4), and trkC (NT-3), and to one low-affinity receptor p75
(or NGFRp75) that binds to all ligands. This p75 receptor is a
member of the TNF receptor superfamily [1]. In particular, the
NGF-trkA/p75 axis arouses increasing interest due to its role
in chronic inflammatory arthritis in which a pathogenic function
of this system has been postulated [2-6].
BDNF: brain-derived growth factor; BSA: bovine serum albumin; Ct: cycle threshold; DMEM: Dulbecco's modified eagle's medium; ELISA: enzyme-
linked immunosorbent assay; FACS: fluorescence-activated cell sorter; FCS: fetal calf serum; FLS: fibroblast-like synoviocytes; G3PDH: glyceralde-
hyde 3-phosphate dehydrogenase; mAb: monoclonal antibody; NGF: nerve growth factor; NSAID: non-steroidal anti-inflammatory drug; NT: neuro-
trophin; OA: osteoarthritis; PBMC: peripheral blood mononuclear cells; PBS: phosphate-buffered saline; RA: rheumatoid arthritis; RT-PCR: reverse
transcription polymerase chain reaction; SD: standard deviation; SpA: spondyloarthritis; SF: synovial fluid; SFMC: synovial fluid mononuclear cells;
ST: synovial tissue; TNF: tumor necrosis factor; trk: tyrosine kinase.
Arthritis Research & Therapy Vol 11 No 3 Barthel et al.
Page 2 of 9
(page number not for citation purposes)
Using immunohistochemistry, we previously performed a
detailed analysis on the synovial expression of neurotrophins
showing convincingly high levels of both the trkA and the p75
NGF receptors in peripheral synovitis of patients with spondy-
loarthritis (SpA). Their expression correlated with signs of
inflammation and was modulated by effective treatment with
anti-TNF [7]. However, apart from BDNF we were unable to
demonstrate the presence of the ligands at the protein level.
Accordingly, this study was designed to assess the expression
of NGF and all other known neurotrophic ligands (BDNF, NT-
3, NT-4), as well as their receptors (trkA, NGFRp75, trkB,
trkC), in order to provide evidence that all actors of this system
are present and actively upregulated in the inflamed synovial
compartment.
Materials and methods
Patients
Synovial fluid (SF) samples were collected from nine patients
with rheumatoid arthritis (RA) fulfilling the American College of
Rheumatology classification criteria and from 16 patients with
SpA fulfilling the European Spondyloarthropathy Study Group
classification criteria [8,9]. Also, seven patients with osteoar-
thritis (OA) served as non-inflammatory controls. All patients
had active synovitis of the knee. Patient characteristics and
disease activity parameters are listed in Table 1. OA patients
were graded according to the Kellgren and Lawrence classifi-
cation [10]. The majority of patients had OA of the knee grade
2 (mean 2.3 ± standard deviation (SD) 1.0).
Synovial tissue (ST) biopsies were obtained from another
panel of patients including 10 SpA and 10 RA patients with
early and active arthritis of the knee (disease duration <6
months, only NSAID treatment, but no steroids, no disease-
modifying anti-rheumatic drugs, or biologics).
All subjects gave their written informed consent before inclu-
sion in the study, which was approved by the local ethics com-
mittee of the involved institutions.
Synovial fluid and synovial tissue biopsy samples and
extraction of total RNA
SF was obtained by a conventional puncture of an actively
inflamed knee joint. Samples were centrifuged for 15 minutes
at 1000 g. Supernatants were removed, whole SF cell pellets
were resuspended in RNAlater solution (Ambion, Austin, TX,
USA), and frozen at -80°C until use. For intracellular fluores-
cence-activated cell sorting (FACS) analysis, mononuclear
cells derived from SF samples (SFMC) were obtained by
standard Ficoll histopaque procedure and conserved in FCS
and 10% dimethyl sulfoxide. They were kept in liquid nitrogen
until use. ST biopsies were obtained by a standard procedure
as previously described [11]. The Ficoll procedure was also
used in order to obtain peripheral blood mononuclear cells
(PBMC) from four healthy individuals used as controls for
PCR. Total RNA was extracted from SF cell pellets, ST biop-
sies, and PBMC using TRizol reagent (Invitrogen, Karlsruhe,
Germany) and precipitation with isopropyl alcohol. All proce-
dures were previously described in detail [12-14].
Quantitative real-time RT-PCR (TaqMan assay)
Generation of cDNA by reverse transcription and utilization of
TaqMan
®
assay followed the protocol of the manufacturer
Table 1
Clinical characteristics of neurotrophins and receptors in the synovial fluids of SpA, RA, and OA patients
Patient Groups Clinical characteristics
age gender DD (y) SJC TJC CRP (mg/l) ESR (mm) SFc/μl%PMN
SpA (n = 16) median 37 6 f/10 m 5 2* 1* 10.5* 20 7025* 72
SD 16.8 5.9 1.2 1.9 23 15 8825 26
(range) (16 to 65) (0.3 to 18) (1 to 4) (0 to 8) (1 to 99) (3 to 54) (2500 to 31100) (5 to 92)
RA (n = 9) median 49 8 f/1 m 5 5# 3# 11.7# 26 7950# 76
SD 15.3 9.2 3.2 1.8 29 8.8 3645 11
(range) (37 to 77) (1 to 26) (2 to 13) (2 to 7) (7.5 to -95) (12 to 67) (2600 to 1300) (50 to 90)
OA (n = 7) median 67 5 f/2 m 6 1 1 3 17 700 60
SD 5.8 5.7 0.5 0.4 1.1 5.6 1096 33
(range) (58 to 75) (2 to 18) (1 to 2) (1 to 2) (1.6 to 4.5) (12 to 25) (100 to 3250) (5 to 90)
Table 1 shows the clinical data and parameters of disease activity of 16 spondyloarthritis (SpA), 9 rheumatoid arthritis (RA), and 7 osteoarthritis
(OA) patients used for the RT-PCR measurements on the synovial fluid samples. Swollen joint count (SJC), tender joint count (TJC), C-reactive
protein (CRP), and synovial fluid (SF) leukocyte counts were higher in both SpA (*) and RA (
#
) as compared with OA; Mann Whitney U test; P <
0.05).
DD = disease duration given in years; ESR = erythrocyte sedimentation rate; f = female; m = male; PMN = percentage of polymorphonuclear cells
of SF leukocytes; OA = osteoarthritis; RA = rheumatoid arthritis; SD = standard deviation; SpA = spondyloarthritis.
Available online />Page 3 of 9
(page number not for citation purposes)
(Applied Biosystems, Darmstadt, Germany). Briefly, 2 μg of
total RNA were reverse transcribed using the MultiScribe
®
(Applied Biosystems, Darmstadt, Germany) reverse tran-
scriptase. Duplicate PCR reactions were performed using the
TaqMan
®
universal PCR master mix on ABI Prism
®
7000
sequence detection system (Applied Biosystems, Darmstadt,
Germany). After denaturation at 50°C for two minutes and
95°C for 10 minutes, 45 PCR reaction cycles were performed
each at 95°C for 9 seconds and 60°C for one minute. The fol-
lowing mRNA transcripts and assays were used (Applied Bio-
systems, Warrington, UK): assays-on-demand for NGF-beta
(assay no. Hs00171458), [GenBank:X52599
], BDNF (assay
no. Hs00156058), [GenBank:M61176
], and NT-3 (assay no.
Hs00267375), [GenBank:M37763
]; assay-by-design for NT-
4 (cat. no. 4332078; [GenBank:M86528
]); assays-on
demand for the high-affinity receptors trkA (assay no.
Hs00176787), [GenBank:X03541
]; trkB (assay no.
Hs00178811), [GenBank:U12140
]; trkC (assay no.
Hs00176797), [GenBank:U05012
], and for the low-affinity
receptor NGFRp75 (assay no. Hs00609976), [Gen-
Bank:M14764
].
Delta delta Ct method and statistical analysis
All PCR data were normalized to the expression of the glycer-
aldehyde 3-phosphate dehydrogenase (G3PDH) housekeep-
ing gene used as an internal control; SF data were also
normalized with a set of four healthy PBMC used as an exter-
nal control. The ST data were compared with each other. PCR
data were obtained as cycle threshold (Ct) values. The Ct
value is defined as the cycle with a fluorescence intensity sig-
nificantly above the background fluorescence but within the
exponential phase of the amplification [15,16]. The mean of
two Ct measurements of one sample was calculated for both
the given target gene and the G3PDH gene. Delta Ct was
determined as the mean of the duplicate Ct values for the tar-
get gene subtracted by the mean of the duplicate Ct values for
the G3PDH gene. For each target gene, delta Ct measure-
ments were performed separately for both the SF samples and
the healthy PBMC. The delta delta Ct method represents the
difference between the two cell types for a given target gene
[17]. Expression levels are given as fold of expression and
were compared between SpA, RA, and OA groups using the
non-parametric Mann Whitney U test as appropriate.
Fluorescence-activated cell sorting for detection of NGF
SF mononuclear cells (SFMC) of three RA and three SpA
patients from the panel described in Table 1, as well as PBMC
from two healthy controls were prepared by density gradient
centrifugation using biocoll (1.077 g/ml; Biochrom, Berlin,
Germany). SFMC were harvested from the interphase and
washed twice at 1000 g and 300 g, respectively. The cells
were finally resuspended in PBS/BSA and stained for surface
markers (CD3 PerCP, clone SK7; CD14 FITC, Leu-M3; CD56
APC, NCAM 16.2; all from Becton Dickinson, Heidelberg,
Germany) for 20 minutes. After two washes with PBS/BSA
(300 g/three minutes) the cells were fixed for 10 minutes at
room temperature in PBS containing 4% paraformaldehyde.
Cells were then washed once and resuspended in saponin
buffer (PBS supplemented with 5 mM HEPES and 0.1%
saponin) in order to perforate the cell membranes. Subse-
quently, aliquots were stained with monoclonal antibodies
(mAb) against NGF (biotinylated anti-human β-NGF, cata-
logue number BAF256; R&D systems, Minneapolis, MN,
USA). Unspecific binding of the mAb via Fc-receptors was dis-
criminated by adding human IgG solution (Octagam; Octap-
harma, Langenfeld, Germany). After 30 minutes of incubation
at 4°C, cells were washed three times with PBS/BSA and
resuspended again in saponin buffer. PE-labeled streptavidin
(SA-PE, Becton Dickinson, Heidelberg, Germany) for second-
ary staining of biotinylated NGF was added and cells were
incubated for 30 minutes at 4°C. After three washes (300 g/
three minutes) with PBS/BSA, cells were ready for FACS
analysis.
Phenotypic analyses were performed as multicolor immunoflu-
orescences. At least 10
4
cells per appropriate lymphocyte or
monocyte gate, respectively, according to forward scatter vs
side scatter properties were analyzed using a dual-laser
cytometer with Cell Quest Pro (FACSCalibur, Becton Dickin-
son, Heidelberg, Germany) and Summit 4.3 (Beckman Coul-
ter, Krefeld, Germany) software.
Culture of fibroblast-like synoviocytes to determine NGF
production
Fibroblast-like synoviocytes (FLS) were isolated from synovial
biopsies of one RA and one SpA patient as described previ-
ously [18]. After three passages, cells were resuspended at
10,000 cells/ml Dulbecco's modified eagle's medium (DMEM)
with 10% FCS and plated at 2 ml/well in 24 well plates. Cells
were grown for three days until confluence, then the normal
medium (DMEM + 10% FCS) was replaced by starvation
medium (DMEM + 1% FCS). After 24 hours, cells were stim-
ulated with either medium alone (DMEM 1% FCS); TNF-alpha
at 10 ng/ml; or IL-1 beta at 10 ng/ml, or lipopolysaccharide at
1 ug/ml. After 72 hours of culture with stimulation, superna-
tants were collected and used undiluted for measuring NGF
by ELISA (R&D Systems, Minneapolis, MN, USA; lowest
detection level: 30 pg/ml).
Results
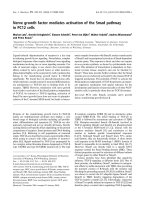
The mRNA expression levels of the four neurotrophic ligands
and the four receptors as determined in the SF cells are
depicted in Table 2 and outlined in detail by scatter plots in
Figure 1 (ligands) and Figure 2 (receptors).
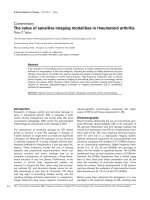
As for the transcripts encoding the ligands, BDNF revealed
high expression levels in all three groups (RA median: 163,
SpA median: 92 with a high range from 71 to 444, OA median:
137). The highest mRNA expression in SF samples was found
for NGF revealing significantly higher levels in RA and SpA
Arthritis Research & Therapy Vol 11 No 3 Barthel et al.
Page 4 of 9
(page number not for citation purposes)
(median 418 and 323, respectively) as compared with OA
(median 49; P = 0.001 for both comparisons). Transcripts
encoding NT-3 and NT-4 were expressed on lower levels and
slightly higher by trend in RA as compared with SpA and OA.
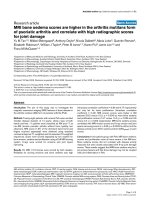
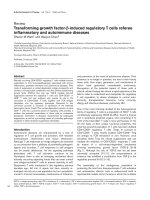
The NGF mRNA expression levels as determined in ST biop-
sies were found to be significantly higher in RA (mean expres-
sion level 1.6 ± 1.2 SD) as compared with SpA (mean
expression level 0.7 ± 0.3 SD) patients (P = 0.02) indicating
that NGF is produced locally, at least in the arthritic synovium
of RA patients (Figure 3).
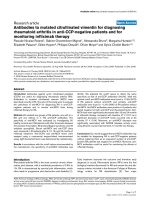
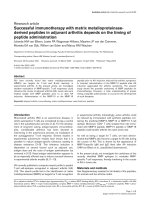
In agreement with our previous immunohistochemistry data on
ST samples [7], the mRNA transcripts encoding both the high-
affinity NGF receptor trkA and the common low-affinity recep-
tor p75 revealed the highest expression levels in SF of the
SpA and the RA group being significantly higher expressed as
compared with the OA group. The highest values were found
for trkA in the SpA group (trkA median in SpA 20 vs OA 4.7;
P = 0.003; p75 median in SpA 13.4 vs OA 4.8; P = 0.03) and
for p75 in the RA group (trkA median values: RA 16 vs OA 4.7;
P = 0.004; p75 median values: RA25 vs OA 4.8; P = 0.01 as
determined by the Mann Whitney U test). Expression levels of
trkB and trkC receptors were clearly lower than the ones of
trkA and p75. Expression of trkB and trkC in SpA and OA was
similar. However, trkB expression in the RA group was signifi-
cantly higher as compared with the OA group (trkB median in
RA 7.7 vs OA 4.1; P = 0.04).
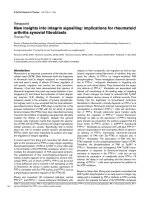
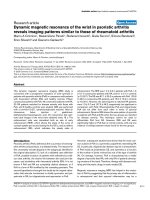
We also measured NGF expression by staining on a single cell
level using flow cytometry. Concomitant staining of cell sur-
face markers and intracellular NGF revealed the presence of
NGF in T lymphocytes (CD3+) and monocytes (CD14+). In
contrast, B lymphocytes (CD19+) and nearly all natural killer
cells (CD16+) were NGF negative in patients as well as in
Figure 1
Scatter plots showing mRNA expression of the neurotrophic ligandsScatter plots showing mRNA expression of the neurotrophic ligands. The scatter plots a to d depict the expression levels of the four neurotrophic lig-
ands. (a) nerve growth factor (NGF). (b) Brain-derived growth factor (BDNF). (c) Neurotrophin (NT)-3. (d) NT-4). Bold horizontal lines represent the
median. The highest levels were found for BDNF and NGF. Significantly higher expression was revealed for NGF in both spondyloarthritis (SpA) and
rheumatoid arthritis (RA) as compared with osteoarthritis (OA; P = 0.001 for both comparisons).
Available online />Page 5 of 9
(page number not for citation purposes)
healthy controls. In both the SpA and the RA group, percent-
ages of NGF expressing T lymphocytes and monocytes were
considerably higher as compared with healthy controls (Figure
4). As we did notice clear mRNA expression for NGF not only
in SF but also in ST, we additionally investigated the produc-
tion of NGF by FLS. In vitro cultured FLS from RA as well as
SpA did not secrete detectable levels of NGF, even upon stim-
ulation with various proinflammatory cytokines (data not
shown). Taken together, these data suggest that infiltrating T
lymphocytes and myeloid cells are the main source of NGF in
the inflamed peripheral joint.
Discussion
The present study is a descriptive comprehensive quantitative
expression analysis of mRNA transcripts encoding the four
known human neurotrophins and their four corresponding
receptors in the synovial compartment of arthritis patients.
The presence of neurotrophic factors in the inflamed joint has
been described earlier [2,3]. Focusing on the NGF/trkA-p75
axis in our own and other work, we could previously demon-
strate high trkA and p75 NGF receptor expression at the pro-
tein level in the inflamed ST in peripheral SpA synovitis. This
expression was correlated with inflammatory disease activity
and was downregulated by TNF-blocking treatment indicating
that their expression is not constitutive but actively modulated
in inflammation [7]. However, the high-affinity receptors trkB
and trkC as well as the ligands NGF, NT-3, and NT-4 were
expressed in the minority of patients or not detectable by
immunohistochemistry.
Figure 2
Scatter plots showing mRNA expression of neurotrophin receptorsScatter plots showing mRNA expression of neurotrophin receptors. The scatter plots a to d depict the expression levels of the four neurotrophin
receptors. (a) Tyrosine kinase (trk)A. (b) p75. (c) trkB. (d) trkC. Bold horizontal lines represent the median. The highest levels were found for trkA
and p75, revealing significantly higher expression levels in spondyloarthritis (SpA; P = 0.0003, P = 0.003 respectively) and rheumatoid arthritis (RA;
P = 0.004 and P = 0.001, respectively) vs osteoarthritis (OA).
Arthritis Research & Therapy Vol 11 No 3 Barthel et al.
Page 6 of 9
(page number not for citation purposes)
In order to investigate the NGF/trkA-p75 axis as well as all
other neurotrophic ligands and receptors at the transcript
level, we used quantitative real-time RT-PCR to determine
their expression in a larger panel of SpA and RA patients with
active peripheral synovitis of the knee. Our data confirm the
high expression of both the trkA and p75 NGF receptors at the
transcript level in the synovial compartment of SpA and RA
patients. Of note, we now provide evidence that the NGF lig-
and is also expressed in the SF and tissue biopsy samples of
peripheral synovitis indicating that this system is active in
chronic inflammatory arthritis. However, we need to state, that
the high NGF transcript expression is in contrast to our previ-
ous ELISA data in SF samples [7]. This discrepancy between
mRNA and protein expression has been reported earlier in
studies on brain tissue [19]. Reasons for this phenomenon
might involve post-transcriptional modifications of NGF [1,20].
We also can not exclude technical reasons such as the NGF
antibody used for the previous quantitative immunoassay.
The cellular source of NGF in humans has been investigated
in several studies. Under unstimulated conditions, NGF is pro-
duced mainly by CD4+ T and B lymphocytes [1,21]. Under
inflammatory conditions such as allergy and arthritis, NGF can
be produced, stored, and released by eosinophils, mast cells,
lymphocytes, and synovial fibroblasts, as well as monocytes
and macrophages [22]. Using intracellular FACS analysis, we
could demonstrate the presence of the NGF protein in the two
inflammatory arthritis groups on both CD3+ and CD14+ cells,
that is, T lymphocytes and monocytes/macrophages, which
are known to be involved in the major pathways of both SpA
and RA. However, ST-derived FLS do not seem to produce
NGF as measured by ELISA. This finding might indicate the
mere pro-inflammatory potential of NGF as opposed to factors
released by fibroblasts, which are predominantly involved in
structural damage. On the other hand, we can not definitely
rule out the production of NGF by FLS. One explanation would
be, that FLS loose their ability to produce NGF when cultured
Table 2
RT-PCR expression levels of neurotrophins and receptors in the synovial fluids of SpA, RA, and OA patients
Patient Groups RT-PCR results
TrkA p75 trkB trkC NGF BDNF NT-3 NT-4
SpA (n = 16) median 20 13.4 6.7 7.1 323 92 7.0 7.3
SD 12 7.7 3.9 6.0 296 113 2.9 5.0
(range) (3.6 to 45) (3.5 to 28) (1.1 to 17) (2.4 to 25) (74 to 1225) (71 to 444) (1.3 to 9.6) (1 to 15)
RA (n = 9) median 16 25 7.7 11 418 163 7.5 10
SD 10 12 4.3 3.4 275 101 3.5 7 to 6
(range) (8.9 to 40) (2.3 to 41) (4.1 to 18) (4.3 to 14) (267 to 1104) (71 to 374) (0.5 to 11) (4.9 to 22)
OA (n = 7) median 4.7 4.8 4.1 6.7 49 137 3.4 8.6
SD 4.2 3.7 2.8 3.8 37.7 98.5 2.2 3.1
(range) (1.7 to 15) (3.2 to 15) (1.3 to 9.8) (3.2 to 15) (18 to 129) (25 to 238) (1.7 to 7.8) (4.3 to 13)
Table 2 shows the RT-PCR expression levels of mRNA transcripts of four neurotrophins (nerve growth factor (NGF), brain-derived growth factor
(BDNF), and neurotrophin (NT)-3, NT-4) and their corresponding receptors (high-affinity receptors tyrosine kinase (trk)A, trkB, trkC and the low-
affinity NGF receptor p75) of all 32 patients are shown (see also Figures 1 and 2 for detailed data and statistics).
DD = disease duration given in years; ESR = erythrocyte sedimentation rate; f = female; m = male; PMN = percentage of polymorphonuclear cells
of SF leukocytes; OA = osteoarthritis; RA = rheumatoid arthritis; SD = standard deviation; SpA = spondyloarthritis.
Figure 3
mRNA expression of NGF in synovial tissue samplesmRNA expression of NGF in synovial tissue samples. mRNA expression
of nerve growth factor (NGF) as the prototype of neurotrophins was
measured in the synovium of both 10 spondyloarthritis (SpA) and 10
rheumatoid arthritis (RA) patients; the expression levels were compared
with each other (relative expression) showing a twice as high and thus
significantly higher NGF expression in RA as compared with SpA (P =
0.02).
Available online />Page 7 of 9
(page number not for citation purposes)
over three passages in vitro. Another explanation would be
that NGF is produced but not secreted, at least not in large
amounts. Nevertheless, FLS are most likely one of the targets
of NGF.
To date, the functional role of neurotrophins in inflammatory
joint disorders is unclear. A pathogenic role for the NGF/trkA-
p75 axis and other neurotrophins has been postulated for air-
way inflammation [23], atopic dermatitis [24], psoriasis [25],
inflammatory bowel disease [26], and arthritis [2-7]. In inflam-
matory syndromes, NGF has been attributed to upregulating
TNF-alpha, promoting the differentiation of B cells to plasma
cells, enhancing chemotaxis and production of superoxide by
neutrophils [22]. NGF is also involved in humoral immune
responses by acting as an autocrine survival factor maintaining
the viability of memory B-cells and macrophages [27]. NGF
and its receptors have also tissue remodeling capacities exert-
ing a strong fibrotic stimulus on skin and lung fibroblasts [28].
Upon binding to trkA, NGF induces its auto-phosphorylation
and subsequently the activation of both phospholipase PLCγ
and protein kinase C, which in turn activates the mitogen-acti-
vated protein kinase pathway involving the c-jun N-terminal,
the p38, and the extracellular-regulated protein kinases
(ERK1/2) all of which have been identified in arthritis as well.
Interestingly, the wnt proteins, which have been described as
regulating neurotrophin expression [29], have recently also
Figure 4
NGF staining by flow cytometryNGF staining by flow cytometry. PBMC of (a) healthy controls (HC) and (b) synovial fluid mononuclear cells (SFMC) from spondyloarthritis (SpA),
and (c) rheumatoid arthritis (RA) patients were first stained with surface markers (CD3 and CD14) and permeabilized in order to enable intracellular
detection of nerve growth factor (NGF). The cells were analysed by flow cytometry after setting lymphocyte (left column) and monocyte (right col-
umn) gates according to forward scatter vs side scatter properties of the cells. Dot plots of one representative individual of each group are shown.
Arthritis Research & Therapy Vol 11 No 3 Barthel et al.
Page 8 of 9
(page number not for citation purposes)
been found to play a pathogenic role in spondyloarthritis [30].
In addition, NGF has been identified as a proangiogenic factor,
another significant pathogenic pathway in chronic inflamma-
tory arthritis such as SpA and RA [31,32].
Conclusions
Taken together, this comprehensive analysis demonstrates the
expression of the pleiotropic NGF and its two receptors in
peripheral synovitis of SpA and RA. The knowledge of neuro-
trophin expression on cells from the inflamed synovial com-
partment in arthritis patients adds to the potential evaluation of
pathogenic mechanisms and the development of new thera-
peutic strategies (e.g. the pharmacological blockade of the
NGF receptor and their signaling pathway by using receptor
antagonists). Our findings prompt further functional as well as
clinical studies on the role of neurotrophins and their therapeu-
tic potential in arthritis.
Competing interests
The authors declare that they have no competing interests.
Authors' contributions
CB performed the RT-PCR experiments, the analysis of the
data, and drafted the manuscript. NY did the FLS isolation and
the ELISA. MB provided technical assistance in collecting the
samples. RJ performed the FACS analysis. RES, HZ, PPT, and
DB provided assistance in interpretation of the data and draft-
ing the manuscript. MR designed the study and provided
assistance in analysis and interpretation of the data and draft-
ing the manuscript.
Acknowledgements
This work was supported by the Competence Network Rheumatology
(KNR, BMBF, Berlin).
References
1. Tessarollo L: Pleiotropic functions of neurotrophins in develop-
ment. Cytokine Growth Factor Rev 1998, 9:125-137.
2. Aloe L, Tuveri MA, Carcassi U, Levi-Montalcini R: Nerve growth
factor in the synovial fluid of patients with chronic arthritis.
Arthritis Rheum 1992, 35:351-355.
3. Pozza M, Guerra M, Manzini E, Calza L: A histochemical study of
the rheumatoid synovium: focus on nitric oxide, nerve growth
factor high affinity receptor, and innervation. J Rheumatol
2000, 27:1121-1127.
4. Wu Z, Nagata K, Iijima T: Immunohistochemical study of NGF
and its receptors in the synovial membrane of the ankle joint
of adjuvant-induced arthritic rats. Histochem Cell Biol 2000,
114:453-459.
5. Iannone F, De Bari C, Dell'Accio F, Covelli M, Patella V, Lo Bianco
G, Lapadula G: Increased expression of nerve growth factor
(NGF) and high affinity NGF receptor (p140 TrkA) in human
osteoarthritic chondrocytes. Rheumatology (Oxford) 2002,
41:1413-1418.
6. Grimsholm O, Guo Y, Ny T, Forsgren S: Expression patterns of
neurotrophins and neurotrophin receptors in articular
chondrocytes and inflammatory infiltrates in knee joint arthri-
tis. Cells Tissues Organs 2008, 188:299-309.
7. Rihl M, Kruithof E, Barthel C, De Keyser F, Veys EM, Zeidler H, Yu
DT, Kuipers JG, Baeten D: Involvement of neurotrophins and
their receptors in spondyloarthritis synovitis: relation to
inflammation and response to treatment. Ann Rheum Dis
2005, 64:1542-1549.
8. Dougados M, Linden S van der, Juhlin R, Huitfeldt B, Amor B, Calin
A, Cats A, Dijkmans B, Olivieri I, Pasero G, et al.: The European
Spondylarthropathy Study Group preliminary criteria for the
classification of spondylarthropathy. Arthritis Rheum 1991,
34:1218-1230.
9. Arnett FC, Edworthy SM, Bloch DA, McShane DJ, Fries JF, Cooper
NS, Healey LA, Kaplan SR, Liang MH, Luthra HS, et al.: The Amer-
ican Rheumatism Association 1987 Revised Criteria for the
Classification of Rheumatoid Arthiritis. Arthritis Rheum 1988,
31:315-324.
10. Kellgren JH, Lawrence JS: Radiological assessment of osteoar-
thritis. Ann Rheum Dis
1957, 16:494-501.
11. Baeten D, Bosch F Van den, Elewaut D, Stuer A, Veys EM, De Key-
ser F: Needle arthroscopy of the knee with synovial biopsy
sampling: technical experience in 150 patients. Clin Rheuma-
tol 1999, 18:434-441.
12. Gu J, Rihl M, Märker-Hermann E, Baeten D, Kuipers JG, Song YW,
Maksymowych WP, Burgos-Vargas R, Veys EM, De Keyser F,
Deister H, Xiong M, Huang F, Tsai WC, Yu DT: Clues to patho-
genesis of spondyloarthropathy derived from synovial fluid
mononuclear cell gene expression profiles. J Rheumatol 2002,
29:2159-2164.
13. Rihl M, Baeten D, Seta N, Gu J, De Keyser F, Veys EM, Kuipers JG,
Zeidler H, Yu DT: Technical validation of cDNA based microar-
ray as screening technique to identify candidate genes in syn-
ovial tissue biopsy specimens from patients with
spondyloarthropathy. Ann Rheum Dis 2004, 63:498-507.
14. Wendt K, Wilk E, Buyny S, Buer J, Schmidt RE, Jacobs R: Gene
and protein characteristics reflect functional diversity of
CD56dim and CD56bright NK cells. J Leukoc Biol 2006,
80:1529-1541.
15. Bustin SA: Absolute quantification of mRNA using real-time
reverse transcription polymerase chain reaction assays. J Mol
Endocrinol 2000, 25:169-193.
16. Pfaffl MW: A new mathematical model for relative quantifica-
tion in realtime RT-PCR. Nucleic Acids Res 2001, 29:e45.
17. Fleige S, Walf V, Huch S, Prgomet C, Sehm J, Pfaffl MW: Com-
parison of relative mRNA quantification models and the impact
of RNA integrity in quantitative real-time RT-PCR. Biotechnol
Lett 2006, 28:1601-1613.
18. Vandooren B, Cantaert T, ter Borg M, Noordenbos T, Kuhlman R,
Gerlag D, Bongartz T, Reedquist K, Tak PP, Baeten D: Tumor
necrosis factor alpha drives cadherin 11 expression in rheu-
matoid inflammation. Arthritis Rheum 2008, 58:3051-3062.
19. Zhang HT, Li LY, Zou XL, Song XB, Hu YL, Feng ZT, Wang TT:
Immunohistochemical distribution of NGF, BDNF, NT-3, and
NT-4 in adult rhesus monkey brains. J Histochem Cytochem
2007, 55:1-19.
20. Freund-Michel V, Frossard N: The nerve growth factor and its
receptors in airway inflammatory diseases.
Pharmacol Ther
2008, 117:52-76.
21. Lambiase A, Bracci-Laudiero L, Bonini S, Bonini S, Starace G,
D'Elios MM, De Carli M, Aloe L: Human CD4+ T cell clones pro-
duce and release nerve growth factor and express high-affin-
ity nerve growth factor receptors. J Allergy Clin Immunol 1997,
100:408-414.
22. Bonini S, Rasi G, Bracci-Laudiero ML, Procoli A, Aloe L: Nerve
growth factor: neurotrophin or cytokine? Int Arch Allergy
Immunol 2003, 131:80-84.
23. Rochlitzer S, Nassenstein C, Braun A: The contribution of neuro-
trophins to the pathogenesis of allergic asthma. Biochem Soc
Trans 2006, 34:594-599.
24. Dou YC, Hagstromer L, Emtestam L, Johansson O: Increased
nerve growth factor and its receptors in atopic dermatitis: an
immunohistochemical study. Arch Dermatol Res 2006,
298:31-37.
25. Raychaudhuri SP, Raychaudhuri SK: Role of NGF and neuro-
genic inflammation in the pathogenesis of psoriasis. Prog
Brain Res 2004, 146:433-437.
26. Reinshagen M, von Boyen G, Adler G, Steinkamp M: Role of neu-
rotrophins in inflammation of the gut. Curr Opin Investig Drugs
2002, 3:565-568.
27. Manni L, Lundeberg T, Fiorito S, Bonini S, Vigneti E, Aloe L: Nerve
growth factor release by human synovial fibroblasts prior to
and following exposure to tumor necrosis factor-alpha, inter-
leukin-1 beta and cholecystokinin-8: the possible role of NGF
Available online />Page 9 of 9
(page number not for citation purposes)
in the inflammatory response. Clin Exp Rheumatol 2003,
21:617-624.
28. Micera A, Vigneti E, Pickholtz D, Reich R, Pappo O, Bonini S,
Maquart FX, Aloe L, Levi-Schaffer F: Nerve growth factor dis-
plays stimulatory effects on human skin and lung fibroblasts,
demonstrating a direct role for this factor in tissue repair. Proc
Natl Acad Sci USA 2001, 98:6162-6167.
29. Patapoutian A, Backus C, Kispert A, Reichardt LF: Regulation of
neurotrophin-3 expression by epithelial-mesenchymal inter-
actions: the role of Wnt factors. Science 1999, 283:1180-1183.
30. Diarra D, Stolina M, Polzer K, Zwerina J, Ominsky MS, Dwyer D,
Korb A, Smolen J, Hoffmann M, Scheinecker C, Heide D van der,
Landewe R, Lacey D, Richards WG, Schett G: Dickkopf-1 is a
master regulator of joint remodeling. Nat Med 2007,
13:156-163.
31. Lazarovici P, Marcinkiewicz C, Lelkes PI: Cross talk between the
cardiovascular and nervous systems: neurotrophic effects of
vascular endothelial growth factor (VEGF) and angiogenic
effects of nerve growth factor (NGF)-implications in drug
development. Curr Pharm Des 2006, 12:2609-2622.
32. Szekanecz Z, Koch AE: Mechanisms of disease: angiogenesis
in inflammatory diseases. Nat Clin Pract Rheumatol 2007,
3:635-643.