Báo cáo y học: "Transporter Molecules influence the Gene Expression in HeLa Cells"
Bạn đang xem bản rút gọn của tài liệu. Xem và tải ngay bản đầy đủ của tài liệu tại đây (1.87 MB, 10 trang )
Int. J. Med. Sci. 2009, 6
18
I
I
n
n
t
t
e
e
r
r
n
n
a
a
t
t
i
i
o
o
n
n
a
a
l
l
J
J
o
o
u
u
r
r
n
n
a
a
l
l
o
o
f
f
M
M
e
e
d
d
i
i
c
c
a
a
l
l
S
S
c
c
i
i
e
e
n
n
c
c
e
e
s
s
2009; 6(1):18-27
© Ivyspring International Publisher. All rights reserved
Research Paper
Transporter Molecules influence the Gene Expression in HeLa Cells
Waldemar Waldeck
1
, Ruediger Pipkorn
2
, Bernhard Korn
3
, Gabriele Mueller
1
, Matthias Schick
3
, Katalin
Tóth
1
, Manfred Wiessler
4
, Bernd Didinger
5
, Klaus Braun
4
1. German Cancer Research Center, Division of Biophysics of Macromolecules, INF 580, D-69120 Heidelberg, Germany
2. German Cancer Research Center, Central Peptide Synthesis Unit, INF 580, D-69120 Heidelberg, Germany
3. German Cancer Research Center, Genomics and Proteomics Core Facilities, INF 580, D-69120 Heidelberg, Germany
4. German Cancer Research Center, Dept. of Medical Physics in Radiology, INF 280, D-69120 Heidelberg, Germany
5. University of Heidelberg, Dept. of Radiation Oncology, INF 400; D-69120 Heidelberg, Germany
Correspondence to: Klaus Braun Ph.D., German Cancer Research Center (DKFZ), Dept. Medical Physics in Radiology, Im
Neuenheimer Feld 280, D-69120 Heidelberg, Germany. Phone: +49 6221-42 2495; Fax: +49 6221-42 3375; e-mail:
Received: 2008.10.12; Accepted: 2008.12.16; Published: 2008.12.18
Abstract
Progresses in biology and pharmacology led to highly specific bioactive substances, but their
poor bioavailability at the site of action is a result of their physico-chemical properties.
Various design approaches for transport carrier molecules facilitating the cellular entry of
bioactive substances could help to reach their molecular target in cells and tissues. The
transfer efficacy and the subsequent pharmacological effects of the cargo molecules are well
investigated, but the investigations of effects of the carrier molecules themselves on the
target cells or tissues remain necessary. A special attention should be paid to the differential
gene expression, particularly in the interpretation of the data achieved by highly specific ac-
tive pharmaceutical products. After application of transmembrane transport peptides, par-
ticularly the pAnt and also the HIV-1 Tat, cells respond with a conspicuous altered gene
expression of at least three genes. The PKN1 gene was induced and two genes (ZCD1 and
BSG) were slightly repressed. The genes and the chromosomes are described, the moderate
differential gene expression graphed, and the ontology is listed.
Key words: Drug Delivery; facilitated Transport; Transport Peptides; Carrier Molecules
Introduction
The transport of negatively charged or high mo-
lecular weight agents across the cellular membrane is
generally highly ineffective; their concentrations at
the (intracellular) target site tend to be far from opti-
mal. The resulting pharmacological effect is often
barely detectable, and covered from influences of ad-
ditional surrounding factors.
To assist nucleic acid-based (= negatively
charged) or macromolecular therapeutics in travers-
ing the cellular membrane, a number of drug delivery
systems (viral and non-viral) have been evaluated
over the years. In principle, virus-based systems har-
bour a great potential due to their high transfer effi-
ciency, and some of them already entered clinical
evaluation for the treatment of severe genetic disor-
ders, like Cystic Fibrosis (CF) and X-linked severe
combined immunodeficiency (SCID) [1-6]. The bio-
medical safety hazard associated with viral vectors,
however, as well as several antigenic and immu-
nological problems, substantially limited the progres-
sion of such “natural” transporters in clinical trials [2,
7-11].
To provide an alternative for such effective viral
transfection agents, significant effort has been put in
establishing non-viral transporter systems [12], as
well as in understanding their membrane transloca-
Int. J. Med. Sci. 2009, 6
19
tion mechanisms [13-16] and in evaluating the bio-
logical effect of the transported cargo [17-19]. Cur-
rently, the following protein fragments harbour a
protein transduction domain (PTD) and, are used as
transport peptides: HIV-1 Tat [17, 20, 21], VP22 [22,
23], and pAnt, known under the name Penetratin™
[24, 25]. An arginine nonamer, the cationic R9 peptide,
has also capable to facilitate the cellular uptake [26,
27]. Their physicochemical properties are
well-documented and their ability to cross cellular
membranes is beyond controversy [15, 16, 28-31, 31].
The pharmacological effects resulting from the appli-
cation of the transport peptides (TPs) themselves,
however, have not been primarily considered thus far.
Little is known about their intrinsic pharmacological
and physiological properties.
In our lab, gene expression experiments with
different transport peptides (TP) in HeLa cells stably
expressing EGFP indicated an increase of EGFP fluo-
rescence upon the application of the transporters
alone particularly after pAnt application (table 1),
revealing an unwanted and unexpected gene expres-
sion. Comparative analyses with different concentra-
tions of TPs showed an influence on the behaviour of
the cells, which may alter the biochemical effect of the
transported cargo and which could consequently in-
fluence the interpretation of the results.
Table 1 List of the examined transport peptides.
The table displays the amino acid sequences of the inves-
tigated transport peptides (TP) and transporter molecules
used in the study. The synthesis and application are de-
scribed in methods.
PTD Amino Acid sequence Acc. No.:
HIV-Tat YGRKKRRQRRRC
*)
P04610
pAnt RQIKIWFQNRRMKWKKC
*)
X03790
TP
6287
MTRQTFWHRIKHKC
*)
Q8ZHK1
TP
6288
KMTRQTWWHRIKHKC
*)**)
-
Polymer
HPMA N-(2-Hydroxypropyl)-Methacrylamide -
*) Single letter code
**) variant with an additional W
For understanding the intrinsic pharmacological
effects of TPs, we investigated to what extent the
HIV-derived Tat fragment (residues 48-60) and the
Drosophila-derived antennapedia homeodomain pro-
tein fragment pAnt (residue 43-58) affected gene ex-
pression in HeLa cells. In addition, two novel trans-
membrane transporters termed TP
6287
and TP
6288
(table
1), have been included in these analyses. TP
6287
and
TP
6288
are peptide fragments derived from the DNA
sequence of the non-pathogenic Yersina pestis strain
91001 [32]. As additional controls, the effects of the
HiPerfect Transfection Reagent (Qiagen, Cat No.
301704) and of the prototypic polymeric hydrophilic
N-(2-hydroxypropyl)methacrylamide drug carrier
(pHPMA) [33-35] were evaluated. With microarray
technology and quantitative RT-PCR, we assessed the
transcriptional responses resulting from the incuba-
tion of HeLa cells with the transporter molecules [36].
Material and Methods
Peptide Synthesis and Purification
For solid phase synthesis of the peptides
RQIKIWFQNRRMKWKK [pAnt
43-58
] and
YGRKKRRQRRR [HIV-1 Tat
48-60
] and
KKMTRQTWWHRIKHKC [TP
6288
] and
KMTRQTFWHRIKHKC [TP
6287
] we employed the
Fmoc (9-fluorenyl-methyloxycarbonyl) methodology
[37, 38] in a fully automated multiple synthesizer
(Syro II from Multi Syntech Germany). As coupling
agent 2-(1H-Benzotriazole-1-yl)-1,1,3,3-tetramethylu-
roniumhexafluoro-phosphate (HBTU) was used. The
following side chain protecting groups were em-
ployed: Boc(tert-butyloxycarbonyl) for Lys and Trp,
Trityl(triphenylmethane) for Gln and Asn and Pbf
(2,2,4,6,7-Pentamethyldihydrobenzofurane-5-sulfonyl
) for Arg. Fmoc-Lys(Dabcyl) was purchased from
Merck Biosciences GmbH, Germany. The synthesized
peptides were cleaved and deprotected from the solid
support by treatment with 90% trifluoroacetic acid,
8% tri-isopropyl silane and 2% water (v/v/v/) for 2.5
h at room temperature. The products were precipi-
tated in ether. The crude material was purified by
preparative HPLC on a Kromasil 100–10C 18 µm re-
verse phase column (30 × 250mm) using an eluent of
0.1% trifluoro acetic acid in water (A) and 80% ace-
tonitrile in water (B). The peptide was eluted with a
successive linear gradient of 10% B to 80% B in 30 min
at a flow rate of 23 ml/min. The fractions corre-
sponding to the purified protein were lyophilized.
The purified material was characterized with ana-
lytical HPLC and matrix assisted laser desorption
mass spectrometry (MALDI-MS).
Synthesis and characterization of pHPMA
The HPMA copolymer used in this study was
described by Lammers [39]. The weight- and num-
ber-average molecular weights (M
w
and M
n
) and the
polydispersity (M
w
/ M
n
) of the copolymer after their
fractionation (on Superose 4B/6B columns) were de-
termined by size exclusion chromatography on an
Äkta Explorer (Amersham Biosciences), equipped
with UV, a differential refractometer (Shodex R-72)
and a multiangle light scattering detector (DAWN
DSP-F). The average molecular weights of the co-
Int. J. Med. Sci. 2009, 6
20
polymer, which will be further referred to as pHPMA,
was 31 kD and its polydispersity was 1.3.
Cell Culture
Adherent HeLa cells were grown in a 5% CO
2
humidified atmosphere at 37°C and passaged in
RPMI1640 medium without phenol red, supple-
mented with 10% fetal calf serum (FCS) (Biochrom,
Germany). For expression profiling studies the cells
were treated with the different cell penetrating pep-
tides: fragments from Drosophila pAnt
43-58
or viral
HIV-1 Tat
48-60
, the polymer HPMA or the avirulent
bacterial fragments ([TP
6287
and TP
6288
] respectively)
for 1 hour. The TPs were applied to 1 × 10
6
cells per
probe. We added 0.1 µl TP (1 mg/ ml) diluted to 100
µl medium (without FCS) to the HeLa cells in 2 ml
medium. As a control, cells were transfected using
HiPerfect Transfection Reagent (Qiagen, Hilden,
Germany) as proposed by the manufacturer.
Fluorimeter Measurements
HeLa cells were stably transfected with a GFP
mutant (D2-GFP [BD, Clontech]) with 2 hours half
life. The D2-GFP cells were used to determine the
relative amount GFP-expression in cells by spectro-
scopic fluorescence measurements. These HeLa
D2-GFP cells were trypsinized after treatment and
adjusted to a cell number of 1 million cells per ml with
Hank´s solution. In each single experiment identical
cell numbers were used.
Fluorescence emission spectra measurements
were accomplished with an SLM-AMINCO 8100
fluorescence spectrometer (SLM, Urbana, IL) using a
150 W Xenon lamp. The excitation in the fluorimeter
was fixed at 475 nm; the emission spectra were
scanned from 500 to 620 nm with 4 nm monochro-
mator slit width for excitation and emission. Integra-
tion time was 0.2 sec; scan mode was performed at
fixed High Voltage for photomultiplier (PMT) 1HV =
1000, for PMT 2HV= 350. The measurements show a
change of the EGFP gene expression after treatment
with identical amounts of transporter molecules. The
estimated relative fluorescence showed a dependence
on the applied carrier molecules.
RNA Isolation
The transporter molecules were applied to the
culture medium thus was removed after 2h and after
24 h, cells were washed with Hank´s. The RNA was
extracted with the Qiagen RNeasy Plus Kit (Qiagen
Hilden, Germany) briefly as follows: The cells were
washed twice with Hank´s solution and extracted
with 1ml of extraction solution. The cells were scraped
and transferred into micro-centrifuge-tubes, and then
the cells were homogenized by squeezing though a
needle 0.9 × 12 mm followed by centrifugation
through a gDNA-Eliminator column for 30 sec at
10.000 rpm in the micro centrifuge. An equal volume
of 70% ethanol was added to the eluate mixed with a
pipet and applied to the RNeasy spin column. This
was eluted with 700 µl RW1–buffer by centrifugation
for 15 sec at 10000 rpm followed by addition of
RPE-buffer 2 × 500 µl and centrifugation at 10000 rpm
for 15 sec. Then the column was centrifuged to dry-
ness and eluted by centrifugation with water
(2 × 30 µl) for 30 sec and 2 min respectively.
BeadArray gene expression analysis
We used an integrated genomics profiling and
computational biology based strategy to identify the
key genes and gene clusters whose expression are
altered after exposure to different transmembrane
TPs. Samples were amplified reversly transcribed
using 100 ng of total RNA as input material by the
method of Van Gelder [40]. Amplified RNA synthesis
was performed using the Illumina®TotalPrep™RNA
AmplificationKit (Inc., San Diego, CA) following the
manufacturer’s instructions. Labeling was achieved
by incorporation of biotin-16-UTP at a ratio of 1:1 with
unlabeled UTP. Labeled, amplified material (1.25 µg
per array) was hybridized to the Illumina Human-
Ref-8 v2 BeadChip, (Illumina, Inc., San Diego, CA)
arrays were scanned with an Illumina BeadArray
Reader (confocal scanner) and array data were proc-
essed and analyzed with Illumina’s BeadStudio Data
Analysis Software according the definitions of the
Illumina’s (ILL) data as well as the ILL annotations.
Real Time PCR
Total RNA preparations, as used for chip analy-
sis, were also taken for cDNA synthesis with Roche’s
Transcriptor High Fidelity cDNA Synthesis Kit. Fol-
lowing the manufacturers instructions 3µg RNA per
sample were reversely transcribed using an-
chored-oligo(dT)18 primer in 20µl total volume for 30
minutes at 50°C. The final concentration of the unpu-
rified cDNA was adjusted to 25ng/µl assuming 100%
efficiency. “No RT” controls (same setup without re-
verse transcriptase) have been prepared for each total
RNA as well.
The real-time RT-PCR was carried out in tripli-
cates using a Roche LightCycler 480 system with a
384-well block and the software version 1.2. The 10µl
reaction consisted of 25ng of transcribed RNA (1µl),
1pmol Universal Probe (0.1µl), 50pmol each of for-
ward + reverse primer (0.5µl), water (3.4µl) and 2×
LightCycler 480 Probes Master mix. The
PCR-program also was used according to the manu-
facturer’s instructions. “No template controls” and
Int. J. Med. Sci. 2009, 6
21
“No RT-controls” (for each cDNA-sample) showed no
contamination probably affecting the results. The
normalized ratio was calculated using the Relative
Quantification module with the 24 hours untreated
control as “Calibrator”, and the HPRT1 as reference
gene resulting in individual efficiency of every single
gene.
Results and Discussion
Transfection reagents facilitate the introduction
of active agents e.g. negatively charged molecules,
like polyanionic nucleic acids, into target cells, in or-
der to express a therapeutic or a reporter gene. The
aim is to transfer cargos across cellular membranes in
a safe and proper way while circumventing and
avoiding undesired reactions. However, as already
described in the introduction section, the choice of the
transfection technology has a slight impact on the
gene expression of the EGFP reporter in HeLa cells
(figure 1).
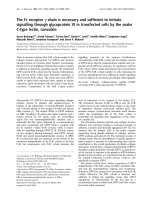
Figure 1 Fluorometric measurements of EGFP expres-
sion. The graph shows the influence of the investigated
transport carriers on the expression of EGFP in stably
transfected HeLa cells (relative fluorescence intensity) after
the incubation time of 72 hours. The peptides [TP6287 (
);
TP6288 (
); pAnt ( ); HIV-Tat ( )] and the polymer
[pHPMA (
)] were applied in the range of 10 – 1000 ng/µl
final concentration as described in methods.
This lead us to compare the influence of the
various transport methods on gene expression. We
investigated how 5 different molecules and one pro-
totypic polymeric carrier influence a gene expression
response. At first, we selected a series of induced and
repressed genes more than twofold, selected by mi-
croarray analysis, which resulted after control with
RT-PCR in a moderate influence on gene expression.
The bacterially-originated peptides (TP
6287
and TP
6288
)
and the virus-derived peptide showed hardly de-
tectable effects on gene expression.
We found that the pAnt molecule had a little ef-
fect on gene expression and affected the expression of
19 genes, the HIV-1 Tat peptide the expression of 18
genes and the two Yersina-derived delivery systems
TP
6287
8 genes and TP
6288
7 genes respectively. In ad-
dition, also the copolymer pHPMA, which is known
to be inert, non-immunogenic and non-toxic, ap-
peared to affect the transcription of 18 genes in HeLa
cells marginally, but below the subthreshold of 5%.
These findings suggest that one should realize that the
implementation of transfection agents and transporter
molecules have some impact on the gene expression
patterns, when analyzing the efficacy and the genetic
consequences of targeted gene therapy in vitro (and in
vivo).
Microarray Study
Differential Gene Expression
Differential gene expression profiling is rou-
tinely used to detect genes expressed under condi-
tions such as cancer or cellular stress response but
cannot determine the global players involved in such
complex phenotypes. Integration of the gene expres-
sion profiling with specific modulation of gene ex-
pression in relevant signalling pathway models can
identify complex pharmacological functions con-
trolled by the characterized genes. The different qual-
ity controls (QC1-QC5) of the expression analysis us-
ing human Sentrix-8 V2 (1740115221 – 1740115260)
show a positive gradient hybridization signal re-
sponse, low signals in the stringency controls, a suc-
cessful staining of the test samples, clear negative
controls and noise, and an expected expression of
housekeeping genes. The samples were very homo-
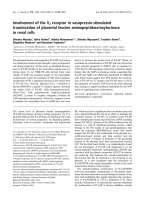
geneous (figure 2). The expression study was per-
formed threefold.
The obtained data proved reliable. The primary
separation into the defined times points: 2 and 24
hours exhibit a samples's clustering for the time be-
ing. The probe IDs show no visible change in the gene
expression 2 hours after treatment with the trans-
porter molecules. The 24 hours probes show a mod-
erately changed gene expression indicated by the
Pearson correlation as illustrated in figure 2.
Characteristically up or down regulated genes
were detected after processing and analyzing with
Illumina’s BeadStudio Data Analysis Software and are
described in the following part according the defini-
tions of the Illumina’s (ILL) data as well as of the Il-
lumina’s annotations (table 2).
Int. J. Med. Sci. 2009, 6
22
Table 2 Microarray detected genes after treatment with transport peptides. The table lists the up (induced)
or down regulated (repressed) genes detected by microarray investigations. The left column describes the chromosomal
locations, the second column the gene symbols, the third the RefSeq accession number. The following six columns describe
the induction or repression by the different transporter molecules applied. In addition the genes whose gene expression
shows the most noticeable changes are gray highlighted. The annotations and the corresponding gene maps (left column) are
listed and show genes differentially expressed (induced = highlighted in red; repressed = highlighted in blue).