Báo cáo y học: "Identification of progressors in osteoarthritis by combining biochemical and MRI-based markers" pptx
Bạn đang xem bản rút gọn của tài liệu. Xem và tải ngay bản đầy đủ của tài liệu tại đây (508.58 KB, 11 trang )
Open Access
Available online />Page 1 of 11
(page number not for citation purposes)
Vol 11 No 4
Research article
Identification of progressors in osteoarthritis by combining
biochemical and MRI-based markers
Erik B Dam
1
, Marco Loog
1,2,3
, Claus Christiansen
1
, Inger Byrjalsen
1
, Jenny Folkesson
2
,
Mads Nielsen
1,2
, Arish A Qazi
2
, Paola C Pettersen
4
, Patrick Garnero
5
and Morten A Karsdal
1
1
Nordic Bioscience, Herlev Hovedgade 207, 2730 Herlev, Denmark
2
University of Copenhagen, Department of Computer Science, Universitetsparken 1, 2100 Copenhagen, Denmark
3
Delft University of Technology, Faculty of Electrical Engineering, Mathematics, and Computer Science, Mekelweg 4, 2628 CD Delft, The Netherlands
4
Center for Clinical and Basic Research, Ballerup Byvej 222, 2750 Ballerup, Denmark
5
CCBR-Synarc, Molecular Markers, Rue Montbrillant 16, 69003 Lyon, France
Corresponding author: Erik B Dam,
Received: 6 Feb 2009 Revisions requested: 14 Apr 2009 Revisions received: 22 May 2009 Accepted: 24 Jul 2009 Published: 24 Jul 2009
Arthritis Research & Therapy 2009, 11:R115 (doi:10.1186/ar2774)
This article is online at: />© 2009 Dam et al.; licensee BioMed Central Ltd.
This is an open access article distributed under the terms of the Creative Commons Attribution License ( />),
which permits unrestricted use, distribution, and reproduction in any medium, provided the original work is properly cited.
Abstract
Introduction At present, no disease-modifying osteoarthritis
drugs (DMOADS) are approved by the FDA (US Food and Drug
Administration); possibly partly due to inadequate trial design
since efficacy demonstration requires disease progression in
the placebo group. We investigated whether combinations of
biochemical and magnetic resonance imaging (MRI)-based
markers provided effective diagnostic and prognostic tools for
identifying subjects with high risk of progression. Specifically,
we investigated aggregate cartilage longevity markers
combining markers of breakdown, quantity, and quality.
Methods The study included healthy individuals and subjects
with radiographic osteoarthritis. In total, 159 subjects (48%
female, age 56.0 ± 15.9 years, body mass index 26.1 ± 4.2 kg/
m
2
) were recruited. At baseline and after 21 months,
biochemical (urinary collagen type II C-telopeptide fragment,
CTX-II) and MRI-based markers were quantified. MRI markers
included cartilage volume, thickness, area, roughness,
homogeneity, and curvature in the medial tibio-femoral
compartment. Joint space width was measured from
radiographs and at 21 months to assess progression of joint
damage.
Results Cartilage roughness had the highest diagnostic
accuracy quantified as the area under the receiver-operator
characteristics curve (AUC) of 0.80 (95% confidence interval:
0.69 to 0.91) among the individual markers (higher than all
others, P < 0.05) to distinguish subjects with radiographic
osteoarthritis from healthy controls. Diagnostically, cartilage
longevity scored AUC 0.84 (0.77 to 0.92, higher than
roughness: P = 0.03). For prediction of longitudinal
radiographic progression based on baseline marker values, the
individual prognostic marker with highest AUC was
homogeneity at 0.71 (0.56 to 0.81). Prognostically, cartilage
longevity scored AUC 0.77 (0.62 to 0.90, borderline higher than
homogeneity: P = 0.12). When comparing patients in the
highest quartile for the longevity score to lowest quartile, the
odds ratio of progression was 20.0 (95% confidence interval:
6.4 to 62.1).
Conclusions Combination of biochemical and MRI-based
biomarkers improved diagnosis and prognosis of knee
osteoarthritis and may be useful to select high-risk patients for
inclusion in DMOAD clinical trials.
AC: cartilage area; AUC: area under the receiver-operator characteristics curve; BIPED: Burden of Disease, Investigative, Prognostic, Efficacy of Inter-
vention and Diagnostic; BL: baseline; CongClAB: cartilage congruity over the load-bearing area of bone; CTX-II: marker of collagen type II C-telopep-
tide fragment; DMOAD: disease-modifying osteoarthritis drug; ELISA: enzyme-linked immunosorbent assay; FDA: US Food and Drug Administration;
FU: follow-up; GEE: generalized estimation equations; HomC: cartilage homogeneity; JSN: joint space narrowing; JSW: joint space width; KL: Kell-
gren and Lawrence index; MF: medial femoral; MRI: magnetic resonance imaging; MT: medial tibial; MTF: medial tibio-femoral; n
GEE
: required study
population size calculated from GEE; n
PA
: required study population size calculated from power analysis; OA: osteoarthritis; OR: odds ratio; Rou-
ClAB: cartilage roughness over the load-bearing area of bone; ThCtAB: cartilage thickness over the total area of bone; ThCQ: cartilage thickness
10% quantile; VC: cartilage volume.
Arthritis Research & Therapy Vol 11 No 4 Dam et al.
Page 2 of 11
(page number not for citation purposes)
Introduction
Osteoarthritis (OA) is a slow, chronic disease characterized by
cartilage degradation and typically leading to joint space nar-
rowing (JSN), mobility loss, pain, and eventually joint replace-
ment.
There is presently no disease-modifying osteoarthritis drug
(DMOAD) with a consistent, documented effect despite sev-
eral clinical attempts in late-stage phases. Some studies may
have failed due to suboptimal clinical trial design [1], resulting
in very low progression in placebo patients [2-4], thus reduc-
ing the power to detect potential treatment efficacy. One
phase III study demonstrated a reduction of radiographic pro-
gression in the most affected knee but no effect was observed
in the contralateral knee; and without reduction of pain [5].
These findings suggest that effective therapies could be
developed, but also indicate the need for tools allowing iden-
tification of rapid progressors who may be suitable for inclu-
sion in DMOADs trials.
Total joint replacement may appear to be the most valid clinical
endpoint, although it is highly dependent on local health poli-
cies, patient perception, and physician assessment. Owing to
the low incidence of total joint replacement, long and large
studies would be needed to detect a treatment effect using
this endpoint. Alternatively, an estimate of the time to surgery
could be used. At present, however, no markers have demon-
strated a convincing prediction of total joint replacement [6].
Additionally, such trials would probably need to target patients
with end-stage disease who may not be the most adequate
subjects to be studied with chondroprotective therapies.
Structural joint damage is currently monitored by JSN from
plain radiographs. Since JSN has limited sensitivity to change
[2,3,7], large study populations are required. Secondly, radio-
graphs do not allow direct quantitative evaluation of cartilage
tissue.
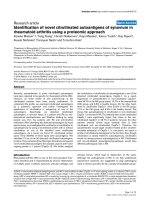
DMOAD development may be improved by appropriate
biomarkers during all steps of the development process [8,9].
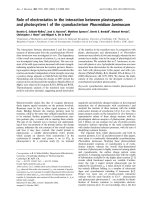
Several biomarker types are needed for clinical studies (Figure
1). Following the BIPED (Burden of Disease, Investigative,
Prognostic, Efficacy of Intervention and Diagnostic) classifica-
tion [8], a diagnostic marker would be useful to ensure inclu-
sion of an homogenized population at a certain stage of the
disease; and a prognostic marker is also needed for selecting
those in this group at a high risk for disease progression.
Finally, an efficacy of intervention marker is crucial for rapidly
quantifying treatment response.
As an alternative to JSN for monitoring structural damage, bio-
chemical markers of protease degraded cartilage matrix con-
stituents have attracted research attention [9,10]. Some
markers target pathological activities such as matrix metallo-
proteinase-mediated collagen type II degradation or aggreca-
nase-mediated aggrecan degradation [11,12]. Among them,
urinary C-telopeptides of type II collagen were associated with
radiographic disease risk [13,14] and with an increase in
structural damage (JSN) [13]. As an example, for short proof-
of-concept phase II clinical trials, the slow progression of JSN
relative to the biological variation may require large study pop-
ulations – here the biochemical markers may be an appealing
alternative.
Alternative imaging technologies – and particularly magnetic
resonance imaging (MRI) – also seem promising to assess
disease progression. Specifically, MRI offers direct assess-
ment of cartilage [15,16] and allows morphometric three-
dimensional analysis. Several semi-automatic methods for car-
tilage quantification have been reported [17-19], including
scoring systems integrating several joint features – for exam-
ple, the Whole-Organ Magnetic Resonance Imaging Score
[20]. Our group recently reported a fully automatic computer-
based framework for quantification of several morphometric
parameters, including cartilage volume, thickness, homogene-
ity, and curvature [21-24], targeting both cartilage quantity
and quality.
Combinations of different marker modalities – for instance,
markers of dynamic turnover (typically biochemical markers)
and assessment of current status (for example, by MRI) – may
provide complementary information and thereby superior iden-
tification of progressors for clinical trial design.
The purpose of the present study was to evaluate whether
combinations of biochemical and imaging-based markers
allowed, with higher accuracy than the individual markers,
selection of the subjects at high risk of progression.
Figure 1
Marker types needed for clinical studyMarker types needed for clinical study. For a clinical study, diagnostic
and prognostic markers are needed to select a population at the proper
stage of osteoarthritis (OA) with a high risk of progression; and an effi-
cacy marker is needed to evaluate the treatment effect. Supplementing
the diagnostic marker, a burden of disease marker could be used to
assess the total disease severity.
Available online />Page 3 of 11
(page number not for citation purposes)
Materials and methods
The radiographs, urine samples, and MRI scans for this study
were acquired at baseline (BL) and at follow-up after 21
months (FU). A subgroup had BL data re-acquired for evaluat-
ing the reproducibility of the measurements.
Population
The study included 159 subjects randomly selected to include
a normal population with a large age range and a group with
elevated risk of having knee OA. The majority were invited from
address lists to ensure even distribution across gender and
ages, supplemented with volunteers with known knee prob-
lems. The exclusion criteria ensured that no subject had previ-
ous knee joint replacement, other joint diseases (for example,
rheumatoid arthritis, Paget's disease, joint fractures, hyperpar-
athyroidism, hyperthyroidism and hypothyroidism), contraindi-
cations for performing MRI examination, or were receiving
medication affecting bone and/or cartilage (for example,
bisphosphonates, vitamin D, hormones, selective estrogen
receptor modulators, prednisolone, anabolic androgens, and
parathyroid hormone). Participants were invited to attend a fol-
low-up visit after 21 months.
From this base collection of 318 left and right knees, five
knees were excluded due to inferior imaging quality. Another
25 knees were used for training of the automatic MRI quantifi-
cation methods and were excluded from the evaluation set.
Furthermore, a single subject was excluded since a urine sam-
ple was not acquired. Thereby, 287 knees were included in the
evaluation set at BL. A subgroup of 31 knees had imaging data
re-acquired 1 week after BL. At FU, 250 knees were studied.
For each test subject, their age, sex, weight, and height were
recorded at BL and FU. The baseline characteristics are pre-
sented in Table 1.
Knees were scored by the Kellgren and Lawrence index (KL)
[25] for the level of OA. At BL, 51% of the evaluation knees
were healthy (KL 0); the overall distribution of the KL for the
287 knees scored by the KL [25] for their level of OA was
[145,87,30,24,1] (for KL 0.4). For the rescan subgroup, 35%
were healthy with a KL distribution of [11,13,2,5,0]. At FU 103
of the healthy individuals had remained at KL 0, and 25 individ-
uals had progressed (defined as an increase in KL score by
one or more grades). Additionally, 10 of those individuals with
OA at BL had progressed at FU after 21 months (these 10
progressors were distributed [6,3,1] from KL 1 to KL 3).
All participants signed approved information consent, and the
study was carried out in accordance with the Helsinki Decla-
ration II and European Guidelines for Good Clinical Practice
[26]. The study protocol was approved by the local Ethical
Committee.
Protocol and quantification for radiographs
Digital knee radiographs were acquired with the subjects
standing in a weight-bearing position with knees slightly flexed
and feet rotated externally. The SynaFlex (developed by
Synarc, San Francisco, USA) was used to ensure position
reproducibility [27].
The focus film distance was 1.0 m and tube angulation was
10° (the metatarsophalangeal view modified for fixed angle
[28]). Posterior–anterior radiographs were acquired while the
central beam was directed to the midpoint of the line through
both popliteal regions. Radiographs of both knees were
acquired simultaneously.
For each X-ray scan, the medial tibio-femoral compartment
was scored by a trained radiologist. The KL was scored by
qualitative evaluation of osteophytes, joint gap narrowing, and
Table 1
Demographic and central biomarker values at baseline for the evaluation population
Females (48%) Males (52%)
Healthy (n = 66) KL > 0 (n = 72) Healthy (n = 79) KL > 0 (n = 70)
Age (years) 47 (17) 63 (12)*** 49 (16) 65 (7)***
Height (cm) 166 (6) 164 (6)* 178 (7) 176 (7)
Weight (kg) 67 (12) 72 (12)* 81 (12) 88 (12)***
Body mass index (kg/m
2
) 24.3 (4.5) 26.9 (4.2)*** 25.5 (3.4) 28.4 (4.0)***
Joint space width (mm) 3.8 (0.7) 3.3 (1.2)** 4.4 (0.7) 3.3 (1.6)***
Volume (MTF.VC) (mm
3
) 5,742 (1,265) 5,906 (1,081) 8,112 (1,216) 7,468 (1,693)**
CTX-II/Cr (g/mmol) 0.20 (0.11 to 0.36) 0.23 (0.11 to 0.48) 0.19 (0.11 to 0.32) 0.23* (0.13 to 0.41)
Demographic and central biomarker values at baseline for the 287 knees in the evaluation population (excluding the 25 knees used for training)
divided by gender and by radiographic osteoarthritis status. Values presented as mean (standard deviation), or as geometric mean (± 1 standard
deviation range) for the urinary collagen type II C-telopeptide marker normalized by creatinine levels (CTX-II/Cr). KL, Kellgren and Lawrence index;
MTF.VC, medial tibio-femoral cartilage volume. The level of significance denotes for each gender the difference between the healthy group and the
osteoarthritis group: *P < 0.05, **P < 0.01, ***P < 0.001.
Arthritis Research & Therapy Vol 11 No 4 Dam et al.
Page 4 of 11
(page number not for citation purposes)
subchondral bone sclerosis for severe cases. The joint space
width (JSW) was measured by manually marking the narrow-
est gap between the tibia and the femur. Additionally, the
width of the tibial plateau was measured to quantify the knee
size – covering medial and lateral compartments but excluding
osteophytes. The intra-observer scan–rescan coefficients of
variation were 2.5% and 0.8% for the JSW and the plateau
width, respectively.
Protocol and quantification for urine samples
For all subjects, fasting morning urine samples were collected
(second void). Urinary levels of collagen type II C-telopeptide
fragments (CTX-II) were measured by the CartiLaps ELISA
assay (Nordic Bioscience Diagnostics, Herlev, Denmark). This
assay uses a monoclonal antibody mAbF46 specific for a six-
amino-acid epitope (EKGPDP) derived from the collagen type
II C-telopeptide [29]. CTX-II was corrected for urinary creati-
nine as assessed by a standard colorimetric method. To
reduce measurement and to allow precision evaluation, values
were calculated as the mean of two separate determinations.
For the statistical analysis, the CTX-II values were logarithmi-
cally transformed to obtain normality.
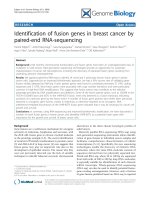
Protocol and quantification for MRI
MRI scans were acquired from a 0.18 T Esaote C-span dedi-
cated extremity scanner (Esaote, Genova, Italy). A single knee
coil was used and each knee was imaged separately. We used
a sagittal Turbo 3D T1 sequence with near-isotropic voxels
(40° flip angle, repetition time 50 ms, echo time 16 ms, scan
time 10 minutes, resolution 0.7 mm × 0.7 mm × 0.8 mm). The
scans had approximately 110 slices (depending on the knee
size) and each slice was 256 × 256 pixels. Near-isotropic vox-
els are suitable for three-dimensional image analysis in general
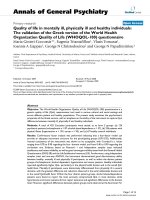
– and are also suitable for cartilage quantification [30]. Figure
2 (top left) shows an example MRI scan. The subjects were
scanned in a supine position with no load-bearing during or
prior to scanning.
The 25 scans in the training collection were segmented by
slice-wise outlining of the medial tibial and femoral cartilage
compartments by an expert radiologist. These segmentations
were used to train a voxel classification scheme based on a
multi-scale k-nearest neighbor framework [31]. This method
provides automatic segmentation of the tibial and femoral car-
tilage compartments (Figure 2, top right).
From the segmentations, the volume and surface area were
computed (MT.VC, MF.VC, MTF.VC, MT.AC, MF.AC, and
MTF.AC using the Eckstein nomenclature [32]). Furthermore,
the cartilage homogeneity was quantified as one minus
entropy, with signal intensity entropy computed in the com-
partments [23] (MT.HomC, MF.HomC, MTF.HomC). Entropy
quantifies the intensity histogram complexity; cartilage with
more uniform intensity has lower entropy (higher homogene-
ity). Since the scans are T1, this measure of homogeneity is
related to water distribution and proteoglycan concentration.
Also, clear definition of the internal cartilage layers will be
imaged by separate intensities and will contribute to higher
entropy. A loss of structural integrity may therefore lead to
lower entropy and higher cartilage homogeneity.
The cartilage surface roughness (inverse of smoothness) was
quantified for the tibial compartment by measuring the mean
surface curvature over a region-of-interest including the cen-
tral load-bearing region and approximately one-half of the car-
tilage surface (MT.RouClAB). The surface curvature was
estimated using geometric surface evolution at fine-scale res-
olution [21,24,33]. Fibrillation and minor focal lesions lead to
decreased smoothness.
For the remaining quantifications, a statistical cartilage shape
model was fitted to the segmented tibial cartilage sheets (Fig-
ure 2, top right). By training the model on healthy samples, the
resulting cartilage model covers the bone area that a healthy
cartilage sheet would cover [34]. The measured mean thick-
ness thereby included denuded regions with zero thickness
(MT.ThCtAB). The thickness map is illustrated in Figure 2 (bot-
tom left). Additionally, the thickness map 10% quantile was
used as a measure targeting local thinning related to focal
lesions (denoted MT.ThCQ).
Figure 2
Magnetic resonance imaging-based biomarker quantification frame-workMagnetic resonance imaging-based biomarker quantification frame-
work. Top left: a slice from a magnetic resonance imaging scan. Top
right: segmentation of the medial tibial cartilage compartment shown in
sagittal and coronal slice with a shape model fitted to the segmenta-
tion. Bottom left: thickness map. Bottom right: curvature map in the
central region of interest used for the curvature marker. All computa-
tional steps are fully automatic.
Available online />Page 5 of 11
(page number not for citation purposes)
Finally, the mean surface curvature of the shape model was
analyzed. Owing to model regularization this coarse scale cur-
vature relates to the overall bending of the sheet and is there-
fore indirectly related to the congruity of the joint. This
simplified congruity measure (MT.CongClAB) was quantified
as the mean inverse curvature across the region of interest
(Figure 2, bottom right) also used for the roughness measure
[21,22,24,33].
All steps performed on the MRI are carried out in a fully auto-
mated computer-based framework in three dimensions (rather
than in each individual MRI slice). The scan – rescan precision
for each marker is presented in Table 2.
Aggregate markers of cartilage longevity
We evaluated combinations of biochemical and MRI-based
markers for cartilage breakdown, quantity, and quality. Such
combinations may exploit complementary information from the
individual markers.
From the available markers, such a combination could be CTX-
II (cartilage matrix breakdown), volume (quantity), and homo-
geneity (quality); we denote this aggregate marker longevity-
basic. Here, volume and homogeneity were totals for the tibial
and femoral compartments.
A more comprehensive combination includes all the available
MRI quantifications. Since some quantifications were only per-
formed in the tibial compartment, we combined CTX-II (break-
down) with all medial tibial MRI markers: volume and thickness
(quantity), area (a marker of quantity; combined with volume, it
may provide an aspect of quality), congruity, roughness, and
homogeneity (markers for quality). We denote this aggregate
marker longevity-tib.
Finally, for comparison, we also evaluated an aggregate
marker combining all medial tibial MRI markers (that is, longev-
ity-tib without CTX-II). This was denoted MRI-tib.
We investigated the performance of linear combinations of
these individual markers by means of pattern recognition meth-
ods [35]. Here, methods also exist for combining markers in
non-linear or non-parametric fashion [35]. We limited our-
selves to combinations defined by linear discriminant analysis,
however, since it allows direct interpretation of the aggregate
biomarker as a weighted sum of individual markers.
Evaluation of aggregate markers
When performing linear discriminant analysis, the resulting
combination is prone to overfitting/overtraining when the
number of markers is high relative to the population size, and
the aggregate marker weights can be optimized to model arbi-
trary measurement variations that are not representative of the
actual disease progression.
We therefore performed an evaluation where the population
was repeatedly split randomly into two subpopulations with
approximately equal size and distribution of levels of OA. For
each split, we optimized the weights for the aggregate biomar-
ker on one training subpopulation (using linear discriminant
analysis) and we evaluated the resulting aggregate marker on
the other evaluation subpopulation. The median performance
on the evaluation subpopulations estimates the aggregate
marker performance including generalization ability. We used
500 repetitions.
In order to allow direct comparison of individual and aggregate
markers, we evaluated the individual markers equivalently
using repeated random subpopulations.
Statistical analysis
The demographic and biochemical markers provide one meas-
urement per subject. The markers based on radiographs and
MRI scans each provide one measurement per knee. This
requires specific handling of the intra-subject correlation
between knee observations in the analysis. We perform this in
two alternative ways in the analysis. Firstly, we combine the
two knee measurements into a single subject measurement by
averaging – this allows use of standard statistical analysis.
Secondly, we perform analysis by generalized estimation
equations (GEE) that explicitly model the inter-knee correlation
within subjects.
We defined the diagnostic performance as the ability of the BL
marker values to separate healthy or borderline cases (KL 1)
from OA knees (KL >1). For the subject-averaged measure-
ments this was evaluated by the P value from multivariate anal-
ysis of variation (based on Hotelling's T
2
test [36]), by the
corresponding required study population size calculated from
power analysis (n
PA
) requiring 80% power and a significance
level of 0.05, and by the area under the receiver-operator char-
acteristics curve (AUC). We used DeLong and colleagues'
non-parametric approach [37] to test whether AUC values
were statistically different. Using GEE we also calculated the
P value and the sample size (n
GEE
), again requiring 80%
power and a significance of 0.05. The GEE P value was com-
puted using the GEEQBOX package [38], and the sample
size was calculated by a Matlab implementation of Rochon's
procedure [39].
The prognostic performance was defined as the ability of the
BL values to separate healthy non-progressors (KL 0 at BL
and FU) from early progressors (KL 0 at BL and KL > 0 at FU),
and was evaluated by the same analysis as for diagnostic
markers above and then adding the odds ratio (OR). For esti-
mating the OR, the population was split into low/high groups
where the threshold for each marker was defined by cross-val-
idation on the train/evaluation subpopulations (unless explicitly
stated otherwise). The Breslow-Day test using Tarone's
adjustment [40] was used for testing whether differences
Arthritis Research & Therapy Vol 11 No 4 Dam et al.
Page 6 of 11
(page number not for citation purposes)
Table 2
Results for the individual and aggregate biomarkers for use as diagnostic markers and prognostic markers
Biomarker CV (%) Diagnostic marker Prognostic marker
p
GEE
(n
GEE
)
p
MAN
(n
PA
)
AUC p
GEE
(n
GEE
)
p
MAN
(n
PA
)
AUC OR
Gender 0.55
(-)
0.6
(-)
0.53
(0.42 to 0.63)
0.46
(-)
0.49
(-)
0.56
(0.43 to 0.70)
1.8
Body mass index 0.01
(51)
0.01
(51)
0.72
(0.62 to 0.82)
0.09
(-)
0.14
(-)
0.64
(0.47 to 0.80)
2.7
Joint space width 1.8 0.002
(41)
<0.001
(36)
0.73
(0.58 to 0.86)
0.44
(-)
0.38
(-)
0.59
(0.41 to 0.78)
1.4
Width 0.7 0.13
(-)
0.21
(-)
0.62
(0.51 to 0.72)
0.2
(-)
0.46
(-)
0.57
(0.39 to 0.75)
1.1
CTX-II 11.5 0.02
(70)
0.01
(64)
0.70
(0.57 to 0.81)
0.22
(-)
0.22
(-)
0.67
(0.50 to 0.84)
3.2
Volume
MT.VC 3.9 0.61
(-)
0.62
(-)
0.51
(0.40 to 0.63)
0.13
(-)
0.39
(-)
0.60
(0.43 to 0.76)
2.4
MF.VC 4.9 0.65
(-)
0.59
(-)
0.51
(0.38 to 0.65)
0.06
(-)
0.25
(-)
0.63
(0.49 to 0.80)
2.8
MTF.VC 3.4 0.64
(-)
0.62
(-)
0.51
(0.39 to 0.64)
0.07
(-)
0.28
(-)
0.63
(0.48 to 0.79)
2.9
Area
MT.AC 3 0.61
(-)
0.54
(-)
0.53
(0.41 to 0.65)
0.13
(-)
0.33
(-)
0.62
(0.45 to 0.78)
2.4
MF.AC 3 0.68
(-)
0.59
(-)
0.52
(0.39 to 0.67)
0.07
(-)
0.27
(-)
0.64
(0.49 to 0.81)
1.8
MTF.AC 2.6 0.66
(-)
0.61
(-)
0.51
(0.38 to 0.64)
0.09
(-)
0.29
(-)
0.64
(0.49 to 0.80)
1.8
Thickness
MT.ThCtAB 3.4 0.5
(-)
0.4
(-)
0.56
(0.43 to 0.67)
0.19
(-)
0.3
(-)
0.63
(0.45 to 0.80)
2.4
MT.ThCtQ 2.7 0.01
(53)
0.005
(50)
0.72
(0.61 to 0.83)
0.38
(-)
0.49
(-)
0.57
(0.40 to 0.76)
1.4
Congruity, MT.CongClAB 6.6 0.01
(52)
0.001
(37)
0.73
(0.62 to 0.84)
0.54
(-)
0.65
(-)
0.53
(0.38 to 0.69)
1.7
Roughness, MT.RouClAB 2 <0.001
(31)
<0.001
(20)
0.80
(0.69 to 0.91)
0.39
(-)
0.13
(-)
0.70
(0.54 to 0.84)
2.8
Homogeneity
MT.HomC 0.8 0.03
(75)
0.06
(-)
0.65
(0.54 to 0.76)
0.05
(43)
0.08
(-)
0.71
(0.56 to 0.81)
3.3
MF.HomC 0.9 0.1
(-)
0.05
(106)
0.64
(0.52 to 0.76)
0.64
(-)
0.65
(-)
0.51
(0.35 to 0.68)
1.3
MTF.HomC 0.8 0.08
(-)
0.04
(94)
0.65
(0.52 to 0.76)
0.57
(-)
0.63
(-)
0.53
(0.37 to 0.69)
1.3
Longevity (basic) 1.1/0.8 0.01
(53)
0.02
(76)
0.68
(0.55 to 0.80)
0.06
(-)
0.12
(-)
0.69
(0.51 to 0.86)
4.0
Longevity-Tib 1.7/0.8 <0.001
(18)
<0.001
(16)
0.84
(0.77 to 0.92)
0.02
(30)
0.02
(32)
0.77
(0.62 to 0.90)
5.8
MRI Tib 1.5/0.8 <0.001
(20)
<0.001
(18)
0.82
(0.72 to 0.91)
0.03
(36)
0.04
(40)
0.74
(0.59 to 0.88)
4.8
Results for the individual and aggregate biomarkers for use as diagnostic markers (Kellgren and Lawrence index 1 versus >1) and as prognostic
markers (early progressors versus non-progressors) evaluated in the 21-month longitudinal study with 159 subjects. Precision given as the
interscan coefficient of variation (CV) for magnetic resonance imaging (MRI) quantifications and as the interscan intra-observer CV for radiograph
measurements. Precision is not given for gender and body mass index since no repeated measurements were made. For the aggregate markers,
precision is given for both the diagnostic/prognostic variant. Significance was estimated using the generalized estimation equations (P
GEE
) and
multivariate analysis of variation (P
MAN
); the required sample size by generalized estimation equations (n
GEE
as number of subjects) and power
analysis (n
PA
). Sample size estimates are excluded for non-significant markers (P > 0.05). Area under the receiver-operator characteristics curve
(AUC) is given with 95% confidence interval. The high-risk threshold for the odds ratio (OR) was determined by cross-validation close to the
median. Diagnostic and prognostic scores are median results over 500 randomly generated, representative, disjoint training/evaluation subsets.
AC = cartilage area; CongClAB = cartilage congruity over the load-bearing area of bone; CTX-II = marker of collagen type II C-telopeptide
fragment; HomC = cartilage homogeneity; MF = medial femoral; MT = medial tibial; MTF = medial tibio-femoral; RouClAB = cartilage roughness
over the load-bearing area of bone; ThCtAB = cartilage thickness over the total area of bone; ThCQ = cartilage thickness 10% quantile; VC =
cartilage volume.
Available online />Page 7 of 11
(page number not for citation purposes)
between ORs were statistically significant. Analysis of pro-
gression at other KL levels was not performed due to the low
number of progressors.
The choices of the AUC and OR as evaluation parameters for
diagnostic and prognostic markers follows the BIPED classifi-
cation [8].
The potential confounding effects of gender, age, and body
mass index were investigated by application of linear correc-
tion to the key aggregate markers.
Results
The diagnostic and prognostic abilities of individual and aggre-
gate markers are presented in Table 2.
JSW performed well as a diagnostic marker (AUC = 0.73) –
as expected, since it is part of the KL score. The best individual
diagnostic marker was cartilage roughness (AUC = 0.80,
n
GEE
/n
PA
= 31/20). The cartilage longevity marker also demon-
strated good performance (AUC = 0.84, n
GEE
/n
PA
= 18/16).
The AUC for longevity-tib was statistically significantly higher
than for all individual markers (P < 0.05).
Several individual markers demonstrated prognostic ability,
among these CTX-II (AUC = 0.67, OR = 3.2), cartilage rough-
ness (AUC = 0.7, OR = 2.8), and cartilage homogeneity (AUC
= 0.71, OR = 3.3). The JSW seemed inappropriate as a prog-
nostic marker (P = 0.4). Cartilage longevity-tib also performed
well as a prognostic marker (AUC = 0.77, OR = 5.8, n
GEE
/n
PA
= 30/32). The OR for the longevity marker was significantly
higher than for all individual markers (P < 0.05) except for
roughness and homogeneity (P = 0.2 and P = 0.3). The AUC
was higher (P < 0.05) except for homogeneity (P = 0.12).
Cartilage longevity markers
When the individual markers are rescaled to have a standard
deviation of one (denoted by underlining), the aggregate
marker weights give an estimate of the marker importance. As
examples, the diagnostic and prognostic cartilage longevity-tib
markers (Vol: MT.VC, Area: MT.AC, Thick: MT.ThCtAB, Cong:
MT.CongClAB, Rough: MT.RoughClAB, Hom: MT.HomC)
were:
Below we present further results for these aggregate cartilage
longevity-tib markers.
These aggregate markers are compared with the key individual
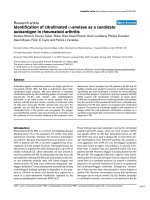
markers in Figures 3 and 4. The receiver-operator characteris-
tics curves in Figure 3 show that both the JSW and longevity
were able to diagnose 57% true positives with 3.8% false pos-
itives. From there, the longevity marker proved better at diag-
nosing the borderline cases. The AUC for longevity was 0.87,
which was superior to the AUC for a JSW of 0.73 (P = 0.02)
and the AUC of 0.81 for the best individual marker roughness
(P = 0.02).
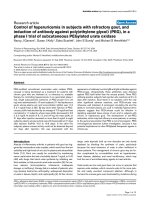
Figure 4 elaborates on the prognostic performance. For each
marker the scores were split into quartiles and the predictive
power of elevated scores were computed by comparison with
the lowest quartile. The highest quartile of the cartilage longev-
ity marker provided an OR of 20.0 (95% confidence interval =
6.4 to 62.1).
Gender, age, and body mass index adjustment
When adjusting the longevity markers for gender, age, and
body mass index, the diagnostic marker retained performance
very similar to the unadjusted (AUC = 0.83, n
PA
= 17). The
prognostic longevity marker also retained equivalent perform-
ance (AUC = 0.77, OR = 5.8, n
PA
= 28).
Markers normalized to knee size
In previous work, we used MRI cartilage markers normalized
by the width of the tibial plateau to adjust for joint size. This
improved diagnostic performance for the markers [22] and
can also be used in the aggregate markers [41]. Using normal-
ized MRI markers [22], both the diagnostic longevity marker
Longevity CTX-II Vol Area
Thick
diag
=− ⋅ − ⋅ + ⋅ +
⋅+
025 047 012
024 0
.
. .35 0 70 0 20⋅−⋅ −⋅Cong Rough Hom
Longevity CTX-II Vol Area
Thick
prog
=− ⋅ + ⋅ − ⋅ −
⋅+
017 067 055
034 0
.
. .06 0 27 0 20⋅−⋅ −⋅Cong Rough Hom
Figure 3
Diagnostic ability for separating healthy individuals from osteoarthritis subjectsDiagnostic ability for separating healthy individuals from osteoarthritis
subjects. The diagnostic ability for separating healthy individuals from
osteoarthritis (OA) subjects (defined by Kellgren and Lawrence index
>1) of key markers, illustrated by a receiver-operator characteristics
diagram. The areas under the curves are: joint space width (JSW),
0.73; urinary marker of collagen type II C-telopeptide fragment (uCTX-
II), 0.70; volume, 0.52; roughness, 0.81; homogeneity, 0.65; and lon-
gevity-tib, 0.87. The aggregate longevity-tib marker provided superior
ability to all the individual markers (P < 0.05).
Arthritis Research & Therapy Vol 11 No 4 Dam et al.
Page 8 of 11
(page number not for citation purposes)
(AUC = 0.84, n
GEE
/n
PA
= 21/16) and the prognostic longevity
marker (AUC = 0.75, OR = 4.8, n
GEE
/n
PA
= 28/39) retained
very similar performance as the non-normalized markers.
Diagnosis at Kellgren and Lawrence index above zero
Above, the diagnostic markers are evaluated for the ability to
separate KL 1 from KL >1. In order to target diagnosis of
very early OA, the separation could be KL = 0 from KL > 0. On
comparing with the markers in Table 2, the best individual
diagnostic markers are then the JSW (AUC = 0.70), congruity
(AUC = 0.71), and homogeneity (MT.HomC, AUC = 0.70).
The cartilage longevity marker allowed improved performance
(AUC = 0.82, n
GEE
/n
PA
= 21/21).
Prediction of joint space narrowing and cartilage loss
The aggregate prognostic markers were optimized to predict
progression in the KL score. The same prognostic longevity
marker, however, also predicts increased longitudinal JSN and
cartilage loss. Specifically, when dividing the knees into those
above/below the mean longevity score, the mean JSN is 4.9
percentage points higher (P = 0.11), the mean tibial + femoral
cartilage loss is 2.5 percentage points higher (P = 0.10), and
the mean femoral cartilage loss is 2.6 percentage points
higher (P = 0.05) for the high-risk group.
Discussion
The complexity of OA makes biomarker development challeng-
ing. There are many onset factors including genetics, trauma,
biomechanics, weight, and exercise; and different phases of
OA may entail different pathological mechanisms. Biomarkers
therefore can target numerous effects, including increased
turnover in cartilage and bone, fibrillation, subchondral bone
thickening, bone edema, osteophytes, focal cartilage lesions,
and eventually cartilage denudation (see models of OA stages
[42,43]). Owing to the heterogeneity of the disease, numerous
effects will be observable concurrently in a population, and
therefore aggregate markers may allow more comprehensive
quantification in clinical studies.
We evaluated diagnostic and prognostics markers combining
a urine-based biochemical marker for cartilage breakdown
with MRI-based markers of cartilage quantity and structure.
Markers combining the quantity, quality, and current break-
down could conceivably be comprehensive markers for carti-
lage longevity.
The major findings were twofold. The best individual diagnos-
tic marker was cartilage roughness (AUC = 0.80, n
GEE
= 31)
and the best individual prognostic marker was homogeneity
(AUC = 0.71, n
GEE
= 43). Secondly, the aggregate cartilage
longevity-tib marker (combining CTX-II, volume, area, thick-
ness, congruity, roughness, and homogeneity) performed well
diagnostically (AUC = 0.84, n
GEE
= 18) and prognostically
(AUC = 0.77, OR = 5.8, n
GEE
= 30). The performance per-
sisted after adjustment for gender, age, body mass index, and
knee size.
Presently accepted marker
The results demonstrated that use of the JSW for population
selection in clinical studies may not be optimal. The JSW was
unsuitable as a prognostic marker and the diagnostic perform-
ance (AUC = 0.73) is expected since the JSW is integrated in
the definition of OA (KL). Even so, roughness has a higher
AUC (0.80, P < 0.05). When inspecting Figure 3, it is appar-
ent that the JSW is effective in diagnosing the severe cases
(left end of curves) corresponding to low JSW. For the earlier
stages of OA, however, homogeneity and in particular carti-
lage longevity-tib outperforms the JSW.
Scalability for large, multicenter studies
Aggregate markers combining several individual markers intro-
duce a potential measurement bottle-neck. Even for volumetric
MRI markers, manual/semi-automatic annotation is time con-
suming. For advanced three-dimensional markers (such as
curvature or roughness), manual annotation is not feasible.
The present study relied on fully automated computer-based
MRI methods for cartilage status assessment and a standard-
ized biochemical marker measured through standard ELISA
techniques. The presented aggregate markers can thereby be
Figure 4
Prognostic ability of key markers for separating healthy non-progres-sors from early progressorsPrognostic ability of key markers for separating healthy non-progres-
sors from early progressors. Early progressors were defined by whether
the KL score increased from a baseline score of 0. For each marker, the
population was divided into quartiles and each quartile was compared
with the lowest quartile in terms of the odds ratio (OR) for predicting
the progressors. Each OR is given with the 95% confidence interval
and with the significance level: *P < 0.05, **P < 0.01, ***P < 0.001,
and ****P < 0.0001. Cartilage longevity-tib proved superior to the indi-
vidual markers (P < 0.05) except for roughness/homogeneity (P = 0.2/
0.3) with OR of 20.0 for the highest quartile. JSW = joint space width;
uCTX-II, urinary marker of collagen type II C-telopeptide fragment.
Available online />Page 9 of 11
(page number not for citation purposes)
applied in large, multicenter studies without introducing a
reader bottle-neck.
Aggregate markers
The cartilage longevity markers support the hypothesis that
markers from different modalities can be complementary. Even
with similar markers, superior combined performance could be
achieved by improved precision through repeated similar
quantifications. The cartilage longevity-tib marker has preci-
sion 1.7/0.8%. For comparison, cartilage homogeneity has
precision 0.8%. The improved performance is therefore prob-
ably due to the combination of the complementary aspects of
cartilage quantity, quality, and breakdown measured from dif-
ferent modalities.
A potential extension of the presented methodology is to
include additional complementary MRI markers targeting
bone, meniscus, and other joint structures; and to include
additional biochemical markers reflecting bone turnover, syno-
vitis, cartilage formation, cartilage degradation mediated by
biological processes of type II destruction different from CTX-
II [44], or destruction of other matrix proteins, such as aggre-
can. The aggregate markers could thereby become more sim-
ilar to composite markers such as the Whole-Organ Magnetic
Resonance Imaging Score [20] and the Knee Osteoarthritis
Scoring System [45] MRI scoring methods. These scoring
systems provide semiquantitative scores by inspection of MRI
for presence/severity of disease-related parameters (for exam-
ple, cartilage lesions, bone marrow abnormalities, and menis-
cal abnormalities). For such comprehensive aggregate
markers, automatic MRI analysis will be even more important
to minimize the expert reader burden.
Limitations of the study
We focused the investigation of progression of OA to the early
stages. Specifically, we focused on the subpopulation with
early radiographic signs of OA at baseline (KL <2). The con-
clusions are therefore only valid for progression during the
early stages of OA. A study population with more progressed
OA would be needed to validate the findings at later stages of
OA. Furthermore, the relatively small number of subjects in the
present study implies that the findings need to be validated on
larger populations.
Furthermore, validation on larger populations is also needed to
determine specific threshold values for the different markers –
for example, for determining the high-risk population. In addi-
tion, the somewhat complicated nature of aggregate markers
implies that validation on several populations is needed to
facilitate the clinical interpretation and confidence in the mark-
ers.
The cartilage measurements were based on an MRI scanner
with a 0.18 T magnet. The use of low-field MRI is sparsely val-
idated compared with high-field MRI [46]. In particular, high-
field MRI may allow cartilage volume measurements with
higher accuracy and precision (implying that studies may be
conducted with smaller populations). Low-field MRI, however,
is much cheaper and easier to install and maintain. Future
studies are needed to evaluate whether low-field MRI can be
a cost-effective alternative to high-field MRI for clinical studies.
The study used the common KL score as the definition of OA.
This score is not compartment specific or feature specific,
whereas the markers were both compartment specific (MRI),
joint specific (JSW), and not joint specific (CTX-II). Future
studies are needed to elucidate the relationships between
specific features and specific compartments – for example,
studies similar to that of Blumenkrantz and colleagues [47].
Conclusions
Owing to the complexity of OA, it is unlikely that any single
marker will be suitable for all stages of the disease. The differ-
ent biomarker modalities, however, may offer complementary
information, which suggests that aggregate markers may pro-
vide superior biomarker performance.
In the present study we evaluated markers from urine samples,
radiographs, and MRI scans. The results demonstrated that
aggregate markers may indeed provide superior diagnostic
and prognostic markers; the proposed cartilage longevity
marker combining aspects of cartilage quantity, quality, and
breakdown performed well both as a diagnostic and a prog-
nostic marker.
The proposed aggregate marker methodology may therefore
have a direct impact on clinical study design. By allowing
selection of a high-risk population, the study sample size can
be lowered while still improving the chance of a positive study
outcome. This should facilitate the development of effective
DMOADs.
Competing interests
EBD and IB are employees of Nordic Bioscience. MN is partly
funded by Nordic Bioscience. CC and MAK are employees
and shareholders of Nordic Bioscience. PCP is employed by
the Center for Clinical and Basic Research (CCBR). JF and
AAQ have both received scholarships partly funded by Nordic
Bioscience. ML was previously partly funded by Nordic Bio-
science. PG is employed by CCBR-Synarc. The study was
sponsored by CCBR and Nordic Bioscience. The commercial
rights to the software used for automatic cartilage quantifica-
tion from MRI are held by Nordic Bioscience. A patent for the
proposed Longevity markers is pending.
Authors' contributions
All authors contributed to the discussion leading to the study
and the writing of the manuscript. In particular, the marker
combination methodology was developed by EBD and ML.
The statistical analysis was designed and carried out by EBD
Arthritis Research & Therapy Vol 11 No 4 Dam et al.
Page 10 of 11
(page number not for citation purposes)
and IB. The MRI analysis methods were developed by JF,
AAQ, MN, and EBD. The radiological reading was performed
by PCP. The biochemical marker expertise and measurements
were provided by IB, CC, MAK, and PG. All authors read and
approved the final manuscript.
Acknowledgements
The authors gratefully acknowledge the funding from the Danish
Research Foundation (Den Danske Forskningsfond) supporting this
work.
References
1. Abramson SB, Attur M, Yazici Y: Prospects for disease modifi-
cation in osteoarthritis. Nat Clin Pract Rheumatol 2006,
2:304-312.
2. Bingham CO III, Buckland-Wright JC, Garnero P, Cohen SB, Dou-
gados M, Adami S, Clauw DJ, Spector TD, Pelletier JP, Raynauld
JP, Strand V, Simon LS, Meyer JM, Cline GA, Beary JF: Risedro-
nate decreases biochemical markers of cartilage degradation
but does not decrease symptoms or slow radiographic pro-
gression in patients with medial compartment osteoarthritis of
the knee: results of the two-year multinational knee osteoar-
thritis structural arthritis study. Arthritis Rheum 2006,
54:3494-3507.
3. Spector TD, Conaghan PG, Buckland-Wright JC, Garnero P, Cline
GA, Beary JF, Valent DJ, Meyer JM: Effect of risedronate on joint
structure and symptoms of knee osteoarthritis: results of the
BRISK randomized, controlled trial [ISRCTN01928173]. Arthri-
tis Res Ther 2005, 7:R625-R633.
4. Krzeski P, Buckland-Wright C, Bálint G, Cline GA, Stoner K, Lyon
R, Beary J, Aronstein WS, Spector TD: Development of muscu-
loskeletal toxicity without clear benefit after administration of
PG-116800, a matrix metalloproteinase inhibitor, to patients
with knee osteoarthritis: a randomized, 12-month, double-
blind, placebo-controlled study. Arthritis Res Ther 2007,
9:R109.
5. Brandt KD, Mazzuca SA, Katz BP, Lane KA, Buckwalter KA,
Yocum DE, Wolfe F, Schnitzer TJ, Moreland LW, Manzi S: Effects
of doxycycline on progression of osteoarthritis. Arthritis
Rheum 2005, 52:2015-2025.
6. Altman RD, Abadie E, Avouac B, Bouvenot G, Branco J, Bruyere
O, Calvo G, Devogelaer JP, Dreiser RL, Herrero-Beaumont G,
Kahan A, Kreutz G, Laslop A, Lemmel EM, Menkes CJ, Pavelka K,
van de PL, Vanhaelst L, Reginster JY: Total joint replacement of
hip or knee as an outcome measure for structure modifying
trials in osteoarthritis. Osteoarthritis Cartilage 2005, 13:13-19.
7. Hunter DJ, Zhang YQ, Tu X, LaValley M, Niu JB, Amin S, Guermazi
A, Genant H, Gale D, Felson DT: Change in joint space width.
Arthritis Rheum 2006, 54:2488-2495.
8. Bauer DC, Hunter DJ, Abramson SB, Attur M, Corr M, Felson D,
Heinegard D, Jordan JM, Kepler TB, Lane NE, Saxne T, Tyree B,
Kraus VB: Classification of osteoarthritis biomarkers: a pro-
posed approach. Osteoarthritis Cartilage 2006, 14:723-727.
9. Schaller S, Henriksen K, Hoegh-Andersen P, Sondergaard BC,
Sumer EU, Tanko LB, Qvist P, Karsdal MA: In vitro, ex vivo, and
in vivo methodological approaches for studying therapeutic
targets of osteoporosis and degenerative joint diseases: how
biomarkers can assist? Assay Drug Dev Technol 2005,
3:553-580.
10. Abadie E, Ethgen D, Avouac B, Bouvenot G, Branco J, Bruyere O,
Calvo G, Devogelaer JP, Dreiser RL, Herrero-Beaumont G, Kahan
A, Kreutz G, Laslop A, Lemmel EM, Nuki G, Putte LVD, Vanhaels
L, Reginster JY: Recommendations for the use of new methods
to assess the efficacy of disease-modifying drugs in the treat-
ment of osteoarthritis. Osteoarthritis Cartilage 2004,
12:263-268.
11. Karsdal MA, Sumer EU, Wulf H, Madsen SH, Christiansen C,
Fosang AJ, Sondergaard BC: Induction of increased cAMP lev-
els in articular chondrocytes blocks matrix metalloproteinase-
mediated cartilage degradation, but not aggrecanase-medi-
ated cartilage degradation. Arthritis Rheum 2007,
56:1549-1558.
12. Sondergaard BC, Henriksen K, Wulf H, Oestergaard S, Schurigt
U, Brauer R, Danielsen I, Christiansen C, Qvist P, Karsdal MA: Rel-
ative contribution of matrix metalloprotease and cysteine pro-
tease activities to cytokine-stimulated articular cartilage
degradation. Osteoarthritis Cartilage 2006, 14:738-748.
13. Reijman M, Hazes JMW, Bierma-Zeinstra SMA, Koes BW, Christ-
gau S, Christiansen C, Uitterlinden AG, Pols HAP: A new marker
for osteoarthritis: cross-sectional and longitudinal approach.
Arthritis Rheum 2004, 50:2471-2478.
14. Meulenbelt I, Kloppenburg M, Kroon HM, Houwing-Duistermaat JJ,
Garnero P, Hellio-Le Graverand MP, DeGroot J, Slagboom PE:
Clusters of biochemical markers are associated with radio-
graphic subtypes of osteoarthritis (OA) in subject with familial
OA at multiple sites. The GARP study. Osteoarthritis Cartilage
2007, 15:379-385.
15. Drape JL, Pessis E, Auleley GR, Chevrot A, Ayral MDX: Quantita-
tive MR imaging evaluation of chondropathy in osteoarthritic
knees. Radiology 1998, 208:49-55.
16. Pessis E, Drape JL, Ravaud P, Chevrot A, Ayral MDX: Assessment
of progression in knee osteoarthritis: results of a 1 year study
comparing arthroscopy and MRI. Osteoarthritis Cartilage 2003,
11:361-369.
17. Stammberger T, Eckstein F, Englmeier KH, Reiser M: Determina-
tion of 3D cartilage thickness data from MR imaging: compu-
tational method and reproducibility in the living. Magn Reson
Med 1999, 41:529-536.
18. Grau V, Mewes AUJ, Alcaniz M, Kikinis R, Warfield SK: Improved
watershed transform for medical image segmentation using
prior information. IEEE Trans Med Imaging 2004, 23:447-458.
19. Pakin SK, Tamez-Pena JG, Totterman S, Parker KJ: Segmenta-
tion, surface extraction and thickness computation of articular
cartilage. SPIE Medical Imaging 2002, 4684:155-166.
20. Peterfy CG, Guermazi A, Zaim S, Tirman PFJ, Miaux Y, White D,
Kothari M, Lu Y, Fye K, Zhao S, Genant HK:
Whole-Organ Mag-
netic Resonance Imaging Score (WORMS) of the knee in oste-
oarthritis. Osteoarthritis Cartilage 2004, 12:177-190.
21. Folkesson J, Dam EB, Olsen OF, Karsdal MA, Pettersen PC, Chris-
tiansen C: Automatic quantification of local and global articular
cartilage surface curvature: biomarkers for osteoarthritis?
Magn Reson Med 2008, 59:1340-1346.
22. Dam EB, Folkesson J, Pettersen PC, Christiansen C: Automatic
morphometric cartilage quantification in the medial tibial pla-
teau from MRI for osteoarthritis grading. Osteoarthritis Carti-
lage 2007, 15:808-818.
23. Qazi AA, Folkesson J, Pettersen PC, Karsdal MA, Christiansen C,
Dam EB: Separation of healthy and early osteoarthritis by
automatic quantification of cartilage homogeneity. Osteoar-
thritis Cartilage 2007, 15:1199-1206.
24. Folkesson J, Dam EB, Olsen OF, Christiansen C: Accuracy eval-
uation of automatic quantification of the articular cartilage sur-
face curvature from MRI. Acad Radiol 2007, 14:1221-1228.
25. Kellgren JH, Lawrence JS: Radiological assessment of osteo-
arthrosis. Ann Rheum Dis 1957, 16:494-501.
26. Verheugen G: Commission directive 2005/28/ec laying down
principles and guidelines for good clinical practice as regards
investigational medicinal products for human use, as well as
the requirements for authorization of the manufacturing or
importation of such products. Official Journal of the European
Union 2005, Legislation 091:13-19.
27. Peterfy C, Li J, Zaim S, Duryea J, Lynch JA, Miaux Y, yu W, Genant
HK: Comparison of fixed-flexion positioning with fluoroscopic
semi-flexed positioning for quantifying radiographic joint-
space width in the knee: test – retest reproducibility. Skeletal
Radiol 2003, 32:128-132.
28. Duddy J, Kirwan JR, Szebenyi B, Clarke S, Granell R, Volkov S: A
comparison of the semiflexed (MTP) view with the standing
extended view (SEV) in the radiographic assessment of knee
osteoarthritis in a busy routine X-ray department. Rheumath-
ology (Oxford) 2005, 44:349-351.
29. Christgau S, Garnero P, Fledelius C, Moniz C, Ensig M, Gineyts E,
Rosenquist C, Qvist P: Collagen type II C-telopeptide frag-
ments as an index of cartilage degradation. Bone
2001,
29:209-215.
30. Xia Y: The total volume and the complete thickness of articular
cartilage determined by MRI. Osteoarthritis Cartilage 2003,
11:473-474.
Available online />Page 11 of 11
(page number not for citation purposes)
31. Folkesson J, Dam EB, Olsen OF, Pettersen PC, Christiansen C:
Segmenting articular cartilage automatically using a voxel
classification approach. IEEE Trans Med Imaging 2007,
26:106-115.
32. Eckstein F, Ateshian G, Burgkart R, Burstein D, Cicuttini F,
Dardzinski B, Gray M, Link TM, Majumdar S, Mosher T, Peterfy C,
Totterman S, Waterton J, Winalski CS, Felson D: Proposal for a
nomenclature for MRI based measures of articular cartilage in
OA. Osteoarthritis Cartilage 2006, 14:974-983.
33. Folkesson J, Dam EB, Olsen OF, Pettersen PC, Christiansen C:
Automatic curvature analysis of the articular cartilage surface.
Proceedings of MICCAI Joint Disease: 2006; Copenhagen
2006:17-24.
34. Dam EB, Folkesson J, Pettersen PC, Christiansen C: Automatic
cartilage thickness quantification using a statistical shape
model. Proceedings of MICCAI Joint Disease: 2006; Copenha-
gen 2006:42-49.
35. Duda RO, Hart PE, Stork DG: Pattern Classification Wiley, New
York; 2001.
36. Hotelling H: A Generalized T test and measures of multivariate
dispersion. Proceedings of the Second Berkeley Symposium:
1951; Berkeley, CA 1951:23-42.
37. DeLong ER, DeLong DM, Clarke-Pearson DL: Comparing the
areas under two or more correlated receiver operating charac-
teristic curves: a nonparametric approach. Biometrics 1988,
44:837-845.
38. Ratcliffe SJ, Shults J: GEEQBOX: a MATLAB toolbox for gener-
alized estimating equations and quasi-least squares. J Stat
Software 2008, 25:1-14.
39. Rochon J: Application of GEE procedures for sample size cal-
culations in repeated measures experiments. Stat Med 1998,
17:1643-1658.
40. Tarone RE: On heterogeneity tests based on efficient scores.
Biometrika 1985, 72:91-95.
41. Dam EB, Loog M, Christiansen C, Karsdal MA: Cartilage longev-
ity: a prognostic OA biomarker combining biochemical and
MRI-based cartilage markers [abstract]. Osteoarthritis Carti-
lage 2007, 15:C48.
42. Altman RD, Gold GE: Atlas of individual radiographic features
in osteoarthritis, revised.
Osteoarthritis Cartilage 2007,
15(Suppl A):A1-A56.
43. Qvist P, Bay-Jensen AC, Christiansen C, Dam EB, Pastoureau P,
Karsdal MA: The disease modifying osteoarthritis drug
(DMOAD): is it in the horizon? Pharmacol Res 2008, 58:1-7.
44. Garnero P, Charni N, Juillet F, Conrozier T, Vignon E: Increased
urinary type II collagen helical and C telopeptide levels are
independently associated with a rapidly destructive hip oste-
oarthritis. Ann Rheum Dis 2006, 65:1639-1644.
45. Kornaat PR, Ceulemans RY, Kroon HM, Riyazi N, Kloppenburg M,
Carter WO, Woodworth TG, Bloem JL: MRI assessment of knee
osteoarthritis: Knee Osteoarthritis Scoring System (KOSS) –
inter-observer and intra-observer reproducibility of a compart-
ment-based scoring system. Skeletal Radiol 2005, 34:95-102.
46. Eckstein F, Cicuttini F, Raynauld JP, Waterton JC, Peterfy C: Mag-
netic resonance imaging (MRI) of articular cartilage in knee
osteoarthritis (OA): morphological assessment. Osteoarthritis
Cartilage 2006, 14 Suppl A:A46-A75.
47. Blumenkrantz G, Lindsey CT, Dunn TC, Jin H, Ries MD, Link TM,
Steinbach LS, Majumdar S: A pilot, two-year longitudinal study
of the interrelationship between trabecular bone and articular
cartilage in the osteoarthritic knee. Osteoarthritis Cartilage
2004, 12:997-1005.