Báo cáo y học: "The role of patient expectations in predicting outcome after total knee arthroplasty" ppsx
Bạn đang xem bản rút gọn của tài liệu. Xem và tải ngay bản đầy đủ của tài liệu tại đây (239.13 KB, 13 trang )
Available online />
Research article
Vol 11 No 5
Open Access
The role of patient expectations in predicting outcome after total
knee arthroplasty
Anne F Mannion1,2, Stephane Kämpfen3, Urs Munzinger3 and Ines Kramers-de Quervain4
1Department
of Research and Development, Schulthess Klinik, Lengghalde 2, 8008 Zürich, Switzerland
of Rheumatology and Institute of Physical Medicine, University Hospital Zürich, Gloriastrasse 25, 8091 Zürich, Switzerland
3Department of Lower Extremity Orthopaedic Surgery, Schulthess Klinik, Lengghalde 2, 8008 Zürich, Switzerland
4Department of Rheumatology, Schulthess Klinik, Lengghalde 2, 8008 Zürich, Switzerland
2Department
Corresponding author: Anne F Mannion,
Received: 10 May 2009 Revisions requested: 2 Jul 2009 Revisions received: 26 Aug 2009 Accepted: 21 Sep 2009 Published: 21 Sep 2009
Arthritis Research & Therapy 2009, 11:R139 (doi:10.1186/ar2811)
This article is online at: />© 2009 Mannion et al.; licensee BioMed Central Ltd.
This is an open access article distributed under the terms of the Creative Commons Attribution License ( />which permits unrestricted use, distribution, and reproduction in any medium, provided the original work is properly cited.
Abstract
Introduction Patient's expectations are variably reported to
influence self-rated outcome and satisfaction after medical
treatment; this prospective study examined which of the
following was the most important unique determinant of global
outcome/satisfaction after total knee arthroplasty (TKA):
baseline expectations; fulfilment of expectations; or current
symptoms and function.
Methods One hundred and twelve patients with osteoarthritis of
the knee (age, 67 ± 9 years) completed a questionnaire about
their expectations regarding months until full recovery, pain, and
limitations in everyday activities after TKA surgery. Two years
postoperatively, they were asked what the reality was for each of
these domains, and rated the global outcome and satisfaction
with surgery. Multivariable regression analyses using forward
conditional selection of variables (and controlling for age,
gender, other joint problems) identified the most significant
determinants of outcome.
Results Patients significantly underestimated the time for full
recovery (expected 4.7 ± 2.8 months, recalled actual time, 6.1
Introduction
It is now generally accepted that the outcome of total joint
replacement should be assessed not only on the basis of
imaging, technical results, and objective functional/physiological findings, but also in relation to the patient's perception of
the benefit gained, as regards domains of importance to them
in their everyday life [1,2]. Patients' expectations of treatment
are a potentially important determinant of their subsequent ratings of outcome, yet one that remains relatively unexplored in
the fields of rheumatology and orthopaedic surgery [3]. Vari-
± 3.7 months; P = 0.005). They were also overly optimistic
about the likelihood of being pain-free (85% expected it, 43%
were; P < 0.05) and of not being limited in usual activities (52%
expected it, 20% were; P < 0.05). Global outcomes were
46.2% excellent, 41.3% good, 10.6% fair and 1.9% poor. In
multivariable regression, expectations did not make a significant
unique contribution to explaining the variance in outcome/
satisfaction; together with other joint problems, knee pain and
function at 2 years postoperation predicted global outcome, and
knee pain at 2 years predicted satisfaction.
Conclusions In this group, preoperative expectations of TKA
surgery were overly optimistic. The routine analysis of patientorientated outcomes in practice should assist the surgeon to
convey more realistic expectations to the patient during the
preoperative consultation. In multivariable regression,
expectations did not predict global outcome/satisfaction; the
most important determinants were other joint problems and the
patient's pain and functional status 2 years postoperatively.
ous theoretical models exist describing the relationship
between expectations and satisfaction in the setting of medical care. The most dominant model posits that expectations
being met - that is, minimising the mismatch between prior
expectations and the actual result - is the most important
determinant [4,5]. Other models, however, maintain that
higher expectations per se are associated with better outcomes [6,7], perhaps reflecting the influence of dispositional
optimism [8] or a sort of placebo effect. Further models suggest that the actual post-treatment status with regards to
TKA: total knee arthroplasty.
Page 1 of 13
(page number not for citation purposes)
Arthritis Research & Therapy
Vol 11 No 5
Mannion et al.
symptoms or function more strongly governs whether the
patient is satisfied with the results, regardless of their prior
expectations [9,10].
Only few studies have examined the relationship between
expectations and outcome/satisfaction in relation to total joint
replacement surgery, and even fewer specifically in relation to
the knee joint. Engel and colleagues examined the influence of
baseline expectations regarding improvement in the condition
and regarding change in quality of life on outcome [11], as
measured with both disease-specific and generic instruments,
6 months after total knee arthroplasty (TKA). They revealed
that these expectations accounted for between 9% and 13%
of the variance in outcome, depending on the instrument used.
They did not, however, investigate how well the expectations
met the reality of the situation at follow-up, or whether this had
any independent influence on outcome ratings or satisfaction.
Mahomed and colleagues examined the importance of expectations (dichotomised as high or low, with respect to expected
changes in pain, functional limitations, overall success, and the
likelihood of complications) in predicting outcomes after total
joint arthroplasty [12]. In multivariable analyses, expectations
about pain (but not any other domains) had significant predictive value with respect to the outcomes of Western Ontario
and McMaster Universities Osteoarthritis Index pain, of Western Ontario and McMaster Universities Osteoarthritis Index
function, and of Short Form-36 function, although the unique
variance accounted for in each case was relatively low. These
authors, too, did not examine how well the reality of the outcome had met the prior expectations of the patients, or
whether this influenced their satisfaction with treatment.
Burton and colleagues did examine the notion of expectations
being met in relation to the outcome of total joint replacement
(hip) [13], and noted that expectations were fulfilled in just
over one-half (55%) of the patients interviewed. A high proportion of patients (86%) nonetheless claimed that the operation
had been successful - although the unfulfilled patients
reported a significantly lower quality of life than those whose
expectations were met [13]. Unfortunately, the investigation
was retrospective, with patients being required to recall their
preoperative expectations of an average 3.5 years ago; it is
well known that the data collected using such study designs
are subject to strong recall bias and potential confounding by
the actual outcome of the surgery. The study by Mancuso and
colleagues of total hip replacement patients was beset with
the same limitations of the retrospective study design; these
authors also reported a high proportion of satisfied patients
overall (89%), but satisfaction rates were lower in those
expecting improvement in nonessential activities (perhaps
suggesting overly ambitious or unrealistic expectations) and
those with a poor postoperative condition [14].
Page 2 of 13
(page number not for citation purposes)
Moran and colleagues [15] quantified the preoperative expectations of hip and knee total joint replacement patients, by asking them to rate their current status on the Oxford hip or
Oxford knee questionnaires and to predict the level of symptoms expected 6 months after surgery. The operating surgeons also completed the latter task. It was shown that the
surgeons expected significantly better results than the patient.
The researchers, however, did not go on to examine these
expectations in relation to the actual changes achieved or the
patients' satisfaction with their postoperative status.
In summary, previous investigations in the field of joint replacement have delivered inconclusive findings, in part due to the
retrospective nature of the investigations or failure to use multivariable models to identify the relative importance of putative
predictors.
The present study seeks to expand our knowledge of the relationship between expectations and outcome, measured as
satisfaction with surgery and the global outcome of surgery, in
patients undergoing joint replacement for osteoarthritis of the
knee. Specifically, in multiple regression analysis we tested,
when controlling for potential confounding variables, which (if
any) of the following variables made a unique significant contribution to explaining the variance in satisfaction and in global
outcome 2 years after TKA: baseline expectations, the actual
knee status (pain and function) at 2-year follow-up, and expectations being fulfilled (preoperative declared expectations
minus 2 year postoperative actual status).
Materials and methods
Overview of the study
The patients described in the present investigation were participating in a large-scale prospective study examining subjective and objective aspects of locomotor function before and
after TKA (results on objective changes in function to be
reported elsewhere). The participants completed questionnaires before total joint replacement surgery and again 2 years
later. The study group comprised those with questionnaire
data from both baseline and follow-up assessments (n = 112/
146 (77%); for details on drop-outs, see later).
The patients received an oral and written explanation of what
would be required of them, and signed an informed consent
form confirming their agreement to participate. The study was
approved by the local University Ethics Committee.
Study admission criteria
All patients who were scheduled for a primary knee arthroplasty (TKA) at the authors' hospital in the year of study were
invited to participate; approximately 55% volunteered. The
only inclusion criteria were a willingness to comply with the
test battery and complete the follow-up assessments, and a
good understanding of written German. No patients were
excluded on the basis of their age or activity level.
Available online />
Questionnaires
Pre surgery
Approximately 2 weeks before the operation, during a visit to
the hospital for the accompanying functional tests (reported
elsewhere), the patients completed the Total Arthroplasty Outcome Evaluation Questionnaire Baseline and History Forms of
Katz and colleagues [16] (modified for the knee; the actual
questionnaire can be found in the Appendix of Katz and colleagues [16]). The Baseline form enquired, amongst other
things, about the patient's main reasons for choosing knee
replacement surgery (10 options - multiple answers allowed,
with the most important reason also to be indicated); the
importance of decreasing pain and increasing function; and
expectations of surgery in relation to expected time until full
recovery (open answer, in months), expected pain after recovery from surgery (not at all painful through to very painful), and
expected limitations in everyday activities after recovery from
surgery (not limited at all through to greatly limited).
The History Form enquired (amongst other things) about various sociodemographic characteristics, pain in the left and
right knees (recoded to obtain the answer for the index knee four categories: no pain, slight pain, moderate pain, severe
pain), and extent of limitation in usual activities (five categories:
not limited at all, slightly limited, moderately limited, greatly limited, totally limited).
The form also enquired about the involvement of other joints by
asking 'Other than your knee, what areas are very painful?'
(none, back and/or buttocks, left hip, right hip, other - give
details). The answer was then dichotomised as yes if any of the
joints given in the option list (or feet as other) were indicated,
and as no if the answer was none or any other areas of the
body, with the rationale that these other joints might affect
overall mobility/locomotor function.
The American Society of Anesthesiologists Physical Status
Classification System was used to assess the patient's overall
physical health (1 = normal healthy, 2 = mild/moderate systemic disease, 3 = severe systemic disease, 4 = life-threatening systemic disease), since it was considered that this may
have influenced the patient's function or postoperative outcome.
Two years post surgery
Two years after surgery, when the patients attended for their
follow-up assessment, they completed the same items from
the History Form to assess current status in relation to the
domains that had been enquired about in the preoperative
expectations questionnaire (months required until recovered,
pain, limitations in everyday activities). They also completed
the Post-operative Form, which asked them to rate the global
outcome/result of surgery (1 = excellent, 2 = good, 3 = fair, 4
= poor) and their satisfaction with surgery (1 = very satisfied,
2 = somewhat satisfied, 3 = somewhat dissatisfied, 4 = very
dissatisfied) - these two measures were to serve as the
dependent variables in the multiple regression analyses - and
to state whether they would choose to undergo the procedure
again if they found themselves in the same situation, knowing
what they now know about the outcome (yes, definitely; yes,
probably; no, probably not; no, definitely not).
In summary, expectations were measured at baseline, and current pain and function were measured prospectively (each
preoperatively and at 2 years), also yielding a measure of the
change in pain and function. In each expectations domain
(time to recovery, pain, and function), the difference between
the preoperative expected score and the follow-up actual
score yielded a measure of the extent to which expectations
had been fulfilled.
Statistical analysis
Descriptive data are presented as the mean and standard
deviations unless otherwise stated. Contingency analyses
were used to examine associations between categorical variables. Bivariate analyses (Spearman rank or Pearson correlations, as appropriate) were used to examine the zero-order
correlations between global outcome (or satisfaction) and the
potential predictors.
Multiple linear regression analyses were carried out to identify
the variables that made a significant unique contribution to
explaining the variance in outcome, using firstly global treatment outcome and then satisfaction with treatment as the
dependent variable to be predicted. Age, gender, and presence of other joint problems were entered into the model as a
first step, to control for these potential confounding variables.
After this, the following variables were entered using a forward
conditional selection criterion (with a probability-of-F-to-enter
≤ 0.05): the two expectations items (that is, regarding
expected pain and function); pain and function at 2 years; the
change in pain and the change in function (in each case, the
value measured prospectively from pre surgery to 2-year follow-up); and the fulfilment of expectations (expectations minus
actuality) scores for each of the three domains.
Collinearity was assessed by examining the tolerance values
and variance inflation values for the independent variables in
the final regression models; values < 0.1 and > 5, respectively,
were considered to suggest problematic collinearity [17] (no
problems with collinearity were found within the analyses carried out).
Statistical analyses were carried out using Statview (SAS
Institute Inc, San Francisco, CA, USA) and SPSS version 16.0
for Apple Macintosh (Chicago, IL, USA).
Statistical significance was accepted at the P < 0.05 level and
no corrections were made for multiple testing [18].
Page 3 of 13
(page number not for citation purposes)
Arthritis Research & Therapy
Vol 11 No 5
Mannion et al.
Results
The baseline sociodemographic and pain/function data for the
group of 112 patients with questionnaire data at baseline and
at 2-year follow-up are presented in Table 1. The 34 drop-outs
showed a nonsignificant tendency to be older (70 ± 9 years)
than the patients who completed the 2-year follow-up (67 ± 9
years) (P = 0.07), but showed no significant differences from
those with 2-year data regarding gender distribution (P =
0.70), body weight (P = 0.99), height (P = 0.56), baseline pain
(P = 0.86) and baseline functional limitations (P = 0.36). The
reasons for dropping out were that seven patients had died,
one patient had moved abroad, four patients had undergone
revision and did not want to continue, five patients had other
operations or physical problems, one patient did not go on to
operation (heart problem), and 16 simply did not want to continue with the study. Of the 34 drop-outs, 17 patients had
actually returned for a clinical check-up with the physician at 2
years: review of the medical notes indicated that 13 of these
patients had no pain, two patients had pain, and two patients
had no specific information on pain; 11 patients were satisfied
with the results of the operation, one patient was dissatisfied,
and five patients had no specific information; and 13 patients
had good function, one patient had poor function, and three
patients had no specific information on function.
Thirteen out of the 112 patients with baseline data and 2-year
follow-up data had undergone some sort of further surgery on
the same knee, between 1 month and 21 months after the
index surgery (eight early wound revisions, including evacuation of haematomas; four revisions with exchange of the
implant; and one secondary implantation of a patella component). As expected, this group recorded significantly worse 2year global outcomes (P = 0.003) and satisfaction grades (P
= 0.012) than the rest of the group - since these revisions
could not have been anticipated at baseline, yet they may have
had an influence on the overall outcome rating at 2 years, the
data from this group were not included in the multivariable
analyses of predictors of outcome.
Reasons for surgery
By far the most common primary reason for deciding to
undergo TKA, given by over one-half of those responding (53/
99, 53.5%), was 'I can't stand the pain any longer; something
has to be done'. This was followed by 'I want to walk without a
limp, and/or without using a cane/crutch' (17.2%), 'I want to
increase my walking endurance' (14.1%), and 'doctor's recommendation' (6.1%). The other six options were each chosen
by 1 to 3% patients (13 patients were not able to answer the
question).
The distribution of answers (n = 111) to the question 'In deciding to have knee replacement surgery, how important was it for
you to decrease your pain' was as follows: 44.1% extremely
important, 51.4% very important, 3.6% moderately important,
and just 0.9% slightly important. The same question in relation
Page 4 of 13
(page number not for citation purposes)
to 'increasing your ability to do normal activities' returned the
following answer distribution (n = 112): 48.2% extremely
important, 47.3% very important, and 4.5% moderately important.
Preoperative expectations regarding recalled time to
recovery
The expected mean time until recovery was 4.7 ± 2.8 months;
in reality, by the 2-year follow-up only 80% of the patients actually considered themselves fully recovered from the operation,
and they recalled that it had taken them, on average, 6.1 ± 3.7
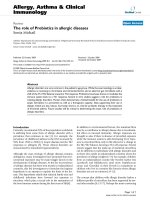
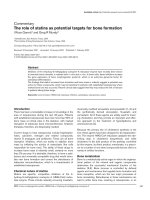
months to do so. Figure 1 shows a scatter plot of the individual
values for the expected time to recovery and the recalled time
taken to recover after the TKA. Although the correlation
between the two variables was significant, the absolute agreement was poor in many cases.
Preoperative expectations compared with actual results
2 years after surgery
The preoperative expectations for pain and function compared
with the actual outcome at 2 years follow-up are presented in
Table 2.
Consistent with the most common reason for deciding to
undergo surgery, the majority of patients (94/111, 85%)
declared that they expected no knee pain and the remainder
(17/111, 15%) declared expectation of only slight knee pain
after surgery. In reality, only 43% of the group reported being
pain-free at 2 years post operation. The patients were similarly
overly optimistic about function, with the majority of the group
expecting no limitations (58/111, 52%) or only slight limitations (48/111, 43%) after surgery, but with only 20% and
30% patients, respectively, achieving such a status.
On an individual basis, expectations regarding pain were met
or exceeded in 47% patients; for function, just 30% achieved
their expected function or better (Table 2).
Global outcome and satisfaction 24 months post surgery
The ratings of the global outcome of the knee replacement 24
months after surgery (n = 112) were as follows: 46.4% excellent, 42.0% good, 9.8% fair, and 1.8% poor (excluding the
revision patients, ratings were 49.5%, 41.4%, 9.1% and 0%,
respectively).
The ratings for satisfaction with the results of the knee replacement (n = 112) were similarly distributed, although with somewhat more patients in the highest category: 58.6% very
satisfied, 31.5% satisfied, 8.1% somewhat dissatisfied, and
1.8% dissatisfied (excluding the revision patients, ratings were
62.3%, 29.6%, 7.1% and 1.0%, respectively).
Decision to undergo surgery
In response to the question 'Now that you have learned a lot
about knee replacement surgery, if you could go back in time
Available online />
Table 1
Baseline sociodemographic, pain, function and co-morbidity characteristics of patients
Variable
Baseline value
Demographic/physical variables
Gender (n)
78 women, 34 men
Age (years)
67 ± 9
Body weight (kg)
87.5 ± 15 (men), 76.6 ± 15.5 (women)
Job status (%)
Full time
14
Part time
9
Retired/unemployed/homemaker
77
Marital status (%)
Married
61
Widowed
20
Divorced/separated
12
Never married
7
Living conditions (%)
Alone
29
With partner
65
With family
6
Pain, function and co-morbidity variables
Affected knee (%)
Left
46
Right
48
Both within 3 months
6
Pain duration (%)
< 6 months
1
6 to 12 months
9
1 to 3 years
23
3 to 5 years
14
> 5 years
53
Pain intensity (%) (n = 110)
None
1
Slight
3
Moderate
30
Severe
66
When is the pain bothersome? (%)
Have no pain
1
First few steps only
6
After long walks (> 30 minutes)
10
Whenever walk
43
Constantly, even at rest
40
Page 5 of 13
(page number not for citation purposes)
Arthritis Research & Therapy
Vol 11 No 5
Mannion et al.
Table 1 (Continued)
Baseline sociodemographic, pain, function and co-morbidity characteristics of patients
Knee limits ability to do sports (%)
No limitation
0
Slightly limits me
0
Moderately limits me
6
Greatly limits me
28
Totally limits me
30
Do not participate in sport for reasons unrelated to my knee
35
Knee limits/interferes with sexual activity (%)
No limitation
24
Slightly limits me
11
Moderately limits me
16
Greatly limits me
8
Totally limits me
1
Not sexually active for reasons unrelated to my knee
40
Knee limits ability to work (%)
No limitation
8
Slightly limits me
13
Moderately limits me
22
Greatly limits me
21
Totally limits me
6
Not working for reasons unrelated to my knee
30
Other painful joints (back, hip, foot) (%)
65
American Association of Anaesthesiologists co-morbidity grade (%)
Grade I
17
Grade II
51
Grade III
32
Data presented as n, mean ± standard deviation, or percentage.
and make the decision again, would you choose to have the
surgery?', 73.9% patients said 'yes, definitely', 18.9% said
'yes, probably', 6.3% said 'no, probably not', and 0.9% said
'no, definitely not'.
Interrelationships between the baseline and outcome
variables
Table 3 presents the bivariate correlations between the various predictors (baseline demographics and clinical status,
baseline expectations, pain/function at 2 years post operation,
change in pain from pre operation to 2 years post operation,
and fulfilment of expectations) and global outcome and satisfaction.
Page 6 of 13
(page number not for citation purposes)
Expectations, change in symptoms, and the
expectations- actuality discrepancy as predictors of
global rating of outcome
The results of the final step of the multiple regression analyses
are presented in Tables 4 and 5. In predicting the global treatment outcome, the simultaneous entry of the control variables
at the first step (demographic and baseline clinical variables)
explained a significant proportion of the variance (P = 0.034);
the variable having other joint problems made a unique significant contribution, also in the final model (P = 0.046). At the
second step, knee pain at the 2-year follow-up was selected
for entry, with a significant 20.5% increase in the step change
in R2 (P < 0.0001). At the third step, functional limitations at
the 2-year follow-up explained a further significant 4.4% variance (P = 0.022). In the final model, the variables that made a
significant unique contribution were other joint problems, knee
Available online />
Figure 1
although in the final model only other joint problems (P =
0.042) and knee pain at 2 years (P < 0.0001) were unique significant predictors (model R2 = 29%; Table 5).
Although relevant in the bivariate analyses, in neither of the
multivariable models did baseline expectations or expectations
being fulfilled make a significant contribution to explaining the
variance in global outcome or satisfaction, when the 2-year
status for pain and for functional limitations were also included
in the model.
Discussion
Time for recovery from total knee arthroplasty. Relationship between
arthroplasty
the expected time required to recover from the total knee arthroplasty
and the actual time required to recover, as recalled 2 years postoperatively.
pain at 2 years, and knee functional limitations at 2 years - with
higher values for each being associated with a poorer global
outcome.
A similar pattern of variable selection was seen when satisfaction with treatment was used as the dependent variable,
The present study sought to examine the extent to which
patient self-ratings of global outcome and satisfaction after
TKA were determined by prior expectations of the outcome, by
expectations being met, or by the actual symptom/functional
status after surgery. Studies supporting each of these putative
predictors of satisfaction have been reported in the literature
in relation to the treatment of various medical conditions
[3,4,6].
Overall, the results did not support the notion that expectations per se are important unique determinants of outcome:
the results showed low but significant associations with global
outcome and satisfaction in bivariate analyses (Table 3), but in
the multivariable analyses they did not explain any additional
variance in outcome once the (more significant) current pain/
functional status variables had been selected for entry. Some
Table 2
Distribution of baseline expectations and actual status at 2-year follow-up for pain and for function
Expected status, declared pre operation
How painful?
Actual status 2 years post operation
Not at all
Slightly
Not at all
45 (43)
32 (30)
Slightly
3 (2)
4 (4)
Moderately
-
-
Very
-
All options
How limited in function?
Not at all
Moderately
Very
All options
12 (8)
5 (4)
94 (85)
7 (4)
3 (3)
17 (13)
-
-
-
-
-
-
-
48 (45)
36 (34)
19 (12)
8 (7)
111a (98)
Not at all
Slightly
Moderately
Greatly
All options
16 (16)
22 (21)
15 (10)
5 (3)
58 (50)
Slightly
5 (5)
12 (12)
18 (17)
13 (9)
48 (43)
Moderately
0
0
0
4 (4)
4 (4)
Greatly
0
0
1 (1)
0
1 (1)
All options
21
34
34
22
111a
Values in parentheses are those for the group excluding patients who had undergone further operations on the knee. Pain - in the whole group,
expectations were met in 44% of patients (values in italics), were not met in 53% (values marked bold), and were exceeded in 3%. Function - in
the whole group, expectations were met in 25% of patients (values in italics), were not met in 70% (values marked bold), and were exceeded in
5%. aOne patient had missing data preoperatively, hence n = 111(98).
Page 7 of 13
(page number not for citation purposes)
Arthritis Research & Therapy
Vol 11 No 5
Mannion et al.
previous studies in orthopaedics also found no unique role for
expectations per se in predicting the improvement in function
[19] or the global outcome of surgery [20]. Other authors
found that baseline expectations in some domains explained
up to 13% of the variance in total joint replacement outcome
[11,12], measured using either generic, joint-specific or painscale instruments. In neither of these studies, however, was
the relationship between expectations and global outcome or
satisfaction assessed. Also in the present study, bivariate analyses showed that baseline expectations predicted the change
in pain and change in functional limitations, accounting for a
similar proportion of variance to that reported by Engel and
colleagues [11] and by Mahomed and colleagues [12] (9 to
16%, r = 0.3 to 0.4; Table 3); however, these results did not
retain significance in the multivariable model predicting the
overall global outcome or satisfaction. De Groot and colleagues reported that spine surgery patients who had optimistic expectations about postoperative pain were less
disappointed with surgery than were patients with pessimistic
expectations, although the same did not apply for the outcomes rate of recovery or return to work [21]. Further, similar
to the results of the multivariable analysis in the present study,
it transpired that when the postoperative back pain at 3
months was considered a covariate in predicting disappointment with surgery, the influence of baseline expectations
regarding pain was lost [21]. It therefore appears that the
actual status may be more predictive than expectations per se
when satisfaction or global outcome is modelled using multivariable techniques.
expected to be unlimited in their usual activities [12]. Burton
and colleagues reported that the majority expected to be painfree but only 55% actually were [13]. In most expectations
studies, the present one included, it is not known whether
expectations reflect dispositional optimism (that is, the expectation that good outcomes generally occur when confronted
with problems across important life domains) [8] or reflect
considered expectations based on information received (for
example, during the consultation, through patient information
sources, personal experience), or indeed a combination of
both. Either way, these findings in relation to the overestimation of the probable result of surgery highlight the importance
of both routine outcome assessment and longitudinal studies
of the factors influencing outcome, to guide informed discussion with the patient regarding the extent of improvement that
can realistically be achieved.
The negative influence of other joint problems on the probable
outcome of TKA may need to be emphasised to a greater
extent in the preoperative informed consent process. As banal
as it may seem, it is important that patients with co-morbidity
in terms of other joint problems (though according to the
present study not in relation to general co-morbidity as measured with the American Association of Anaesthesiologists comorbidity score) are made aware that the operation is being
carried out for the specific knee joint disease identified, and
that it will not necessarily serve as a general panacea for other
ongoing medical problems. Indeed, ongoing pain and functional limitations in connection with other joint problems will
probably persist after the surgery, and influence general functioning and the quality of life accordingly. If this is not explicitly
discussed with the patient prior to surgery, then inappropriate
expectations may go unchecked, ultimately leading to disappointment with the result.
In the present study, in both of the multivariable regression
models, the most significant predictor of the 2-year global outcome/satisfaction was the current knee status (pain and functional limitations). Interestingly, and in contrast to some
previous studies [4,5,20], the variable describing the fulfilment
of expectations for pain (expectations- actuality discrepancy)
did not achieve significance in the multivariable model, even
though it had shown a significant correlation with both global
outcome and satisfaction in the bivariate analyses (r = 0.3 to
0.5, P < 0.05). This was most probably the result of the high
correlations between pain/functional limitations at the 2-year
follow-up and the fulfilment of expectations in these domains
(r = 0.8 to 0.9; Table 3), leading to just one of these two variables retaining significance in the given multivariable model.
The salient features of the present study include its prospective nature, its relatively large sample size, its examination of
different domains for which the patient may hold expectations,
and its multivariable approach to the analysis. Further, the
overall proportion of successful outcomes (88.5% excellent
and good) was similar to the figures presented in previous
studies (86% [13], 85% [23]), providing confidence in the
generalisability of the findings. Several limitations, however,
must also be acknowledged.
The patients' expectations of surgery declared in the present
investigation were quite high, and were overly optimistic compared with the actual results achieved. The vast majority (85%)
of patients expected to be pain free, yet only 43% were; and
52% expected to have no functional limitations, yet just 20%
achieved this. This overestimation of the probable improvement after TKA [12,13] and other kinds of elective orthopaedic
surgery [20,22] has been reported before. Mahomed and colleagues found that, in a mixed sample of hip and knee arthroplasty patients, 75% expected to be pain-free and 40%
The questionnaire used to assess the (preoperative) expectations of improvement and the (postoperative) achievement of
improvement and overall outcome has not been validated for
use in the knee; it was originally developed and validated for
use in the hip [16]. Many of the current hip and knee questionnaires, however, show considerable overlap in their item content (for example, the Oxford hip questionnaire and the Oxford
knee questionnaire [24]), and the items in the Total Arthroplasty Outcome Evaluation Questionnaire appeared to display
acceptable face validity also for the knee. In fact, no questions
Page 8 of 13
(page number not for citation purposes)
Table 3
Correlation matrix showing inter-relationships between the examined predictors, global outcome and satisfaction
Gender
(male 0,
female 1)
Age
Other joint
problems
(no 1,
yes 2)
ASA score
(comorbidity)
Pain pre
operationa
Functional
limitations
pre
operationa
Expectati
ons about
paina
Expectatio
ns about
functional
limitationsa
Expectati
ons about
recovery
time
Pain at 2
yearsa
0.224*
1.000
Pain pre
operationa
0.021
0.055
-0.111
0.010
1.000
Functional
limitations pre
operationa
0.044
-0.020
-0.010
-0.169
0.218
1.000
Expectations
about paina
0.000
-0.240*
0.077
-0.026
0.019
0.096
1.000
Expectations
about
functional
limitationsa
-0.271*
-0.004
0.146
0.176
0.117
0.010
0.255*
1.000
Expectations
about
recovery time
-0.014
-0.292**
0.179
-0.181
0.062
-0.100
0.136
0.030
1.000
Pain at 2
yearsa
-0.053
-0.288**
0.231*
0.089
0.221*
0.055
0.312**
0.303**
0.175
1.000
Functional
limitations at
2 yearsa
-0.131
-0.143
0.163
0.110
0.349**
0.267*
0.342**
0.492**
0.020
0.389**
Global
treatment
outcomec
1.000
(page number not for citation purposes)
0.388**
Expectatio
ns fulfilled,
functional
limitationsb
1.000
0.025
Expectations
fulfilled,
painb
Page 9 of 13
-0.163
ASA score
(co-morbidity)
Vol 11 No 5
-0.089
Change in
functional
limitations,
pre
operation
to 2 yearsa
1.000
Other joint
problems
(no 1, yes 2)
Arthritis Research & Therapy
0.073
Change in
pain, pre
operation
to 2 yearsa
1.000
Age
Mannion et al.
Gender (male
0, female 1)
Functional
limitations
at 2 yearsa
Table 3 (Continued)
Correlation matrix showing inter-relationships between the examined predictors, global outcome and satisfaction
0.035
0.335**
-0.288**
-0.048
0.420**
0.083
-0.318**
-0.198
-0.171
-0.765**
-0.158
1.000
Change in
functional
limitations,
pre to 2yb
0.154
0.133
-0.138
-0.204
-0.231*
0.344**
-0.293**
-0.469**
-0.073
-0.325**
-0.791**
0.171
1.000
Expectations
fulfilled, painb
0.045
0.226*
-0.236*
-0.091
-0.253*
-0.017
0.023
-0.225*
-0.140
-0.930**
-0.291**
0.678**
0.248*
1.000
Expectations
fulfilled,
functional
limitationsb
-0.044
0.146
-0.090
-0.052
-0.326**
-0.256*
-0.183
0.059
-0.009
-0.261*
-0.818**
0.065
0.618**
0.230*
1.000
Global
treatment
outcomec
0.007
-0.111
0.302**
0.032
0.041
0.085
0.236*
0.237*
0.150
0.405**
0.384**
-0.389**
-0.262*
-0.355**
-0.255*
1.000
Satisfactionc
-0.014
-0.154
0.323**
0.100
0.010
0.036
0.274*
0.262*
0.102
0.567**
0.264*
-0.543**
-0.194
-0.498**
-0.094
0.800**
Page 10 of 13
Arthritis Research & Therapy
(page number not for citation purposes)
Data in bold are significant: *P < 0.05 (two-tailed), **P < 0.01 (two-tailed). n = 80 patients (listwise exclusion of missing data, and excluding patients (n = 13) that underwent further surgery on the index knee).
ASA, American Association of Anaesthesiologists. aHigher value = more pain (or expect more pain) or greater functional limitations (or expect greater functional limitations). bHigher value = better outcome
(greater change in pain or functional limitations, greater fulfilment of expectations). cHigher value = worse outcome, or lower satisfaction.
Vol 11 No 5
Mannion et al.
Change in
pain, pre
operation to 2
yearsb
Available online />
Table 4
Results of multiple regression analysis explaining variance in global outcome at 2 years
Step
Step change in R2
P value for step change in R2 β for final model
(only significant predictor variables shown)
P value
First
0.098
0.034
0.189 (other joint problems)
0.046
Second
0.205
< 0.0001
0.384 (pain at 2 years)
0.001
Third
0.044
0.022
0.238 (functional limitations at 2 years)
0.022
Adjusted R2 for model 0.307
Results of multiple regression analysis showing the factors that made a unique significant contribution to explaining variance in global outcome at
2 years (1 = excellent, 4 = poor). In the final model, the significant predictors of a poorer outcome were: other joint problems, more pain at 2 years
post operation, and greater functional limitation at 2 years post operation. n = 87 patients (listwise exclusion of missing data, and excluding
patients (n = 13) that underwent further surgery on the index knee). Apart from the demographic variables, predictor variables were entered on the
basis of the significance of their bivariate correlation with the dependent variable: step 1, simultaneous entry for age, gender, other joint problems
(yes/no); steps 2 and 3, forward conditional entry for preoperative expectations (about pain and about functional limitations), knee status at 2-year
follow-up (in terms of pain and functional limitations), change in knee status from pre surgery to 2 years (in terms of pain and functional limitations),
expectations - actuality scores for knee status (that is, expected status minus actual status at 2 years) (in terms of pain and functional limitations).
Step change in R2, increase in explained variance at the given step; adjusted R2, R2 - (k - 1)/(n - k) × (1 - R2), where n is the number of
observations and k is the number of independent variables; β for final model, β value after all variables have been entered; P value, significance of
final β value for the stated variable.
in the questionnaire relate to specifically hip-related activities
and most questions just focus on pain and general activities
that affect the lower extremities. Nonetheless, future studies
would be required to establish the questionnaire's construct
validity by comparison with other knee-specific questionnaires.
Furthermore, our German version of the Total Arthroplasty
Outcome Evaluation Questionnaire did not undergo the currently recommended, stringent procedure for the cross-cultural adaptation of questionnaires [25]; indeed, the
questionnaire was produced for use in the hospital before the
widespread adoption of such guidelines. Primarily, it represented a translation by a bilingual (first language, German)
rheumatologist, cross-checked by a bilingual colleague (first
language, English) and reviewed by various bilingual clinicians.
The Total Arthroplasty Outcome Evaluation Questionnaire was
chosen for use in the present investigation because, when the
study was first designed, this instrument appeared to offer one
of the most comprehensive, but simple and efficient, means of
assessing the many domains/constructs of interest in arthroplasty patients. Most of the individual scales in the questionnaire are single-item measures (that is, one item per construct)
with adjectival or Likert scales; although a number of studies
have shown that these can be just as valid and representative
of a domain as multi-item scales [26,27], it would be of interest
to confirm the present findings using the currently more popular multi-item scales such as the Oxford-12, the Western
Ontario and McMaster Universities Osteoarthritis Index, and
so forth [28]. Similarly the use of a more extensive questionnaire to assess co-morbidity might deliver more precise information about other illnesses/disorders potentially influencing
outcome [29] than does the American Association of Anaesthesiologists co-morbidity score.
In relation to the statistical analyses used in the present study,
the regression models examined the main effects of level of
Table 5
Results of multiple regression analysis explaining variance in satisfaction at 2 years
Step
Step change in R2
P value for step change in R2 β for final model
(only significant predictor variables shown)
P value
First
0.095
0.040
0.194 (other joint problems)
0.042
0.231
< 0.0001
0.517 (pain at 2 years)
< 0.0001
Second
Adjusted
R2 for
model 0.293
Results of the multiple regression analysis showing the factors that made a unique significant contribution to explaining the variance in satisfaction
at 2 years (1 = very satisfied, 4 = very dissatisfied). In the final model, the significant predictors of a poorer outcome were: other joint problems,
more pain at 2 years post operation, and greater functional limitation at 2 years post operation. n = 87 patients (listwise exclusion of missing data,
and excluding patients (n = 13) that underwent further surgery on the index knee). Apart from the demographic variables, predictor variables were
entered on the basis of the significance of their bivariate correlation with the dependent variable: step 1, simultaneous entry for age, gender, other
joint problems (yes/no); step 2, forward conditional entry for preoperative expectations (about pain and about functional limitations), knee status at
2-year follow-up (in terms of pain and functional limitations), change in knee status from pre surgery to 2 years (in terms of pain and functional
limitations), expectations - actuality scores for knee status (that is, expected status minus actual status at 2 years) (in terms of pain and functional
limitations). Step change in R2, increase in explained variance at the given step; adjusted R2, R2 - (k - 1)/(n - k) × (1 - R2), where n is the number
of observations and k is the number of independent variables; β for final model, β value after all variables have been entered; P value, significance
of final β value for the stated variable.
Page 11 of 13
(page number not for citation purposes)
Arthritis Research & Therapy
Vol 11 No 5
Mannion et al.
expectations, regardless of whether these were met, and of
fulfilled expectations, independent of their preoperative level.
However, perhaps the interaction of both should be considered, for example to investigate whether expectations that are
met lead to a good outcome only when expectations are high.
This particular analysis could not be carried out in the present
study, because, for the given sample size, the power using
moderated hierarchical regression analysis would have been
too low [30] and because there were so few patients with low
expectations that the moderated test would have been somewhat biased. Future studies should address these issues.
4.
5.
6.
7.
8.
Conclusions
In the patient group examined, patient expectations of surgery
were generally overly optimistic. This highlights the importance
of routinely assessing patient-orientated outcome and the various factors influencing it, such that realistic expectations for
different outcome domains can be discussed with the individual patient prior to surgery. Although in bivariate analyses
expectations being met were significantly associated with outcome, in the final multivariable model only the presence of
other joint problems and the degree of improvement in symptoms and function were unique significant determinants of a
good global outcome and of satisfaction with the procedure.
Competing interests
9.
10.
11.
12.
13.
14.
The authors declare that they have no competing interests.
15.
Authors' contributions
IK-dQ and UM were responsible for the conception and
design of the main study, of which this substudy is part, and
acquired funding for the project; they also coordinated all of
the practical work and acquisition of data. AFM performed the
statistical analysis, interpreted the data and drafted the manuscript. SK organised and prepared the data for analysis, and
assisted with some of the statistical analyses and with the writing of the manuscript. All authors read and approved the final
manuscript.
Acknowledgements
The authors thank the physiotherapists of the Schulthess Klinik, in particular Michelle Van Damne, Mario Bizzini, and Filomena Caporaso, for
their assistance with the data collection.
16.
17.
18.
19.
20.
21.
22.
The present research project was supported by a project research grant
from the Swiss National Science Foundation (grant number 32/
4984396) and by the Wilhelm Schulthess Foundation Research Fund.
All authors were employees of the Schulthess Klinik at the time of the
study.
References
1.
2.
3.
Wright JG, Young NL: The patient-specific index: asking
patients what they want. J Bone Joint Surg Am 1997,
79:974-983.
Wright JG, Young NL, Waddell JP: The reliability and validity of
the self-reported patient-specific index for total hip arthroplasty. J Bone Joint Surg Am 2000, 82:829-837.
Mondloch MV, Cole DC, Frank JW: Does how you do depend on
how you think you'll do? A systematic review of the evidence
Page 12 of 13
(page number not for citation purposes)
23.
24.
25.
26.
for a relation between patients' recovery expectations and
health outcomes. CMAJ 2001, 165:174-179.
Pager CK: Expectations and outcomes in cataract surgery: a
prospective test of 2 models of satisfaction. Arch Ophthalmol
2004, 122:1788-1792.
Ross CK, Frommelt G, Hazelwood L, Chang RW: The role of
expectations in patient satisfaction with medical care. J Health
Care Mark 1987, 7:16-26.
Flood AB, Lorence DP, Ding J, McPherson K, Black NA: The role
of expectations in patients' reports of post-operative outcomes and improvement following therapy. Med Care 1993,
31:1043-1056.
Koyama T, McHaffie JG, Laurienti PJ, Coghill RC: The subjective
experience of pain: where expectations become reality. Proc
Natl Acad Sci USA 2005, 102:12950-12955.
Scheier MF, Carver CS: Dispositional optimism and physical
well-being: the influence of generalized outcome expectancies on health. J Pers 1987, 55:169-210.
Linder-Pelz S: Social psychological determinants of patient satisfaction: a test of five hypothesis. Soc Sci Med 1982,
16:583-589.
Carr-Hill RA: The measurement of patient satisfaction. J Public
Health Med 1992, 14:236-249.
Engel C, Hamilton NA, Potter PT, Zautra AJ: Impact of two types
of expectancy on recovery from total knee replacement surgery (TKR) in adults with osteoarthritis. Behav Med 2004,
30:113-123.
Mahomed NN, Liang MH, Cook EF, Daltroy LH, Fortin PR, Fossel
AH, Katz JN: The importance of patient expectations in predicting functional outcomes after total joint arthroplasty. J Rheumatol 2002, 29:1273-1279.
Burton KE, Wright V, Richards J: Patients' expectations in relation to outcome of total hip replacment surgery. Ann Rheum
Dis 1979, 38:471-474.
Mancuso CA, Salvati EA, Johanson NA, Peterson MG, Charlson
ME: Patients' expectations and satisfaction with total hip
arthroplasty. J Arthroplasty 1997, 12:387-396.
Moran M, Khan A, Sochart DH, Andrew G: Expect the best, prepare for the worst: surgeon and patient expectation of the outcome of primary total hip and knee replacement. Ann R Coll
Surg Engl 2003, 85:204-206.
Katz JN, Phillips CB, Poss R, Harrast JJ, Fossel AH, Liang MH,
Sledge CB: The validity and reliability of a Total Hip Arthroplasty Outcome Evaluation Questionnaire. J Bone Joint Surg
Am 1995, 77:1528-1534.
Heiberger RM, Holland B, editors: Statistical Analysis and Data
Display New York, USA: Springer; 2004.
Perneger TV: What's wrong with Bonferroni adjustments. BMJ
1998, 316:1236-1238.
Lutz GK, Butzlaff ME, Atlas SJ, Keller RB, Singer DE, Deyo RA:
The relation between expectations and outcomes in surgery
for sciatica. J Gen Intern Med 1999, 14:740-744.
Mannion AF, Junge A, Elfering A, Dvorak J, Porchet F, Grob D:
Great expectations: really the novel predictor of outcome after
spinal surgery? Spine 2009, 34:1590-1599.
de Groot KI, Boeke S, Passchier J: Preoperative expectations of
pain and recovery in relation to postoperative disappointment
in patients undergoing lumbar surgery. Med Care 1999,
37:149-156.
McGregor AH, Hughes SP: The evaluation of the surgical management of nerve root compression in patients with low back
pain: Part 2: patient expectations and satisfaction. Spine 2002,
27:1471-1476. discussion 1476-1477.
Hawker G, Wright J, Coyte P, Paul J, Dittus R, Croxford R, Katz B,
Bombardier C, Heck D, Freund D: Health-related quality of life
after knee replacement. J Bone Joint Surg Am 1998,
80:163-173.
Pynsent PB, Adams DJ, Disney SP: The Oxford hip and knee
outcome questionnaires for arthroplasty. J Bone Joint Surg Br
2005, 87:241-248.
Beaton DE, Bombardier C, Guillemin F, Ferraz MB: Guidelines for
the process of cross-cultural adaptation of self-report measures. Spine 2000, 25:3186-3191.
van Hooff ML, Geurts SA, Kompier MA, Taris TW: 'How fatigued
do you currently feel?' Convergent and discriminant validity of
a single-item fatigue measure.
J Occup Health 2007,
49:224-234.
Available online />
27. Mannion AF, Elfering A, Staerkle R, Junge A, Grob D, Semmer NK,
Jacobshagen N, Dvorak J, Boos N: Outcome assessment in low
back pain: how low can you go? Eur Spine J 2005,
14:1014-1026.
28. Johanson NA, Liang MH, Daltroy L, Rudicel S, Richmond J: American Academy of Orthopaedic Surgeons lower limb outcomes
assessment instruments. Reliability, validity, and sensitivity to
change. J Bone Joint Surg Am 2004, 86-A:902-909.
29. Slover J, Abdu WA, Hanscom B, Weinstein JN: The impact of
comorbidities on the change in short-form 36 and oswestry
scores following lumbar spine surgery.
Spine 2006,
31:1974-1980.
30. Aiken LS, West SG: Multiple regression Thousand Oaks, CA:
Sage; 1991.
Page 13 of 13
(page number not for citation purposes)