Handbook of clinical drug data - part 10 doc
Bạn đang xem bản rút gọn của tài liệu. Xem và tải ngay bản đầy đủ của tài liệu tại đây (487.95 KB, 111 trang )
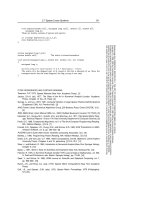
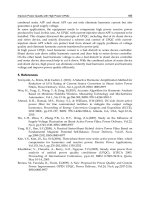
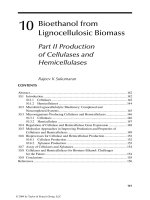
TABLE 6–8. AMINO ACID SOLUTIONS COMPARISON CHART
ELECTROLYTES (mEq/L)
AA SOLUTION AND TOTAL TOTAL
OSMOLARITY BCAAs ESSENTIAL TOTAL N PO
4
OSMOLARITY
CONCENTRATION (g/dL) AAs (g/dL) (g/dL) Na
+
K
+
Mg
++
Cl
−
Ac
−
(mmol/L) (mOsm/L)
FOR GENERAL PURPOSE
Aminosyn 3.5%
a
0.86 1.65 0.55 7 — — — 46 — 357
Aminosyn 5%
a
1.23 2.35 0.79 — 5.4 — — 86 — 500
Travasol 5.5% 0.86 2.15 0.93 — — — 22 48 — 575
(with electrolytes) 70 60 10 70 102 30 850
Aminosyn 7%
a
1.73 3.32 1.1 — 5.4 — — 105 — 700
(with electrolytes) 76 66 10 96 124 30 1013
Aminosyn 8.5%
a
2.11 4.06 1.34 — 5.4 — 35 90 — 850
(with electrolytes) 70 66 10 86 142 30 1160
Travasol 8.5% 1.32 3.34 1.43 — — — 34 72 — 890
(with electrolytes) 70 60 10 70 141 30 1160
FreAmine III 8.5% 1.92 3.94 1.43 10 — — <3 72 10 810
(with electrolytes) 60 60 10 60 125 20 1045
Aminosyn 10% 2.46 4.7 1.57 — 5.4 — — 148 — 1000
Aminosyn II 10% 2.16 4.3 1.53 45 — 10 — 72 — 873
FreAmine III 10% 2.26 4.63 1.53 10 — — <3 89 10 950
Travasol 10% 1.91 4.05 1.65 — — — 40 87 — 1000
Novamine 2.09 5.11 1.8 — — — — 114 — 1057
(continued )
1039
ch16.qxd 8/14/2001 8:07 AM Page 1039
TABLE 6–8. AMINO ACID SOLUTIONS COMPARISON CHART (continued )
ELECTROLYTES (mEq/L)
AA SOLUTION AND TOTAL TOTAL
OSMOLARITY BCAAs ESSENTIAL TOTAL N PO
4
OSMOLARITY
CONCENTRATION (g/dL) AAs (g/dL) (g/dL) Na
+
K
+
Mg
++
Cl
−
Ac
−
(mmol/L) (mOsm/L)
Aminosyn II 15% 3.24 6.42 2.3 63 — — — 108 — 1300
Novamine 15% 2.75 6.72 2.37 — — — — 151 — 1388
FOR PROTEIN SPARING
ProcalAmine 3%
b
0.68 1.4 0.46 35 24 5 41 47 3.5 735
FreAmine III 3% 0.68 1.4 0.46 35 24.5 5 41 44 3.5 405
(with electrolytes)
Aminosyn 3.5% M
a
0.86 1.65 0.55 47 13 3 40 58 3.5 477
3.5% Travasol 0.55 1.38 0.59 25 15 5 25 52 7.5 450
(with electrolytes)
FOR RENAL FAILURE
Aminess 5.2% 1.95 5.18 0.66 — — — — 50 — 416
Aminosyn RF 5.2% 1.72 4.83 0.79 — 5.4 — — 105 — 475
NephrAmine 5.4% 2.08 5.33 0.65 5 — — <3 44 — 435
RenAmin 6.5% 1.92 4.32 1.0 — — — 31 60 — 600
FOR TRAUMA
BranchAmin 4%
c,d
4.0 4.0
d
0.44 — — — — — — 316
FreAmine HBC 6.9%
c
3.01 4.28 0.97 10 — — <3 57 — 620
Aminosyn HBC 7%
c
3.15 4.21 1.12 7 40 — — 72 — 665
(continued )
1040
ch16.qxd 8/14/2001 8:07 AM Page 1040
TABLE 6–8. AMINO ACID SOLUTIONS COMPARISON CHART (continued )
ELECTROLYTES (mEq/L)
AA SOLUTION AND TOTAL TOTAL
OSMOLARITY BCAAs ESSENTIAL TOTAL N PO
4
OSMOLARITY
CONCENTRATION (g/dL) AAs (g/dL) (g/dL) Na
+
K
+
Mg
++
Cl
−
Ac
−
(mmol/L) (mOsm/L)
FOR LIVER DISEASE
HepatAmine
c
2.84 4.17 1.2 10 — — <3 62 10 785
FOR PEDIATRICS
Aminosyn-PF 7% 1.82 3.2 1.07 3.4 — — — 33 — 586
Aminosyn-PF 10% 2.63 4.61 1.52 3.4 — — — 46 — 834
TrophAmine 6% 1.8 4.28 0.93 5 — — <3 56 — 525
TrophAmine 10% 3.0 7.2 1.55 5 — — <3 97 — 875
a
Also available as Aminosyn II which contains glutamic and aspartic acids, and differs slightly in content of other amino acids, acetate, and chloride.
b
Contains glycerol as a nonprotein calorie source.
c
BCAA–enriched products. Each of these products has distinct indications for use and should not be interchanged.
d
Contains only BCAA. Other essential AA are not included.
AA, amino acid; BCAA, branched-chain amino acid.
1041
ch16.qxd 8/14/2001 8:07 AM Page 1041
placement therapy such as peritoneal or hemodialysis require essential and
nonessential AAs and should receive standard AA solutions.
Hepatic Failure. Patients with hepatic failure, in whom muscle breakdown and
an altered serum and CNS AA profile might contribute to hepatic encephalopathy,
can benefit from a special AA formula. This formula has relatively greater
amounts of BCAAs (ie, leucine, isoleucine, valine) and smaller amounts of the
aromatic acids (ie, phenylalanine, tyrosine, tryptophan) and methionine.
26
One
parenteral formula, HepatAmine, is currently available specifically for therapeutic
and nutrition support of patients with liver disease (see Table 6–8).
Stress and Trauma. The hypermetabolism that occurs in response to stress and
trauma presents difficulty in providing nutrition support. BCAAs, in addition to
their useful effect in metabolic support of the patient with liver disease, are re-
ported to be useful for patients with stress and trauma.
27,28
Three BCAA-enriched
products are available (see Table 6–8). FreAmine HBC and Aminosyn HBC are
solutions of nonessential and essential AAs enriched with BCAAs. BranchAmin
4% is a solution of only BCAAs intended for use as a supplement to be admixed
with a complete AA and a nonprotein caloric source. These products are indicated
only for stress and trauma and should not be confused with the BCAA-enriched
product that is indicated for hepatic encephalopathy.
Pediatrics. It is beyond the scope of this chapter to describe procedures for nu-
trition support of pediatric patients except for this brief mention of parenteral AA
products. Crystalline AA solutions marketed for infants are based on the essential-
ity of certain AAs in these patients (see Table 6–8).
29
Compared with adult AA
formulations, these products contain taurine and glutamic and aspartic acids. In-
creased amounts of tyrosine and histidine and lower amounts of phenylalanine,
methionine, and glycine are included. Although cysteine is also assumed to be es-
sential for infants, adequate amounts cannot be included in AA formulas because
of its limited solubility. A cysteine solution (50 mg/mL) is available separately for
admixture to the formula before administration.
■ ELECTROLYTES
Formulas also are available with standard electrolyte compositions that might be
suitable for most patients, after the addition of certain additives. Electrolyte provi-
sion, however, should be based on close monitoring of patients’ laboratory values.
Average daily requirements are summarized in Table 6–9.
VITAMINS
Vitamin requirements for PN have been suggested in a report by an advisory
group to the American Medical Association (AMA).
30
Multiple vitamins are avail-
able in adult and pediatric formulations for once-daily IV administration (see
Table 6–10). The usual daily dosage of the adult formulation is 10 mL to provide
the amounts of vitamins specified in Table 6–10. The daily dosage of the pediatric
formulation for infants who weigh <1 kg is 1.5 mL. For infants weighing 1–3 kg,
the daily dosage is 3 mL. For infants and children weighing ≥3 kg up to 11 yr of
1042 N
UTRITION
S
UPPORT
ch16.qxd 8/14/2001 8:07 AM Page 1042
TABLE 6–9. ELECTROLYTES AND REQUIREMENTS
AVERAGE DAILY
ELECTROLYTES REQUIREMENT DOSAGE FORMS COMMENTS
CATIONS
Sodium 60–150 mEq Sodium chloride concentrate (4 mEq/mL) Requirements during parenteral nutrition should not differ from
Sodium acetate (2 mEq/mL) normal fluid therapy requirements unless there is excessive
Sodium phosphate (4 mEq Na
+
/mL) sodium loss. Lactate and bicarbonate salts of sodium should not be used.
Potassium 40–240 mEq Potassium chloride (2 mEq/mL) Requirements are related to glucose metabolism and therefore
Potassium acetate (2 mEq/mL) increase with higher concentrations of dextrose infused.
Potassium phosphate (4.4 mEq K
+
/mL)
Magnesium 10–45 mEq Magnesium sulfate (4 mEq/mL) Requirements increase with anabolism but with less variation than
with potassium.
Calcium 5–30 mEq Calcium gluconate 10% (4.5 mEq/10 mL) Requirements increase only slightly during parenteral nutrition.
Calcium chloride 10% (13 mEq/10 mL) Limited amounts of calcium and phosphate, as determined by compatibility
references, may be combined in solutions that
contain amino acids.
ANIONS
Phosphate 10 mmol/1000 kcal Potassium phosphate (3 mmol P/mL, Abbott) Requirements increase with anabolism. Safe empirical dosage
Sodium phosphate (3 mmol P/mL, Abbott) guidelines should be developed, taking into account the sodium
(other concentrations may vary according or potassium content of the phosphate solution.
to manufacturer)
Acetate and The amounts of acetate and chloride contained in each amino acid solution vary. (See Table 6–8.) Acetate is metabolized to bicarbonate.
Chloride Bicarbonate salts should not be added to PN solutions because of incompatibility.
1043
ch16.qxd 8/14/2001 8:07 AM Page 1043
age, the daily dosage is 5 mL. Vitamin K is included in the pediatric product only.
Phytonadione 5 mg may be given to adults weekly in the PN formula, or by IM or
SC administration, if needed.
30
Fat emulsion contains vitamin K. Intralipid 10% contains about 0.31 mg/L
and Liposyn II contains 0.13 mg/L; 20% products contain twice as much. In-
tralipid 20% 500 mL provides about 300 g of vitamin K, an amount that exceeds
maintenance recommendations and interferes with oral anticoagulant therapy.
30
1044 N
UTRITION
S
UPPORT
TABLE 6–10. IV MULTIVITAMINS
AMOUNT
TYPICAL FORMULA Adult (per vial) Pediatric (5 mL)
Ascorbic Acid (C) 100 mg 80 mg
Vitamin A 3300 IU 2300 IU
Vitamin D 200 IU 400 IU
Vitamin E 10 IU 7 IU
Thiamine (B
1
) 3 mg 1.2 mg
Riboflavin (B
2
) 3.6 mg 1.4 mg
Niacinamide (B
3
) 40 mg 17 mg
Pantothenic Acid (B
5
) 15 mg 5 mg
Pyridoxine (B
6
) 4 mg 1 mg
Biotin 60 g 20 g
Folic Acid 400 g 140 g
Cyanocobalamin (B
12
)5 g1 g
Phytonadione (K
1
) 0 200 g
TRACE ELEMENTS
Solutions of individual trace elements are available in several concentrations from
different manufacturers. Solutions of multiple trace elements also are commer-
cially available in products containing 4, 5, 6, or 7 elements and in concentrations
suitable for adult or pediatric use. Guidelines for the use of trace elements in PN
have been reported in an AMA statement
31
and the recommended daily dosages
appear in Table 6–11. Although a need for molybdenum and iodine in long-term
PN has been described, there are no officially recommended requirements for
these elements.
32–34
IRON
Iron deficiency can occur in patients deprived of iron during long-term PN. Iron
dextran is sometimes added to PN solutions, but the advisability of its routine use
ch16.qxd 8/14/2001 8:07 AM Page 1044
and its compatibility with fat emulsion are questionable. Dosage recommenda-
tions by this route are 1–12.5 mg/day of iron.
36
INSULIN
Many patients who receive PN become hyperglycemic. When feasible, the cause
should be investigated and controlled by means other than insulin before insulin is
employed (see Table 6–12). Although the efficacy of PN is reportedly enhanced by
insulin,
37
it should be used cautiously to avoid hypoglycemia and because it pro-
motes deposition of fatty acids in body fat stores, making them less available for
important biochemical pathways.
38
When it is required, insulin may be provided
separately by SC or IV administration or added to the PN formula. Until a patient is
stabilized on a consistent dosage of insulin, it is more cost effective to provide in-
sulin separately to avoid wasting of PN formulations that might be discarded if the
insulin dosage needs to be changed.
39
Human insulin is the least immunogenic and
is therefore the insulin of choice. Guidelines for dosage are empirical; one-half to
two-thirds of the previous day’s sliding scale requirements may be added as regular
human insulin to the daily PN formula. Standardized admixture procedures should
be used to minimize variations of insulin activity caused by adsorption loss.
N
UTRITION
S
UPPORT
1045
TABLE 6–11. SUGGESTED DAILY IV DOSAGE OF TRACE ELEMENTS
ADULT IN STABLE ADULT
PEDIATRIC ACUTE WITH
TRACE PATIENTS CATABOLIC INTESTINAL
ELEMENT (µG/kg)
a
STABLE ADULT STATE
b
LOSSES
b
Zinc 400 (preterm)
c
2.5–4 mg Additional Add 12.2 mg/L of
250 (<3 months)
d
2 mg small-bowel fluid
100 (>3 months–1 yr)
d
lost; 17.1 mg/kg of
50 (>1 yr)
d
stool or ileostomy
output.
e
Copper 20 0.5–1.5 mg — —
Chromium 0.14–0.2 10–15 g — 20 g
f
Manganese 1 0.15–0.8 mg — —
Selenium 2 20–60 g— —
a
Limited data are available for infants weighing <1500 g. Their requirements might be more than the
recommendations because of their low body reserves and increased requirements for growth.
b
Frequent monitoring of plasma levels in these patients is essential to provide proper dosage.
c
Premature infants (weight <1500 g) up to 3 kg of body weight. Thereafter, the recommendations for
full-term infants apply.
d
Full-term infants and children ≤5 yr old. Thereafter, the recommendations for adults apply, up to a
maximum dosage of 4 mg/day.
e
Values derived by mathematical fitting of balance data from a 71 patient-week study in 24 patients.
f
Mean from balance study.
Modified from references 31 and 35.
ch16.qxd 8/14/2001 8:07 AM Page 1045
1046 N
UTRITION
S
UPPORT
TABLE 6–12. NUTRITION SUPPORT: METABOLIC COMPLICATIONS
AND MANAGEMENT
COMPLICATION FREQUENT CAUSES MANAGEMENT
Hyponatremia Excessive GI or urinary Increase sodium provision.
sodium losses, or inadequate
sodium intake.
Excessive water intake. Limit free water.
Hypokalemia Excessive GI or urinary potassium Increase potassium provision.
losses; deficit of potassium; or
large glucose infusion.
Hypocalcemia Insufficient calcium. Increase calcium provision.
Magnesium deficit. Increase magnesium provision.
Hypomagnesemia Insufficient magnesium; or
excessive GI or urinary losses. Increase magnesium provision.
Hypophosphatemia Inadequate phosphate. Increase phosphate provision.
Refeeding syndrome. Refeed gradually.
Hypoglycemia Abrupt interruption of formula Begin dextrose infusion and moni-
infusion. tor blood glucose and potassium.
Excessive insulin. Decrease insulin.
Hyperglycemia Deficit of potassium or Increase potassium or phosphate
phosphorus. provision.
Insufficient insulin. Give insulin.
Corticosteriod use. Reduce rate of glucose infusion.
Sepsis. Sepsis workup and treatment.
Hypertriglyceridemia Impaired clearance. Hold IV lipid if serum triglycerides
>400 mg/dL (4.5 mmol/L).
Elevated BUN Dehydration. Correct dehydration.
Renal dysfunction; or calorie: Increase nonprotein calorie:nitro-
nitrogen ratio imbalance. gen ratio.
Elevated Liver Underlying disease; lack of GI use; Attempt enteral feeding.
Function Tests or GI bacterial overgrowth.
Essential fatty acid deficiency. Provide lipid.
Excessive nutrients. Decrease PN.
Metabolic Acidosis Excessive GI or urinary losses Increase acetate provision.
of base.
Inadequate amount of base- Decrease chloride in formula or in-
producing substance in formula. crease acetate provision.
Osmotic Diuresis Failure to recognize initial Reduce infusion rate.
hyperglycemia and increased Give insulin to correct hyper-
glucose in urine. glycemia.
(continued )
ch16.qxd 8/14/2001 8:07 AM Page 1046
ALBUMIN
Albumin is compatible when admixed with PN formulas; however, its supply is
too limited and its cost is too prohibitive for casual use. Although inclusion of al-
bumin in PN is reported to rapidly increase serum albumin levels
40
and enhance
tolerance of enteral feedings,
41
the clinical benefits of such treatment are not
proved. For synthesis of endogenous protein, albumin is inferior to crystalline
AAs as a parenteral source of nitrogen. If administration of albumin is necessary,
it should not be included in the PN formula.
CARNITINE
Carnitine is a micronutrient that is vital to energy metabolism because of its role
in transporting long-chain fatty acids across the mitochondrial membrane. Certain
patients, such as those with chronic renal failure on dialysis and premature
neonates, are at increased risk of developing carnitine deficiency, especially if
they are receiving long-term PN.
42,43
L
-carnitine, the physiologically active form,
is available for IV administration as a 1 g/5 mL solution that is stable when added
to PN formulas.
44
Consult the carnitine product information for detailed usage in-
formation.
MEDICATIONS
There may be advantages to the admixture of certain medications such as antibi-
otics, chemotherapeutic agents, and H
2
-receptor antagonists to PN, if there is com-
patibility reported with all components of the formula. Consult other sources for
information regarding the stability and compatibility of medication/PN admix-
tures.
■ MONITORING THE PATIENT
Metabolic complications known to occur with enteral or parenteral nutrition are
summarized in Table 6–12. Most of these can be avoided by proper precautions
N
UTRITION
S
UPPORT
1047
TABLE 6–12. NUTRITION SUPPORT: METABOLIC COMPLICATIONS
AND MANAGEMENT (continued )
COMPLICATION FREQUENT CAUSES MANAGEMENT
Give 5% dextrose and 0.2% or
0.45% NaCl rather than PN solu-
tion to correct dehydration.
Continue to monitor blood glucose,
sodium, and potassium.
Essential Fatty Insufficient provision of Provide lipid.
Acid Deficiency fat during PN.
ch16.qxd 8/14/2001 8:07 AM Page 1047
and close monitoring of the patient. Laboratory parameters for patient monitoring
are summarized in Table 6–13.
1048 N
UTRITION
S
UPPORT
TABLE 6–13. ROUTINE PATIENT MONITORING PARAMETERS
PARAMETER FREQUENCY
a
Urinary glucose and specific gravity. Every voided specimen until stable, then daily.
Finger stick glucose. Every 6 hr until stable.
Vital signs, weight, intake, and output. Daily.
Serum glucose, electrolytes, creatinine, Daily until stable, then twice weekly.
and BUN
Magnesium, calcium, and phosphorus. Daily until stable, then once weekly.
CBC, hemoglobin, WBC, platelets, and Baseline, then weekly.
prothrombin time.
Serum protein, albumin, prealbumin, and Baseline, then weekly.
liver functions.
Serum cholesterol and triglycerides. Baseline, then weekly.
Blood ammonia. Baseline, then weekly in renal and hepatic
patients.
a
Frequency should be increased in critically ill patients.
■ FUTURE DEVELOPMENTS
Technologic advancements in nutrition formulas and the means of preparing, pro-
viding, and monitoring their effects on patients continue to be made. These modi-
fications enable safer and more cost-effective nutrition support of patients in the
hospital or at home.
Body composition research is presenting innovative approaches to metabolic
and nutrition assessments.
45
Formulas with specialized AA mixtures continue to
be investigated. The benefits of using BCAA-enriched formulas are reported for
patients with hepatic encephalopathy
46
or hypermetabolism
47
but remain unproved
in terms of morbidity and mortality. Recombinant human growth factors,
48
argi-
nine,
49
and glutamine
50
offer promise for their beneficial influences on protein
synthesis rates, immunocompetence, and intestinal mucosal barrier protection, re-
spectively.
In vitro and animal studies report an improvement in tissue protein synthesis
and reduction in hypermetabolic response with the enteral use of structured lipids
containing MCTs and omega-3 fish oil.
51,52
Because of difficulties reported with
the IV use of currently available LCT emulsions such as hepatic and pulmonary
complications and immunosuppression, alternate shorter-chain lipid preparations
have been investigated.
53
MCTs continue to be explored for IV use as an obligate
fuel and an important component of PN.
54
Animal studies with short-chain triglyc-
ch16.qxd 8/14/2001 8:07 AM Page 1048
erides such as triacetin show potential for better protein-sparing properties than
MCTs, with less toxicity.
53
Short-chain fatty acids also have been shown to be
beneficial in inhibiting small-bowel mucosal atrophy when infused IV or intra-
colonically.
55
New insights into the relationship between nutrition and immune function
are emerging through advances with recombinant monokines and new discoveries
concerning the involvement of interleukin-1 and tumor necrosis factor in energy
metabolism.
52,56
Although all of these are promising areas of research, they are not
considered standard therapy in nutrition support.
■ REFERENCES
1. Albina JE. Nutrition and wound healing. JPEN 1994;18:367–76.
2. Elwyn DH. Nutritional requirements of adult surgical patients. Crit Care Med 1980;8:9–19.
3. Grant JP et al. Current techniques of nutritional assessment. Surg Clin North Am 1981:61:437–63.
4. Blackburn GL et al. Nutritional and metabolic assessment of the hospitalized patient. JPEN 1977;1:11–22.
5. Traub SL, ed. Basic skills in interpreting laboratory data. Bethesda, MD: American Society of Hospital Phar-
macists; 1992.
6. Vanlandingham S et al. Prealbumin: a parameter of visceral protein levels during albumin infusion. JPEN 1982;
6:230–1.
7. Fletcher JP et al. A comparison of serum transferrin and serum prealbumin as nutritional parameters. JPEN
1987;11:144–7.
8. Bistrian BR. Recent advances in parenteral and enteral nutrition: a personal perspective. JPEN 1990;14:329–34.
9. Liggett SB, Renfro AD. Energy expenditures of mechanically ventilated nonsurgical patients. Chest 1990;98:
682–6.
10. Rutten P et al. Determination of optimal hyperalimentation infusion rate. J Surg Res 1975;18:477–83.
11. Rees RGP et al. Elemental diet administered nasogastrically without starter regimens to patients with inflamma-
tory bowel disease. JPEN 1986;10:258–62.
12. Payne-James JJ, Khawaja HT. First choice for total parenteral nutrition: the peripheral route. JPEN 1993;17:
468–78.
13. Solomon SM, Kirby DF. The refeeding syndrome: a review. JPEN 1990;14:90–7.
14. Food and Drug Administration. Safety alert: hazards of precipitation associated with parenteral nutrition. Am J
Hosp Pharm 1994;51:1427–8.
15. Barton RG. Nutrition support in critical illness. Nutr Clin Pract 1994;9:127–39.
16. Shizgal HM, Forse RA. Protein and calorie requirements with total parenteral nutrition. Ann Surg 1980;
192:562–9.
17. Barr LH et al. Essential fatty acid deficiency during total parenteral nutrition. Ann Surg 1981;193:304–11.
18. Mattox TW, Teasley-Strausberg KM. Overview of biochemical markers used for nutrition support. DICP 1991;
25:265–71.
19. Roulet M et al. Effects of intravenously infused egg phospholipids on lipid and lipoprotein metabolism in post-
operative trauma. JPEN 1993;17:107–12.
20. Crowe PJ et al. A new intravenous emulsion containing medium-chain triglyceride: studies of its metabolic ef-
fects in the perioperative period compared with a conventional long-chain triglyceride emulsion. JPEN
1985;9:720–4.
21. Driscoll DF et al. Practical considerations regarding the use of total nutrient admixtures. Am J Hosp Pharm
1986;43:416–9.
22. Pineault M et al. Beneficial effect of coinfusing a lipid emulsion on venous patency. JPEN 1989;13:637–40.
23. Hardin TC. Intravenous lipids—depression of the immune function: fact or fantasy? Hosp Pharm 1994;29:
182,185–6.
24. Guidelines for the use of parenteral and enteral nutrition in adult and pediatric patients. American Society for
Parenteral and Enteral Nutrition. JPEN 1993;17(4 suppl):1SA–52SA.
25. Humbestone DA et al. Relative importance of amino acid infusion as a means of sparing protein in surgical
patients. JPEN 1989;13:223–7.
26. Freund H et al. Infusion of branched-chain enriched amino acid solution in patients with hepatic encephalopa-
thy. Ann Surg 1982;196:209–20.
27. Freund H et al. Infusion of the branched-chain amino acids in postoperative patients: anticatabolic properties.
Ann Surg 1979;190:18–23.
N
UTRITION
S
UPPORT
1049
ch16.qxd 8/14/2001 8:07 AM Page 1049
28. Cerra FB et al. Branched-chains support postoperative protein synthesis. Surgery 1982;92:192–9.
29. Heird WC et al. Pediatric parenteral amino acid mixture in low birth weight infants. Pediatrics 1988;81:41–50.
30. Baumgartner T, ed. Clinical guide to parenteral nutrition. 3rd ed. Deerfield, IL: Fujisawa, Inc; 1997.
31. American Medical Association Department of Foods and Nutrition. Guidelines for essential trace element prepa-
rations for parenteral use: a statement by an expert panel. JAMA 1979;241:2051–4.
32. Lane HW et al. The effect of selenium supplementation on selenium status of patients receiving chronic total
parenteral nutrition. JPEN 1987;11:177–82.
33. Abumrad NN et al. Amino acid intolerance during prolonged total parenteral nutrition reversed by molybdate
therapy. Am J Clin Nutr 1981;34:2551–9.
34. Shils ME, Jacobs DH. Plasma iodide levels and thyroid function studies in long term home TPN patients. Am J
Clin Nutr 1983;37:731. Abstract.
35. Greene HL et al. Guidelines for the use of vitamins, trace elements, calcium, magnesium, and phosphorus in in-
fants and children receiving total parenteral nutrition: report of the Subcommittee on Pediatric Parenteral Nutri-
ent Requirements from the Committee on Clinical Practice Issues of the American Society for Clinical Nutri-
tion. Am J Clin Nutr 1988;48:1324–42.
36. Norton JA et al. Iron supplementation of total parenteral nutrition: a prospective study. JPEN 1983;7:457–61.
37. Shizgal HM, Posner B. Insulin and the efficacy of total parenteral nutrition. Am J Clin Nutr 1989;50:1355–63.
38. Rothkopf MM et al. Nutritional support in respiratory failure. Nutr Clin Pract 1989;4:166–72.
39. Sajbel TA et al. Use of separate insulin infusions with total parenteral nutrition. JPEN 1987;11:97–9.
40. Brown RO et al. Response of serum albumin concentrations to albumin supplementation during central total par-
enteral nutrition. Clin Pharm 1987;6:222–6.
41. Andrassy RJ, Durr ED. Albumin: use in nutrition and support. Nutr Clin Pract 1988;3:226–9.
42. Wolk R. Micronutrition in dialysis. Nutr Clin Pract 1993;8:267–76.
43. Bonner CM et al. Effects of parenteral L-carnitine supplementation on fat metabolism and nutrition in premature
neonates. J Pediatr 1995;126:287–92.
44. Borum PR. Is L-carnitine stable in parenteral nutrition solutions prepared for preterm neonates? Neonatal Intens
Care 1993;Sept/Oct:30–2.
45. Heymsfield SB, Matthews D. Body composition: research and clinical advances—1993 ASPEN research work-
shop. JPEN 1994;18:91–103.
46. Alexander WF et al. The usefulness of branched chain amino acids in patients with acute or chronic hepatic
encephalopathy. Am J Gastroenterol 1989;84:91–6.
47. Teasley KM, Buss RL. Do parenteral nutrition solutions with high concentrations of branched-chain amino acids
offer significant benefits to stressed patients? DICP 1989;23:411–6.
48. Hatton J et al. Growth factors in nutritional support. Pharmacotherapy 1993;13:17–27.
49. Daly JM et al. Immune and metabolic effects of arginine in the surgical patient. Ann Surg 1998;208:512–23.
50. Li J et al. Glycyl-L-glutamine–enriched total parenteral nutrition maintains small intestine gut-associated lym-
phoid tissue and upper respiratory tract immunity. JPEN 1998;22:31–6.
51. Teo TC et al. Administration of structured lipid composed of MCT and fish oil reduces net protein catabolism in
enterally fed burned rats. Ann Surg 1989;210:100–6.
52. Endres S. The effect of dietary supplementation with n-3 polyunsaturated fatty acids on the synthesis of inter-
leukin-1 and tumor necrosis factor by mononuclear cells. N Engl J Med 1989;320:265–71.
53. Bailey JW et al. Triacetin: a potential parenteral nutrient. JPEN 1991;15:32–6.
54. Mascioli EA et al. Thermogenesis from intravenous medium-chain triglycerides. JPEN 1991;15:27–31.
55. Koruda MJ et al. Parenteral nutrition supplemented with short-chain fatty acids: effect on the small-bowel
mucosa in normal rats. Am J Clin Nutr 1990;51:685–9.
56. Pomposelli JJ et al. Role of biochemical mediators in clinical nutrition and surgical metabolism. JPEN
1988;12:212–8.
1050 N
UTRITION
S
UPPORT
ch16.qxd 8/14/2001 8:07 AM Page 1050
/Appendices
• Conversion Factors
• Anthropometrics
• Laboratory Indices
• Drug–Laboratory Test Interferences
• Pharmacokinetic Equations
PART III
Appendices
Principal Editor: William G. Troutman, PharmD
Appx.qxd 8/13/2001 3:38 PM Page 1051
■ SI UNITS
SI units (le Système International d’Unités) are being introduced in the United
States to express clinical laboratory and serum drug concentration data. Instead of
employing units of mass (such as micrograms), the SI system uses moles (mol) to
represent the amount of a substance. A molar solution contains 1 mole (the molec-
ular weight of the substance in grams) of the solute in 1 liter of solution. The fol-
lowing formula is used to convert units of mass to moles (µg/mL to µmol/L or, by
substitution of terms, mg/mL to mmol/L or ng/mL to nmol/L).
Micromoles per Liter (mol/L)
Drug concentration (µg/mL) × 1000
µmol/L =
Molecular weight of drug (g/mol)
■ MILLIEQUIVALENTS
An equivalent weight of a substance is that weight which will combine with or re-
place 1 g of hydrogen; a milliequivalent is 1/1000 of an equivalent weight.
Milliequivalents per Liter (mEq/L)
Weight of salt (g) × Valence of ion × 1000
mEq/L =
Molecular weight of salt
mEq/L × Molecular weight of salt
Weight of salt (g) =
Valence of ion × 1000
APPROXIMATE MILLIEQUIVALENTS—WEIGHTS OF SELECTED IONS
SALT mEq/g SALT mg SALT/mEq
Calcium Carbonate (CaCO
3
) 20.0 50.0
Calcium Chloride (CaCl
2
ؒ 2H
2
O) 13.6 73.5
Calcium Gluceptate (Ca[C
7
H
13
O
8
]
2
) 4.1 245.2
Calcium Gluconate (Ca[C
6
H
11
O
7
]
2
ؒ H
2
O) 4.5 224.1
Calcium Lactate (Ca[C
3
H
5
O
3
]
2
ؒ 5H
2
O) 6.5 154.1
Magnesium Gluconate (Mg[C
6
H
11
O
7
]
2
ؒ H
2
O) 4.6 216.3
Magnesium Oxide (MgO) 49.6 20.2
(continued)
1053
Conversion Factors
1
Appx.qxd 8/13/2001 3:38 PM Page 1053
■ ANION GAP
The anion gap is the concentration of plasma anions not routinely measured by
laboratory screening. It is useful in the evaluation of acid–base disorders. The
anion gap is greater with increased plasma concentrations of endogenous (eg,
phosphate, sulfate, lactate, ketoacids) or exogenous (eg, salicylate, penicillin, eth-
ylene glycol, ethanol, methanol) species. The formulas for calculating the anion
gap follow:
1054 A
PPENDICES
APPROXIMATE MILLIEQUIVALENTS—WEIGHTS OF SELECTED IONS (continued )
SALT mEq/g SALT mg SALT/mEq
Magnesium Sulfate (MgSO
4
) 16.6 60.2
Magnesium Sulfate (MgSO
4
ؒ 7H
2
O) 8.1 123.2
Potassium Acetate (K[C
2
H
3
O
2
]) 10.2 98.1
Potassium Chloride (KCl) 13.4 74.6
Potassium Citrate (K
3
[C
6
H
5
O
7
] ؒ H
2
O) 9.2 108.1
Potassium Iodide (KI) 6.0 166.0
Sodium Acetate (Na[C
2
H
3
O
2
]) 12.2 82.0
Sodium Acetate (Na[C
2
H
3
O
2
] ؒ 3H
2
O) 7.3 136.1
Sodium Bicarbonate (NaHCO
3
) 11.9 84.0
Sodium Chloride (NaCl) 17.1 58.4
Sodium Citrate (Na
3
[C
6
H
5
O
7
] ؒ 2H
2
O) 10.2 98.0
Sodium Iodide (NaI) 6.7 149.9
Sodium Lactate (Na[C
3
H
5
O
3
]) 8.9 112.1
Zinc Sulfate (ZnSO
4
ؒ 7H
2
O) 7.0 143.8
VALENCES AND ATOMIC WEIGHTS OF SELECTED IONS
SUBSTANCE ELECTROLYTE VALENCE MOLECULAR WEIGHT
Calcium Ca
++
2 40.1
Chloride Cl
–
1 35.5
Magnesium Mg
++
2 24.3
Phosphate HPO
=
4
(80%) 1.8 96.0*
(pH = 7.4) H
2
PO
−
4
(20%)
Potassium K
+
1 39.1
Sodium Na
+
1 23.0
Sulfate SO
=
4
2 96.0*
*
The molecular weight of phosphorus only is 31; that of sulfur only is 32.1.
Appx.qxd 8/13/2001 3:38 PM Page 1054
(A) Anion Gap = (Na
+
+ K
+
) − (Cl
−
+ HCO
−
3
)
or
(B) Anion Gap = Na
+
− (Cl
−
+ HCO
−
3
)
where
the expected normal value for A is 11–20 mmol/L;
the expected normal value for B is 7–16 mmol/L.*
*Note that there is variation at the upper and lower limits of the normal range.
■ TEMPERATURE
Fahrenheit to Centigrade: (°F − 32) × 5/9 = °C
Centigrade to Fahrenheit: (°C × 9/5) + 32 = °F
Centigrade to Kelvin: °C + 273 = °K
■ WEIGHTS AND MEASURES
Metric Weight Equivalents
1 kilogram (kg) = 1000 grams
1 gram (g) = 1000 milligrams
1 milligram (mg) = 0.001 gram
1 microgram (mcg, g) = 0.001 milligram
1 nanogram (ng) = 0.001 microgram
1 picogram (pg) = 0.001 nanogram
1 femtogram (fg) = 0.001 picogram
Metric Volume Equivalents
1 liter (L) = 1000 milliliters
1 deciliter (dL) = 100 milliliters
1 milliliter (mL) = 0.001 liter
1 microliter (L) = 0.001 milliliter
1 nanoliter (nL) = 0.001 microliter
1 picoliter (pL) = 0.001 nanoliter
1 femtoliter (fL) = 0.001 picoliter
Apothecary Weight Equivalents
1 scruple (∋) = 20 grains (gr)
60 grains (gr) = 1 dram (D)
8 drams (D) = 1 ounce (O)
1 ounce (O) = 480 grains
12 ounces (O) = 1 pound (lb)
C
ONVERSION
F
ACTORS
1055
Appx.qxd 8/13/2001 3:38 PM Page 1055
Apothecary Volume Equivalents
60 minims (M) = 1 fluidram (fl D)
8 fluidrams (fl D) = 1 fluid ounce (fl O)
1 fluid ounce (fl O) = 480 minims
16 fluid ounces (fl O) = 1 pint (pt)
Avoirdupois Equivalents
1 ounce (oz) = 437.5 grains
16 ounces (oz) = 1 pound (lb)
Weight/Volume Equivalents
1 mg/dL = 10 µg/mL
1 mg/dL = 1 mg%
1 ppm = 1 mg/L
Conversion Equivalents
1 gram (g) = 15.43 grains
1 grain (gr) = 64.8 milligrams
1 ounce (O) = 31.1 grams
1 ounce (oz) = 28.35 grams
1 pound (lb) = 453.6 grams
1 kilogram (kg) = 2.2 pounds
1 milliliter (mL) = 16.23 minims
1 minim (M) = 0.06 milliliter
1 fluid ounce (fl oz) = 29.57 mL
1 pint (pt) = 473.2 mL
0.1 mg = 1/600 gr
0.12 mg = 1/500 gr
0.15 mg = 1/400 gr
0.2 mg = 1/300 gr
0.3 mg = 1/200 gr
0.4 mg = 1/150 gr
0.5 mg = 1/120 gr
0.6 mg = 1/100 gr
0.8 mg = 1/80 gr
1 mg = 1/65 gr
1056 A
PPENDICES
Appx.qxd 8/13/2001 3:38 PM Page 1056
1057
2
■ CREATININE CLEARANCE FORMULAS
FORMULAS FOR ESTIMATING CREATININE CLEARANCE
IN PATIENTS WITH STABLE RENAL FUNCTION
Adults [Age 18 Years and Older]
1
(140 − Age) × (Weight)
Cl
cr
(Males) =
Cr
s
× 72
Cl
cr
(Females) = 0.85 × Above value*
where
Cl
cr
= creatinine clearance in mL/min
Cr
s
= serum creatinine in mg/dL
Age is in years
Weight is in kg.
*Some studies suggest that the predictive accuracy of this formula for women is better without the
correction factor of 0.85.
Children [Age 1–18 Years]
2
0.48 × (Height) × (BSA)
Cl
cr
=
Cr
s
× 1.73
where
BSA = body surface area in m
2
Cl
cr
= creatinine clearance in mL/min
Cr
s
= serum creatinine in mg/dL
Height is in cm.
FORMULA FOR ESTIMATING CREATININE CLEARANCE
FROM A MEASURED URINE COLLECTION
U × V*
Cl
cr
(mL/min) =
P × t
where
U = concentration of creatinine in a urine specimen (in same units as P)
V = volume of urine in mL
1057
Anthropometrics
Appx.qxd 8/13/2001 3:38 PM Page 1057
P = concentration of creatinine in serum at the midpoint of the urine collection
period (in same units as U)
t = time of the urine collection period in minutes (eg, 6 hr = 360 min; 24 hr = 1440
min).
*The product of U × V equals the production of creatinine during the collection period and, at steady
state, should equal 20–25 mg/kg/day ideal body weight (IBW) in males and 15–20 mg/kg/day IBW in
females. If it is less than this, inadequate urine collection may have occurred and Cl
cr
will be under-
estimated.
■ IDEAL BODY WEIGHT
IBW is the weight expected for a nonobese person of a given height. The IBW
formulas below and various life insurance tables can be used to estimate IBW.
Most dosing methods described in the literature use IBW as a method in dosing
obese patients.
Adults [Age 18 years and Older]
3
IBW (Males) = 50 + (2.3 × Height in inches over 5 feet)
IBW (Females) = 45.5 + (2.3 × Height in inches over 5 feet)
where IBW is in kg.
Children [Age 1–18 Years]
2
Under 5 Feet Tall:
(Height
2
× 1.65)
IBW =
1000
where
IBW is in kg;
Height is in cm.
5 Feet or Taller:
IBW (Males) = 39 + (2.27 × Height in inches over 5 feet)
IBW (Females) = 42.2 + (2.27 × Height in inches over 5 feet)
where IBW is in kg;
■ SURFACE AREA NOMOGRAMS
Nomograms represent the relationship between height, weight, and body surface
area in infants and adults. To use a nomogram, a ruler is aligned with the height
and weight on the two lateral axes. The point at which the centerline is intersected
provides the corresponding value for body surface area.
1058 A
PPENDICES
Appx.qxd 8/13/2001 3:38 PM Page 1058
NOMOGRAM FOR DETERMINATION OF BODY SURFACE AREA
FROM HEIGHT AND WEIGHT (INFANTS)
4
A
NTHROPOMETRICS
1059
SA = W
0.5378
× H
0.3964
× 0.024265
where
SA is in m
2
Height (H) is in cm
Weight (W) is in kg.
Reproduced from reference 4, with permission.
Appx.qxd 8/13/2001 3:38 PM Page 1059
1060 A
PPENDICES
NOMOGRAM FOR DETERMINATION OF BODY SURFACE AREA
FROM HEIGHT AND WEIGHT (ADULTS)
5
SA = W
0.425
× H
0.725
× 71.84
where
SA is in m
2
Height (H) is in cm
Weight (W) is in kg.
Reproduced from reference 5, with permission.
REFERENCES
1. Cockcroft DW, Gault MH. Prediction of creatinine clearance from serum creatinine. Nephron 1976;16:31–41.
2. Traub SL, Johnson CE. Comparison of methods of estimating creatinine clearance in children. Am J Hosp Pharm
1980;37:195–201.
3. Devine BJ. Gentamicin therapy. Drug Intell Clin Pharm 1974;8:650–5.
4. Haycock GB et al. Geometric method for measuring body surface area: a height–weight formula validated in
infants, children, and adults. J Pediatr 1978;93:62–6.
5. DuBois and DuBois. Arch Intern Med 1916;17:863.
Appx.qxd 8/13/2001 3:38 PM Page 1060
1061
3
The following table lists typical reference ranges for clinical laboratory tests in
common use. Reference ranges for laboratory tests can vary widely among testing
facilities, often as a result of methodologic differences. It is therefore always ad-
visable to obtain reference ranges from the laboratory performing the analyses.
Laboratory test results should never be accepted without correct identification of
the units of measurement because most tests can be reported in several systems of
measurement. The table presents conventional and international (usually the same
as Système International, or SI) units.
The following abbreviations are used to identify the specimen:
(P) — Plasma
(S) — Serum
(U) — Urine
(WB) — Whole Blood
(WB, art) — Whole Blood, Arterial
The table begins on page 1062.
Blood, Serum, Plasma Chemistry; Urine,
Renal Function Tests; Hematology
William G. Troutman
1061
Laboratory Indices
Appx.qxd 8/13/2001 3:38 PM Page 1061
BLOOD, SERUM, PLASMA CHEMISTRY
AGE GROUP OR
REFERENCE RANGE
TEST/SPECIMEN OTHER FACTOR Conventional International Units
Acid Phosphatase (S) 0.11–0.60 units/L 0.11–0.60 units/L
Alanine Aminotransferase (S) units/L units/L
(ALT, SGPT) Adult 8–20 8–20
>60 yr, M 7–24 7–24
>60 yr, F 7–16 7–16
Alkaline Phosphatase (S) units/L units/L
Child 20–150 20–150
Adult 20–70 20–70
>60 yr 30–75 30–75
Ammonia Nitrogen (S,P) Adult 15–45 mg/dL 11–32 µmol/L
Amylase (S) units/L units/L
Adult 25–125 25–125
>70 yr 20–160 20–160
Anion Gap (Na
+
2 [Cl
−
+ HCO
3
−
]) (P) 7–16 mEq/L 7–16 mmol/L
Aspartate Aminotransferase (S) units/L units/L
(AST, SGOT) Adult 8–20 8–20
>60 yr, M 11–26 11–26
>60 yr, F 10–20 10–20
Bicarbonate (S) mEq/L mmol/L
Arterial 21–28 21–28
Venous 22–29 22–29
(WB, art) Adult 18–23 18–23
Bilirubin (S) mg/dL mmol/L
Total Child, Adult 0.2–1.0 3.4–17.1
Conjugated (direct) Child, Adult 0–0.2 0–3.4
Calcium (S) mg/dL mmol/L
Ionized Adult 4.48–4.92 1.12–1.23
Total Child 8.8–10.8 2.20–2.70
Adult 8.4–10.2 2.10–2.55
Carbon Dioxide, Partial Pressure (WB, art) mm Hg kPa
(pCO
2
) Adult, M 35–48 4.66–6.38
Adult, F 32–45 4.26–5.99
Chloride (S,P) 98–107 mEq/L 98–107 mmol/L
1062 A
PPENDICES
(continued)
Appx.qxd 8/13/2001 3:38 PM Page 1062
BLOOD, SERUM, PLASMA CHEMISTRY (continued )
AGE GROUP OR
REFERENCE RANGE
TEST/SPECIMEN OTHER FACTOR Conventional International Units
Cholesterol, Total (S,P) mg/dL mmol/L
Child 120–200 3.11–5.18
Adolescent 120–210 3.11–5.44
Adult 140–310 3.63–8.03
Desired, Adult <200 <2.6
Cortisol (S,P) µg/dL nmol/L
08:00 hr 5–23 138–635
16:00 hr 3–15 83–414
20:00 hr ≤50% of 08:00 hr ≤50% of 08:00 hr
Creatine Kinase (CK) (S) units/L units/L
Adult, M 38–174 38–174
Adult, F 26–140 26–140
Creatinine (S,P) mg/dL µmol/L
Child 0.3–0.7 27–62
Adolescent 0.5–1.0 44–88
Adult, M 0.7–1.3 62–115
Adult, F 0.6–1.1 53–97
(␥)-Glutamyltransferase (S) units/L units/L
(GGT) Adult, M 9–50 9–50
Adult, F 8–40 8–40
Glucose, 2-hr Postprandial (S) <120 mg/dL <6.7 mmol/L
Glucose Tolerance Test (S) mg/dL mmol/L
(Oral) Normal Diabetic Normal Diabetic
Fasting 70–105 Ͼ140 3.9–5.8 Ͼ7.8
60 min 120–170 Ն200 6.7–9.4 ≥11.1
90 min 100–140 Ն200 5.6–7.8 ≥11.1
120 min 70–120 Ն140 3.9–6.7 ≥7.8
HDL-Cholesterol (S,P) mg/dL mmol/L
15–19 yr, M 30–65 0.78–1.68
15–19 yr, F 30–70 0.78–1.81
20–29 yr, M 30–70 0.78–1.81
20–29 yr, F 30–75 0.78–1.94
30–39 yr, M 30–70 0.78–1.81
30–39 yr, F 30–80 0.78–2.07
L
ABORATORY
I
NDICES
1063
(continued)
Appx.qxd 8/13/2001 3:38 PM Page 1063
BLOOD, SERUM, PLASMA CHEMISTRY (continued )
AGE GROUP OR
REFERENCE RANGE
TEST/SPECIMEN OTHER FACTOR Conventional International Units
>40 yr, M 30–70 0.78–1.81
>40 yr, F 30–85 0.78–2.20
Iron (S) µg/dL mmol/L
Child 50–120 8.95–21.48
Adult, M 65–170 11.64–30.43
Adult, F 50–170 8.95–30.43
Iron-Binding Capacity, Total (S) 250–450 µg/dL 44.75–80.55 µmol/L
(TIBC)
Isocitrate Dehydrogenase (S) 1.2–7.0 units/L 1.2–7.0 units/L
Lactate Dehydrogenase (S) units/L units/L
Child 60–170 60–170
Adult 100–190 100–190
>60 yr 110–210 110–210
Isozymes (S) % of Total Fraction of Total
Fraction 1 14–26 0.14–0.26
Fraction 2 29–39 0.29–0.39
Fraction 3 20–26 0.20–0.26
Fraction 4 8–16 0.08–0.16
Fraction 5 6–16 0.06–0.16
Lead (WB) µg/dL µmol/L
Child <15 <0.72
Adult <30 <1.45
Lipase (S) units/L units/L
Adult 10–150 10–150
>60 yr 18–180 18–180
-Lipoprotein (LDL) (S) 28–53% of total lipoproteins. 0.28–0.53
Magnesium (S) mEq/L mmol/L
6–12 yr 1.7–2.1 0.70–0.86
12–20 yr 1.7–2.2 0.70–0.91
Adult 1.6–2.6 0.66–1.07
Osmolality (S) mOsmol/kg mOsmol/kg
Child, Adult 275–295 275–295
>60 yr 280–301 280–301
1064 A
PPENDICES
(continued)
Appx.qxd 8/13/2001 3:38 PM Page 1064