Insulin Action and Its Disturbances in Disease - part 6 pps
Bạn đang xem bản rút gọn của tài liệu. Xem và tải ngay bản đầy đủ của tài liệu tại đây (624.89 KB, 62 trang )
294 ADIPOKINES AND INSULIN RESISTANCE
225. Hu, E., Liang, P. and Spiegelman, B. M. (1996) AdipoQ is a novel adipose-specific
gene dysregulated in obesity. JBiolChem271 (18), 10 697–10 703.
226. Matsubara, M., Maruoka, S. and Katayose, S. (2002) Inverse relationship between
plasma adiponectin and leptin concentrations in normal-weight and obese women. Eur
J Endocrinol 147 (2), 173–180.
227. Milan, G., Granzotto, M., Scarda, A., Calcagno, A., Pagano, C., Federspil, G. and Vet-
tor, R. (2002) Resistin and adiponectin expression in visceral fat of obese rats: effect
of weight loss. Obes Res 10 (11), 1095–1103.
228. Stefan, N., Bunt, J. C., Salbe, A. D., Funahashi, T., Matsuzawa, Y. and Tataranni, P. A.
(2002) Plasma adiponectin concentrations in children: relationships with obesity and
insulinemia. J Clin Endocrinol Metab 87 (10), 4652–4656.
229. Yang, W. S., Lee, W. J., Funahashi, T., Tanaka, S., Matsuzawa, Y., Chao, C. L., Chen,
C. L., Tai, T. Y. and Chuang, L. M. (2002) Plasma adiponectin levels in overweight
and obese Asians. Obes Res 10 (11), 1104–1110.
230. Yamauchi, T., Kamon, J., Waki, H., Murakami, K., Motojima, K., Komeda, K., Ide, T.,
Kubota, N., Terauchi, Y., Tobe, K., Miki, H., Tsuchida, A., Akanuma, Y., Nagai, R., Ki-
mura, S. and Kadowaki, T. (2001) The mechanisms by which both heterozygous peroxi-
some proliferator-activated receptor gamma (PPARgamma) deficiency and PPARgamma
agonist improve insulin resistance. JBiolChem276 (44), 41 245–41 254.
231. Combs, T. P., Wagner, J. A., Berger, J., Doebber, T., Wang, W. J., Zhang, B. B.,
Tanen, M., Berg, A. H., O’Rahilly, S., Savage, D. B., Chatterjee, K., Weiss, S.,
Larson, P. J., Gottesdiener, K. M., Gertz, B. J., Charron, M. J., Scherer, P. E. and
Moller, D. E. (2002) Induction of adipocyte complement-related protein of 30
kilodaltons by PPARgamma agonists: a potential mechanism of insulin sensitization.
Endocrinology 143 (3), 998–1007.
232. Hirose, H., Kawai, T., Yamamoto, Y., Taniyama, M., Tomita, M., Matsubara, K., Oka-
zaki, Y., Ishii, T., Oguma, Y., Takei, I. and Saruta, T. (2002) Effects of pioglitazone on
metabolic parameters, body fat distribution, and serum adiponectin levels in Japanese
male patients with type 2 diabetes. Metabolism 51 (3), 314–317.
233. Gustafson, B., Jack, M. M., Cushman, S. W. and Smith, U. (2003) Adiponectin gene
activation by thiazolidinediones requires PPARgamma2, but not C/EBPalpha-evidence
for differential regulation of the aP2 and adiponectin genes. Biochem Biophys Res
Commun 308 (4), 933–939.
234. Maeda, N., Shimomura, I., Kishida, K., Nishizawa, H., Matsuda, M., Nagaretani, H.,
Furuyama, N., Kondo, H., Takahashi, M., Arita, Y., Komuro, R., Ouchi, N., Kihara, S.,
Tochino, Y., Okutomi, K., Horie, M., Takeda, S., Aoyama, T., Funahashi, T. and Mat-
suzawa, Y. (2002) Diet-induced insulin resistance in mice lacking adiponectin/ACRP30.
Nat Med 8 (7), 731–737.
235. Pajvani, U. B. and Scherer, P. E. (2003) Adiponectin: systemic contributor to insulin
sensitivity. Curr Diab Rep 3 (3), 207–213.
236. Masaki, T., Chiba, S., Yasuda, T., Tsubone, T., Kakuma, T., Shimomura, I., Funahashi,
T., Matsuzawa, Y. and Yoshimatsu, H. (2003) Peripheral, but not central, administration
of adiponectin reduces visceral adiposity and upregulates the expression of uncoupling
protein in Agouti yellow (A(y)/a) obese mice. Diabetes 52 (9), 2266–2273.
237. Tschritter, O., Fritsche, A., Thamer, C., Haap, M., Shirkavand, F., Rahe, S., Staiger, H.,
Maerker, E., Haring, H. and Stumvoll, M. (2003) Plasma adiponectin concentrations
predict insulin sensitivity of both glucose and lipid metabolism. Diabetes 52 (2),
239–243.
238. Combs, T. P., Berg, A. H., Obici, S., Scherer, P. E. and Rossetti, L. (2001) Endoge-
nous glucose production is inhibited by the adipose-derived protein Acrp30. J Clin
Invest 108 (12), 1875–1881.
REFERENCES 295
239. Fruebis, J., Tsao, T. S., Javorschi, S., Ebbets-Reed, D., Erickson, M. R., Yen, F. T.,
Bihain, B. E. and Lodish, H. F. (2001) Proteolytic cleavage product of 30-kDa adipo-
cyte complement-related protein increases fatty acid oxidation in muscle and causes
weight loss in mice. Proc Natl Acad Sci USA 98 (4), 2005–2010.
240. Yamauchi, T., Kamon, J., Waki, H., Imai, Y., Shimozawa, N., Hioki, K., Uchida, S.,
Ito, Y., Matsui, J., Eto, K., Komeda, K., Tsunoda, M., Murakami, K., Ohnishi, Y.,
Yamamura, K., Ueyama, Y., Froguel, P., Kimura, S., Nagai, R. and Kadowaki, T. (2002)
Globular adiponectin protected ob/ob mice from diabetes and apoE deficient mice from
atherosclerosis. JBiolChem.
241. Xu, A., Wang, Y., Keshaw, H., Xu, L. Y., Lam, K. S. and Cooper, G. J. (2003) The
fat-derived hormone adiponectin alleviates alcoholic and nonalcoholic fatty liver dis-
eases in mice. J Clin Invest 112 (1), 91–100.
242. Berg, A. H., Combs, T. P., Du, X., Brownlee, M. and Scherer, P. E. (2001) The adipo-
cyte-secreted protein Acrp30 enhances hepatic insulin action. Nat Med 7 (8), 947–953.
243. Yamauchi, T., Kamon, J., Minokoshi, Y., Ito, Y., Waki, H., Uchida, S., Yamashita, S.,
Noda, M., Kita, S., Ueki, K., Eto, K., Akanuma, Y., Froguel, P., Foufelle, F., Ferre, P.,
Carling, D., Kimura, S., Nagai, R., Kahn, B. B. and Kadowaki, T. (2002) Adiponectin
stimulates glucose utilization and fatty-acid oxidation by activating AMP-activated pro-
tein kinase. Nat Med 8 (11), 1288–1295.
11
Dietary Factors and Insulin
Resistance
Jeremy Krebs and Susan Jebb
11.1 Introduction
Diet is a critical determinant of the risk of many metabolic diseases. However,
while the role of dietary factors in the aetiology of cardiovascular disease and
cancer has been extensively explored, less consideration has been given to the
development of insulin resistance and diabetes. Recently the global epidemic of
type 2 diabetes, following in the wake of the increase in obesity, has focussed
attention in this area. There is renewed interest in both the role of dietary factors
as a contributor to obesity and the impact of specific dietary constituents on
insulin resistance, independent of weight. Putative candidates include each of
the macronutrients together with specific micronutrients. However, progress in
understanding the relationship between diet and insulin resistance is hampered
by the complexity of the relationship, which is difficult to isolate from factors
such as genetic background, or other environmental factors such as physical
activity. Indeed, there are likely to be complex inter-relationships between these
factors, including gene–nutrient–environment interactions.
Epidemiological analyses of the problem are hampered by the difficulties
in making accurate measurements of exposure (dietary intake) and outcome
(insulin resistance). Assessment of habitual diet is notoriously flawed, with a
bias towards under-reporting, that is unlikely to apply equally across all foods
or nutrients.
1, 2
A variety of methods are used to assess insulin resistance, each
offering a slightly different perspective on this metabolic disturbance, including
fasting insulin concentration, combinations of fasting insulin and glucose such
as the homeostasis model assessment (HOMA) and area under the insulin curve
Insulin Resistance. Edited by Sudhesh Kumar and Stephen O’Rahilly
2005 John Wiley & Sons, Ltd ISBN: 0-470-85008-6
298 DIETARY FACTORS AND INSULIN RESISTANCE
during an OGTT. In some cases the occurrence of impaired glucose tolerance
may be used as a surrogate, albeit very loose, marker of insulin resistance. More
sophisticated methods of determining insulin sensitivity such as the intravenous
glucose tolerance test with minimal modelling or the hyperinsulinaemic eug-
lycaemic clamp are the ‘gold standards’ but are invasive, costly and largely
confined to experimental studies. Together the measurement errors in diet and
insulin resistance incurred in most epidemiological studies make the interpreta-
tion of cross-sectional associations particularly challenging.
Testing epidemiological hypotheses in controlled intervention studies has also
proved difficult because habitual background diet, physical activity and body
composition have important modulating effects on the impact of specific dietary
factors on insulin resistance. It is difficult to alter one dietary factor independent
of other components of the diet, and short term interventions may not appro-
priately reflect a lifetime’s exposure. Thus in many situations it is necessary to
study the precise mechanism of action of a nutrient at a cellular or tissue level
in order to shed light on its potential role in whole body insulin resistance. This
chapter draws on evidence from diverse sources to consider the role of dietary
factors in the aetiology of insulin resistance and thus offers a foundation for the
development of dietary strategies to prevent or reduce insulin resistance.
11.2 The importance of body fatness
Body mass index (BMI) is a strong predictor of the risk of developing type
2 diabetes.
3, 4
The association is particularly marked for more specific mea-
sures of body fatness, especially abdominal fat.
5
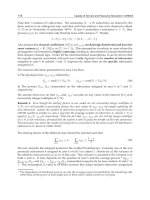
Adult weight gain increases
the risk further (Figure 11.1). More detailed experimental studies using a eugly-
caemic clamp have confirmed that weight gain is associated with a deterioration
in insulin sensitivity in overweight and obese individuals with either normal
or impaired glucose tolerance.
6
The exact mechanism for the link between
Weight at 21 year
0
5
10
15
20
25
Relative risk
Weight gain since 21 year
>11 5–10 <5
<22
22–23
>24
Figure 11.1 Impact of BMI and weight change on the risk of developing diabetes in men
(data from reference 3)
THE IMPORTANCE OF BODY FATNESS 299
increased fatness and insulin resistance remains unclear, but there is growing
evidence of signalling between adipose tissue and insulin-sensitive organs –
particularly liver and skeletal muscle – which in part regulates the insulin sensi-
tivity of these organs. Potential candidates for this signal include circulating free
fatty acids, adipokines such as Acrp30, IL-6, TNFα, leptin or resistin or some
other as yet unidentified agent.
7
These are discussed in detail in Chapter 10.
However, it is apparent that normally functioning adipose tissue is required
for normal whole body insulin sensitivity. This is highlighted by syndromes of
lipodystrophy where the relative absence of adipose tissue is also associated
with insulin resistance.
8
Body weight is the integrated product of a lifetime’s dietary intake, offset by
energy needs. An excess of energy intake over expenditure over a prolonged
period of time leads to increases in body fat and ultimately, if unchecked, in
obesity. Although this fundamental principle of energy balance lies at the heart
of the aetiology of obesity, it oversimplifies the complex inter-relationships
between genetic factors, lifestyle, cultural issues and behavioural patterns that
all contribute to the risk of an individual becoming overweight.
9, 10
Whilst
a detailed discussion of the aetiology of obesity is beyond the scope of this
chapter, it is important to remember that dietary factors that impact upon the
risk of obesity will, in turn, increase the risk of developing insulin resistance.
Epidemiological analyses of the relationship between fat intake and obesity
are inconsistent, although the trend suggests that a high fat diet is linked to
an increased risk of excess weight.
11, 12
However, such studies are confounded
by errors in dietary reporting and post hoc changes in consumption among
obese individuals. More detailed experimental studies demonstrate that subjects
allowed to eat ad libitum from diets of varying fat content consume more energy
on high fat foods.
13
However, this high fat hyperphagia is abolished when the
energy density is equalized.
14
Low fat, low energy-dense diets that are associ-
ated with a reduction in total energy intake lead to modest weight losses and
associated improvements in insulin sensitivity.
15
Fruit and vegetables can help to
reduce the energy density of the diet, although specific evidence of a protective
role for these foods in the aetiology of obesity is lacking.
Data from diverse sources implies an adverse effect of sugar rich soft drinks.
Consumption of soft drinks among children and young people has increased
markedly over the last 20 years, coinciding with the rapid rise in obesity in devel-
oped countries. These have a low energy density, due to their high water content,
but their low viscosity reduces their impact on innate satiety signals.
16
Thus
consumption of these drinks tends to supplement rather than substitute for food
energy, increasing the risk of excessive energy intakes.
17
A 10 week intervention
study showed consumption of sugar rich beverages was associated with signif-
icant weight gain relative to artificially sweetened varieties.
18
The role of other
specific carbohydrate sources in the aetiology of obesity is less clear, although
evidence favours a protective role of foods with a low glycaemic index.
19
300 DIETARY FACTORS AND INSULIN RESISTANCE
Recently research has turned towards the investigation of broader eating
habits rather than specific foods or nutrients. Issues such as the impact of
fast food,
20
snacking,
21
portion size,
22
food consumed in conjunction with TV
viewing
23
and family or cultural influences
24
may all be important determinants
of the risk of obesity. Finally, it is important to note the impact of physical
activity, both as a determinant of energy needs, but also as an element in innate
appetite control systems.
25
These issues have been recently reviewed.
26
The importance of obesity as a determinant of insulin resistance is confirmed
by the striking improvements that can be seen in insulin resistance with weight
loss.
27
Even modest weight losses of 5–10 per cent of initial body weight
achieved through diet and lifestyle modification in overweight and obese subjects
are related to improved insulin sensitivity.
28
The magnitude of the improvement
in insulin resistance is largely related to the extent of weight loss. For example,
very low calorie diets (VLCD), providing <800 kcal/day, are able to facilitate
greater weight loss, at least in the short term, than more conservative dietary
approaches, and a corresponding greater improvement in insulin sensitivity. In
obese sedentary subjects those using a VLCD achieved a 15 per cent weight loss
over 4 months with a 24 per cent improvement in insulin sensitivity measured by
the euglycaemic clamp.
29
In a group of 40 obese subjects with type 2 diabetes
the initial use of a VLCD for eight weeks resulted in a mean weight loss of more
than 10 per cent body weight with associated improvements in fructosamine, and
reductions in insulin requirements. This benefit was maintained at 12 months
after ongoing standard weight management advice.
30
The adjunctive use of pharmacotherapy, such as sibutramine or orlistat, to
achieve greater reductions in energy intake or absorption over and above diet
and lifestyle modification alone is associated with greater weight loss compared
with placebo. This translates into greater improvements in insulin sensitivity
in obese individuals
31, 32
and those with the metabolic syndrome
33
and also
improvements in glycaemic control in those with type 2 diabetes.
34
Bariatric
surgery, such as gastric bypass or gastric banding, leading to marked decreases
in energy intake, results in weight losses of up to 50 per cent body weight. This
is considerably greater than that achieved with other methods, leading to major
improvements in insulin sensitivity and reduced progression to diabetes in obese
individuals.
35, 36
It should be noted that changes in total energy intake have important effects
on insulin sensitivity independent of the effect of changes in body weight or fat
mass. In highly controlled experimental studies, short term periods of energy
restriction in individuals who are insulin resistant are associated with rapid
improvements in insulin sensitivity, even in the absence of weight loss.
37
The
exact mechanism for this sudden change is not clear, but is likely to be related
to changes in nutrient flux or possibly to gut-related hormones. In particular, a
reduction in circulating free fatty acids is achieved with acute energy restriction
due to reduced dietary fat intake and reduced adipocyte lipolysis. High levels of
THE IMPORTANCE OF BODY FATNESS 301
circulating free fatty acids have been linked to insulin resistance via impairment
of insulin-mediated glucose uptake and reductions in free fatty acid levels with
acute energy restriction reversing this effect.
8, 38
Thus, in the acute phase of
weight loss, the improvement in metabolic risk factors is largely related to the
energy deficit and extent of weight lost and there is little evidence to support a
specific benefit of any one dietary regimen over another. However, in the phase
of weight-loss maintenance, diet composition may become more important.
Weight loss achieved with diet and lifestyle modification, pharmacother-
apy or surgery is often followed by some weight regain, which is frequently
accompanied by deterioration in insulin sensitivity. In otherwise healthy obese
individuals, a minimum of five per cent long term reduction in body weight
appears to be required to maintain improvements in insulin sensitivity.
39
How-
ever, recent data suggests that there may be residual benefits that reduce, or at
least delay, the development of diabetes in obese subjects with impaired glucose
tolerance. Two large prospective randomized controlled trials of diet and lifestyle
intervention to promote weight loss in individuals at high risk of developing dia-
betes have shown a significantly reduced risk with very modest initial weight
loss and even smaller long term weight loss. In the Finnish diabetes prevention
study
40
intensive dietary and lifestyle advice achieved a mean weight loss of 4.7
per cent over 12 months in 522 obese individuals with impaired glucose toler-
ance, and significant reduction in 2 hour post-glucose-load insulin concentration
but not fasting insulin. This was followed by variable weight regain over the
mean 3.2 year follow-up, resulting in a mean 3.5 ± 5.5 kg decrease in weight
from baseline. This small long term sustained weight loss was associated with a
58 per cent reduced risk of progression to diabetes. An identical risk reduction
was observed in the Diabetes Prevention Program,
41
in a similar group of 3234
obese individuals with impaired glucose tolerance, and a mean weight loss of less
than five per cent body weight after 4 years. This implies a longer term metabolic
benefit of even small weight losses, which may encompass benefits on insulin
release from pancreatic β-cells as well as those of improved insulin sensitivity.
However, as might be expected, greater long term weight losses are associated
with a greater reduction in risk. The Xendos trial
42
was a randomized, placebo-
controlled trial comparing the adjunctive use of orlistat with intensive diet and
lifestyle modification in 4193 obese subjects. Subjects randomized to orlistat lost
a mean of 6.9 kg compared with 4.1 kg in those on placebo after 4 years. This
translated to a 37 per cent reduction (9.0 per cent compared with 6.2 per cent)
in the rate of progression to diabetes over the 4 years of the study. In a subset of
those with impaired glucose tolerance, those in the intensive lifestyle alone group
had similar rates of progression to diabetes to those in the intensive lifestyle
group of the Diabetes Prevention Program.
41
In these subjects, the additional
weight loss achieved with orlistat further reduced the rate of developing diabetes
by an additional 52 per cent.
302 DIETARY FACTORS AND INSULIN RESISTANCE
The impact of lifestyle changes, independent of body weight, are unclear, but
the improvement in insulin sensitivity is probably greater than may be antic-
ipated from the small overall weight loss. Increases in physical activity are
known to offer a decreased risk of diabetes but certain dietary components
may also be significant. In each of these studies the dietary recommendations
were based around a low fat, calorie-controlled diet, rich in fruits and vegeta-
bles and with an emphasis on unrefined carbohydrates, which is consistent with
international dietary recommendations for the prevention of cardiovascular dis-
ease. At present, no comparable long term data showing improvements in the
hard clinical endpoint of incident diabetes is available for other, less orthodox,
dietary regimens.
11.3 Specific dietary factors
Epidemiological investigations into the role of dietary factors and insulin resis-
tance generally focus on specific nutrients, notably macronutrients (fat, carbo-
hydrate, protein and, to a lesser extent, alcohol) or micronutrients (vitamins and
minerals). In addition there is growing interest in the role of a range of other
plant-based compounds that are not classical nutrients but that may exert specific
health benefits, such as flavanoids and phytoestrogens.
43
This makes it difficult
to disentangle the health effects of specific nutrients. Similar difficulties exist
in the interpretation of many dietary intervention studies. Changes in absolute
macronutrient intake have implications for total energy intake, while changes
in the proportion of energy-providing substrates result in changes in more than
one macronutrient. Food represents a complex mixture of nutrients and foods
are rarely eaten in isolation, so it may be more appropriate, although more com-
plex, to analyse broader dietary patterns. However suitable statistical techniques
are only just being employed to analyse nutritional data.
Fat
Fat is the most energy dense of the macronutrients, containing 9 kcal/g (37 kJ/g)
compared with 4 kcal/g (16 kJ/g) for carbohydrate or protein, and has been
implicated in the aetiology of obesity. However independent of the effect on
body weight, both the amount and type of fat have an impact on insulin sen-
sitivity. Diets high in fat are associated with impairments in insulin sensitivity
and animal studies consistently demonstrate that high fat diets promote insulin
resistance compared with diets high in carbohydrate.
44
Although less consis-
tent, studies in humans show that high fat diets are associated with higher
fasting insulin concentration and reduced insulin sensitivity,
45, 46
and in longi-
tudinal studies a higher rate of development of impaired glucose tolerance
47
and
progression to type 2 diabetes.
48
SPECIFIC DIETARY FACTORS 303
However, it is important to distinguish between different types of fat. The
negative association between fat and insulin sensitivity is predominately driven
by saturated fat. In epidemiological studies, a high saturated fat intake has
been associated with higher fasting insulin and glucose levels
45
and greater
rates of glucose intolerance.
47
Specific fatty acid analysis of serum and muscle
membrane phospholipids reveals an association between high levels of saturated
fatty acid content and higher fasting insulin, reduced insulin sensitivity and
higher risk of developing type 2 diabetes.
49, 50
Monounsaturated fatty acids (MUFAs) are usually considered to have a neu-
tral impact on insulin sensitivity. However, a recent large intervention study
replacing saturated fat with monounsaturated fat and with detailed measures of
insulin sensitivity using an IVGTT showed improvements in insulin sensitivity
in healthy subjects after 3 months.
51
However, a post hoc analysis suggested
that this benefit was only apparent among individuals where the intake of fat
was less than 37 per cent of total energy – highlighting the importance of total
fat content.
In epidemiological studies, increases in the proportion of PUFAs in the diet
are associated with lower insulin levels, enhanced insulin sensitivity
52, 53
and
reduced risk of developing type 2 diabetes.
54
In the Nurses’ Health Study, after
14 years follow-up, the adjusted relative risk for developing type 2 diabetes was
0.75 (95 per cent CI, 0.65–0.88) for the highest versus lowest quintile of PUFA
intake.
54
Polyunsaturated fatty acids are classified as essential fatty acids since
they must be obtained from the diet and cannot be synthesised in vivo. Linoleic
acid (n − 6) and α-linolenic acid (n − 3) classes of PUFA may be elongated and
further desaturated to form long chain fatty acids. This occurs to some extent
in vivo, but the majority of these long chain n − 3 PUFAs are obtained from
the diet in the form of the so-called fish oils, eicosapentanoic acid (EPA) and
decosahexanoic acid (DHA).
In the average western diet, intake of n − 6 PUFA is considerably greater
than that of n − 3 PUFA, and quantitatively small changes in n − 3 can have
a considerable effect on the n − 6:n − 3 ratio. There is some debate about the
relative importance of n − 3 intake and the n − 6:n − 3 ratio as a determinant
of insulin sensitivity. A study in rats fed a high fat diet resulting in insulin resis-
tance showed that replacing saturated fat with a combination of short chain (18:2
n − 6) and short chain (18:3 n − 3) PUFA had no effect on insulin resistance
measured by the euglycaemic clamp.
55
However, if saturated fat was replaced
with long chain n − 3 PUFA, insulin resistance was significantly improved.
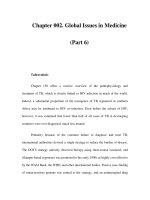
Moreover, if the rats were fed a diet of saturated fat combined with short chain
n − 3 but not short chain n − 6 PUFA, insulin resistance was similarly improved
(Figure 11.2). These results suggest an important role for long chain n − 3
PUFAs in improving insulin sensitivity, but further indicate that the competi-
tion for enzymes to further elongate and desaturate shorter chain n − 3 PUFAs
prevents this conversion when combined with a diet rich in short chain n − 6
304 DIETARY FACTORS AND INSULIN RESISTANCE
0
5
10
15
20
GIR (mg/kg min)
Sat
Mono
Poly
Poly + long(
n
– 3)
Poly + short (
n
– 3)
Sat + short(
n
– 3)
Figure 11.2 Impact of dietary fat composition on insulin sensitivity (data from refer-
ence 55)
PUFAs. From this it may be concluded that n − 3 PUFAs are important dietary
determinants of insulin sensitivity, and that the ratio of n − 6:n − 3 PUFAs and
the chain length of n − 3 PUFAs are also important.
Epidemiological evidence supports a beneficial impact of high dietary intakes
of the long chain n − 3 PUFAs eicosapentanoic acid (EPA) and decosahexanoic
acid (DHA) in reducing insulin resistance and rates of impaired glucose tolerance
and type 2 diabetes.
47, 56
Intervention studies have shown mixed results, which
may reflect differences in habitual diets of participants, doses of n − 3 PUFAs
used, other dietary components, methodologies used for measuring insulin sen-
sitivity or other population characteristics. Further research is required to resolve
this uncertainty.
Although long chain n − 3 PUFAs represent a small proportion of the total
dietary intake fat, they have specific metabolic functions, which may explain their
positive effect on insulin sensitivity. These fatty acids are preferentially incor-
porated into cell membranes, altering membrane fluidity and receptor function.
57
They have anti-inflammatory properties, by virtue of being substrates for less pro-
inflammatory ecosanoids than equivalent n − 6 fatty acids.
58
They have a potent
lipid modifying effect with consistent reductions in fasting triglycerides of 25–30
per cent in a wide range of patient groups.
59
They are also natural ligands for
PPARγ, and via this or other nuclear receptors may impact on gene expression of
adipocytokines.
60
Any or all of these features may explain the potentially important
role for dietary long chain n − 3 PUFAs on insulin sensitivity.
Carbohydrate
Changes in the proportion of dietary fat frequently lead to reciprocal changes
in carbohydrate, since protein intake tends to remain broadly constant in most
SPECIFIC DIETARY FACTORS 305
Western diets. Diets proportionally higher in carbohydrate tend to be associated
with a reduced risk of obesity and hence decreased risk of diabetes,
61
but it is
not easy to ascertain whether this reflects the disadvantageous effects of high
fat diets or a specific positive benefit of carbohydrate. Recently, the concept
that low carbohydrate diets may be linked to enhanced weight loss has received
much public attention, but there is little scientific evidence for any novel effect.
A systematic review of low carbohydrate diets concluded that weight loss was
related to the energy deficit and diet duration rather than to the carbohydrate
content per se.
62
A 1 year trial of a low carbohydrate diet versus a low fat diet
found that although initial weight losses were greater in the low carbohydrate
group this was not sustained and after 1 year there was no significant differ-
ence between the two groups.
63
In practice, a low carbohydrate diet reduces
energy intake since it is difficult to replace calories from carbohydrate from
other sources. Indeed, low carbohydrate diets can also reduce fat intake since
the two co-exist in many foods such as cakes and biscuits, or carbohydrate may
act as a vehicle for added fat, e.g. bread and butter.
However, over and above these putative effects on body weight there is
growing interest in the possibility that different types of carbohydrate may
be associated with specific effects on insulin resistance, independent of body
weight. These metabolic properties are particularly associated with specific fea-
tures of certain carbohydrate foods, such as their chemical structure, e.g. fibre
content, the degree of processing, e.g. wholegrain, or the metabolic effects, e.g.
glycaemic index.
1. Fibre. Epidemiological studies suggest that high fibre diets are associated
with a reduced risk of type 2 diabetes.
64
The mechanism of action is not
clear, although fibre may attenuate the glycaemic response to ingested car-
bohydrate, possibly by its physical effect in the gut, where it tends to slow
the absorption of nutrients, thus reducing the demand for insulin. Alterna-
tively, fibre and indigestible carbohydrate may be fermented by the colonic
bacteria, producing short chain fatty acids. These may enter the portal circu-
lation, increase hepatic glucose oxidation, decrease FFA release and increase
insulin clearance.
65
The relative effects of soluble and insoluble fibre remain unclear. In a crossover
study in 14 subjects with type 2 diabetes, increased cereal fibre reduced mean
glucose concentration with no effect on insulin levels, suggesting an improve-
ment in insulin sensitivity.
66
In contrast, in 22 healthy postmenopausal women
insulin sensitivity measured by an IVGTT was no different whether subjects
were taking high fibre rye bread or white wheat bread.
67
However, insulin
secretion measured from the IVGTT was increased with the high fibre rye
bread, suggesting an effect of fibre on β-cell function. Another study compar-
ing whole kernel rye bread, wholemeal rye bread (high in soluble fibre), dark
durum wheat pasta and white wheat bread in a test meal with equivalent total
306 DIETARY FACTORS AND INSULIN RESISTANCE
carbohydrate content demonstrated no difference in rate of gastric emptying
or glucose response, but lower insulin responses to each of the higher fibre
products compared with white wheat bread. The total fibre content of each was
different, but resulted in similar effects on insulin response. The authors con-
cluded that the structural and compositional properties of the fibre are more
important that the total quantity.
68
2. Whole grains. In western countries the majority of grain products consumed
are refined, with average consumption of wholegrain foods as low as one
serving per day in the United States.
69
Epidemiological studies show a pro-
tective effect of diets rich in wholegrain foods on insulin sensitivity
70
and risk
for type 2 diabetes.
71
In the Framingham offspring study cohort, there was
an inverse relationship between wholegrain consumption and fasting insulin
concentration, which remained significant after adjustment for BMI.
70
In the
Health Professionals Follow-Up Study, the adjusted relative risk of develop-
ing type 2 diabetes over 12 years was 0.58 comparing the highest and lowest
quintiles of wholegrain intakes.
71
Experimental studies have also demon-
strated benefits of whole grains on insulin sensitivity. In a cross-over study
in 11 obese subjects insulin sensitivity, measured by the euglycaemic clamp,
improved after six weeks on a diet rich in whole grains compared with
refined grains. This effect was deserved in the absence of any change in
body weight.
72
The mechanism for any protective effect of whole grains remains uncertain.
The refining process modifies the nutritional composition of grains, reducing
magnesium, vitamin E and fibre content. In the Framingham study and the
Health Professionals Follow-Up Study, individual adjustment for intake of
magnesium and insoluble fibre attenuated the inverse relationship with fasting
insulin and risk for developing type 2 diabetes respectively, suggesting that
these components may be important,
70, 71
although they did not appear to
explain the full association.
Of further interest is the observation that, when stratified for BMI, the pro-
tective effect of whole grains on fasting insulin may be limited to those with
a BMI greater than 30 kg/m
2
.
70
This may be related to higher fasting insulin
levels in the more obese individuals, but also raises the intriguing possi-
bility of an interaction between dietary factors and phenotype, where low
wholegrain consumption may be particularly disadvantageous in the obese.
3. Glycaemic index (GI). There is increasing interest in the concept of gly-
caemic index (GI) – a physiological classification that describes the impact
of a known quantity of available carbohydrate on blood glucose following
ingestion. This is of particular relevance to the consideration of insulin resis-
tance since there is a high correlation between the glycaemic response and the
insulin response (with just a few exceptions, notably dairy products, which
induce a disproportionately high insulin response).
SPECIFIC DIETARY FACTORS 307
There is concern that a high carbohydrate intake increases insulin secre-
tion to maintain glucose homeostasis, resulting in higher postprandial insulin
levels.
73
However, the glycaemic index of the carbohydrate, or other compo-
nents of the meal, will modulate the effect on insulin release. The possibility
of effects of glycaemic index on both insulin secretion and uptake high-
lights the complexities of this theory. The glycaemic index measures and
ranks the impact of carbohydrates on postprandial plasma glucose. The GI
depends largely on the rate of digestion and absorption of carbohydrates.
From this it can by shown that many ‘complex’ carbohydrates induce a gly-
caemic response nearly as high as that of pure glucose. This suggests that
the traditional classification of simple versus complex carbohydrate based on
chemical composition may not be especially useful.
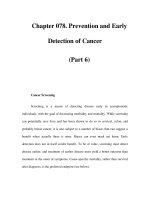
In epidemiological studies, low dietary glycaemic load (GI/total carbohy-
drate) has been associated with reduced rates of developing type 2 diabetes.
In a cohort of 65 173 women in the Nurses’ Health Study over a six year
period the relative risk was 1.37 of developing diabetes in the highest quin-
tile of glycaemic load compared with the lowest quintile after adjusting for
intake of cereal fibre
64
(Figure 11.3). Wolever and Bolognesi examined the
effect of both the amount and source of carbohydrate consumed on postpran-
dial glucose and insulin responses to mixed meals of varying total energy,
fat, protein and carbohydrate content, in eight subjects without diabetes.
74
The amount of carbohydrate alone was not significantly related to the mean
glucose and insulin responses. However, amount of carbohydrate combined
with glycaemic index explained approximately 90 per cent of the variability
of the glucose and insulin responses. This apparent effect on insulin sensitiv-
ity may depend on the underlying individual level of insulin resistance. In a
small study of seven healthy, lean, insulin-sensitive young men, no improve-
ments were seen with a low GI diet compared with a high GI diet in a 30
0
0.5
1
1.5
2
2.5
High
(>165)
Medium Low
(<143)
High (>5.8 g)
Medium
Low (<2.5g)
Relative risk
Glycaemic load
Cereal fibre
Figure 11.3 Impact of carbohydrate composition on the risk of type 2 diabetes (data from
reference 64)
308 DIETARY FACTORS AND INSULIN RESISTANCE
day randomized crossover study.
75
However, in a group of 30 patients with
advanced cardiovascular disease those randomized to a low GI dietary inter-
vention over 4 weeks had improvements in insulin sensitivity compared with
thoseonahighGIdiet.
76
However, these classification systems are not mutually exclusive and there is
no comprehensive definition that neatly accounts for the health effect of car-
bohydrates. In epidemiological analyses it may be more useful to focus on
certain foods or on overall eating patterns, using techniques such as or principal
component analysis. Meanwhile, intervention studies need to use well defined
dietary prescriptions, which if successful can be translated into public health
recommendations.
Protein
Across diverse diets the proportion of protein in the diet remains relatively
stable, with a reciprocal relationship between fat and carbohydrate dominating
most changes in dietary intake. There is relatively little data on the effects of
protein on insulin sensitivity. In a group of overweight insulin-resistant subjects,
replacing carbohydrate with protein from meat, poultry and dairy food in a
calorie reduced diet (high protein diet, 27 per cent energy protein, 44 per cent
carbohydrate and 29 per cent fat, versus low protein diet, 16 per cent protein,
57 per cent carbohydrate, 27 per cent fat) had no effect on overall weight loss
but had a beneficial effect on glycaemic response, suggesting improved insulin
sensitivity.
77
There is evidence from studies in rats that the source of dietary protein
may have differential effects on insulin sensitivity. In rats fed a high fat diet,
in which the protein source was casein, fish (cod) protein or soy protein, the
high fat feeding led to severe insulin resistance, which was prevented by fish
protein, and to a lesser degree by soy protein compared with casein.
78
However,
highly controlled intervention studies testing the impact of differing dietary
protein content or source employing euglycaemic clamp or IVGTT methods of
measuring insulin sensitivity in humans are lacking. This therefore remains an
area requiring additional research.
Alcohol
Epidemiological studies remain equivocal on the relationship between alcohol
consumption and type 2 diabetes, with the impact being dose related. The Nurses
Health Study
79
and US Male Health Professionals Study
80
both suggest a pro-
tective role for modest alcohol intake (less than 21 standard drinks per week),
but the Atherosclerosis Risk in Communities Study (ARIC) suggest that men
consuming over 21 standard drinks per week have an increased risk.
81
Data
SPECIFIC DIETARY FACTORS 309
from the British Regional Heart Study suggests a U-shaped relationship between
alcohol consumption and risk of type 2 diabetes.
82
Thus the effects of alcohol
may be different according to level of consumption and are confounded by
differences in body weight, body fatness and blood lipids. Intervention studies
specifically examining the impact of alcohol on insulin sensitivity are limited.
One crossover study in overweight women showed no effect of 10 weeks of mod-
est red wine intake on insulin sensitivity, measured by an IVGTT, or glucose
homeostasis.
83
Micronutrients
There has been relatively little systematic investigation into the effects of specific
vitamins and minerals on insulin sensitivity. Epidemiological analysis reveals
several candidates, but in each case the evidence for specific physiological
effects is limited.
Vitamin E
Vitamin E is a fat-soluble vitamin with antioxidant properties. Increased oxida-
tive stress has been linked with insulin resistance, raising the possibility that
dietary antioxidants may have beneficial effects. Two cohort studies have exam-
ined the relationship between vitamin E status and risk of type 2 diabetes.
One study showed that low levels of vitamin E were associated with a 3.9-
fold increased risk of developing type 2 diabetes over four years.
84
The other,
a nested case control study, showed that subjects with high levels of vitamin
E had a 39 per cent lower risk of type 2 diabetes compared with those with
low levels.
85
However, this association was lost when adjusted for cholesterol,
smoking, BMI and hypertension. In healthy non-diabetic individuals, insulin
sensitivity measured by an IVGTT was positively related to plasma vitamin E
concentration and inversely related to lipid hyperoxide concentrations, suggest-
ing a role in insulin sensitivity.
86
However, this relationship was not seen in a
similar study after adjustment for other factors known to affect insulin sensi-
tivity such as degree of obesity and level of physical activity.
87
Together this
data suggests that vitamin E intake and status may reflect a generally healthy
lifestyle rather than independent metabolic effects.
Magnesium
Large epidemiological studies have shown an association between low magne-
sium intake and the risk of type 2 diabetes in both men and women with a
risk ratio for those in the upper quintile compared with the lower quintile of
magnesium intake of about 0.7 after adjustment for BMI, smoking and physical
activity.
64, 69, 88
Cereal fibre is an important dietary source of magnesium and
adjustment for fibre intake attenuates this relationship.
310 DIETARY FACTORS AND INSULIN RESISTANCE
Chromium
Chromium appears to have an important role in tissue whole body insulin sen-
sitivity. In subjects with impaired glucose tolerance and raised insulin levels,
chromium supplementation improves both insulin levels and glucose tolerance
in patients with low intakes of chromium.
89
Similar improvements in glycaemic
control are seen with chromium supplements in those with established type 2
diabetes,
90
although there is no apparent effect on insulin sensitivity in those
with normal glucose tolerance. Although the role of chromium supplements
is not firmly established there is at least a plausible mechanism of action for
increased insulin action via increased insulin receptor expression and increased
activation of insulin receptor kinase.
91
11.4 Summary
Whole body insulin sensitivity is the product of a complex interaction between
genotype, physical characteristics such as body weight and environmental and
behavioural factors such as diet and physical activity.
Obesity is strongly linked to impaired insulin sensitivity, but acute changes
in total energy intake influence insulin sensitivity independently of changes in
body weight or fat mass. Specific dietary components may also have inde-
pendent effects on insulin sensitivity. The balance of evidence suggests that
a high intake of saturated fat reduces insulin sensitivity, but that monounsat-
urated and polyunsaturated fat are neutral or beneficial, at least in the set-
ting of moderate total fat intake. The effects of carbohydrate are less clear;
however, unrefined carbohydrate, with a low glycaemic index, wholegrain and
high fibre foods appear to have beneficial effects on insulin sensitivity com-
pared with more refined carbohydrates. There may also be an influence of
specific micronutrients such as magnesium, chromium and vitamin E; however,
the evidence is limited. The evidence relating to dietary factors and insulin
resistance is mostly drawn from epidemiological analyses with limited evi-
dence from intervention studies and supplemented in some cases by biochemical
mechanisms. However, more research is needed, especially to identify inter-
relationships with specific genotypes as have been elucidated with ApoE and
hyperlipidaemia.
92
Nonetheless there is a rational framework to make dietary recommendations
to reduce the risk of insulin resistance and type 2 diabetes. Specifically, diets
low in fat, especially saturated fat, with further substitutions of MUFAs or
n − 3 PUFAs for n − 6 PUFAs and increases in unrefined carbohydrate, fruits
and vegetables. This dietary prescription is consistent with strategies to reduce
the risk of other non-communicable diseases.
REFERENCES 311
References
1. Goris, H. C., Westerterp-Plantenga, M. S. and Westerperp, K. R. (2000) Undereating
and underrecording of habitual food intake in obese men: selective underreporting of
fat intake. Am J Clin Nutr 71, 130–134.
2. Prentice, A. M., Black, A. E., Coward, W. A., Davies, H. L., Goldberg, G. R. and
Murgatroyd, P. R. et al. (1986) High levels of energy expenditure in obese women.
BMJ 292, 983–987.
3. Chan, J. M., Rimm, E. B., Colditz, G. A., Stampfer, M. J. and Willett, W. C. (1994)
Obesity, fat distribution and weight gain as risk factors for clinical diabetes in men.
Diabetes Care 17, 961–969.
4. Colditz, G. A., Willett, W. C., Rotnitzky, A. and Manson, J. E. (1995) Weight gain as a
risk factor for clinical diabetes mellitus in women. AnnInternMed122 (7), 481–486.
5. Carey, D. G., Jenkins, A. B., Campbell, L. V., Freund, J. and Chisholm, D. J. (1996)
Abdominal fat and insulin resistance in normal and overweight women. Diabetes 45,
633–638.
6. Weyer, C., Hanson, K., Bogardus, C. and Pratley, R. E. (2000) Long-term changes in
insulin action and insulin secretion associated with gain, loss, regain and maintenance
of body weight. Diabetologia 43 (1), 36–46.
7. Fruhbeck, G., Gomez-Ambrosi, J., Muruzabal, F. R. and Burrell, M. A. (2001) The
adipocyte: a model for integration of endocrine and metabolic signaling in energy
metabolism regulation. Am J Physiol Endocrinol Metab 280, E827–E847.
8. Frayn, K. N. (2001) Adipose tissue and the insulin resistance syndrome. Proc Nutr Soc
60 (3), 375–380.
9. Jebb, S. A. (1997) Aetiology of obesity. Br Med Bull 53, 264–285.
10. Egger, G. and Swinburn, B. A. (1997) An ecological approach to the obesity epidemic.
BMJ 315, 477–480.
11. Bolton-Smith, C. and Woodward, M. (1994) Dietary composition and fat to sugar ratios
in relation to obesity. Int J Obes Relat Metab Disorders 18 (12), 820–828.
12. Seidell, J. C. (1998) Dietary fat and obesity: an epidemiological perspective. Am J Nutr
67 (Suppl. 3), 546S–550S.
13. Stubbs, R. J., Ritz, P., Coward, W. A. and Prentice, A. M. (1995) Covert manipulation
of the ratio of dietary fat to carbohydrate and energy density: effect on food in-
take and energy balance in free-living men eating ad libitum. Am J Clin Nutr 62 (2),
330–337.
14. Stubbs, R. J., Harbon, C. G. and Prentice, A. M. (1996) Covert manipulation of the
dietary fat to carbohydrate ratio of isoenergetically dense diets: effects on food intake in
feeding men ad libitum. Int J Obes 20, 651–660.
15. NHLBI Obesity Education Initiative Expert Panel. Clinical guidelines on the
identification, evaluation, and treatment of overweight and obesity in adults; the evidence
report: National Institutes of Health; 1998 September 1998. Report No. 98-4083.
16. Mattes, R. D. and Rothacker, D. (2001) Beverage viscosity is inversely related to
postprandial hunger in humans. Physiol Behav 74, 551–557.
17. Ludwig, D. S., Peterson, K. E. and Gortmaker, S. L. (2001) Relation between
consumption of sugar-sweetened drinks and childhood obesity: a prospective,
observational analysis. Lancet 357 (9255), 505–508.
18. Raben, A., Vasilaras, T. H., Moller, A. C. and Astrup, A. (2002) Sucrose compared with
artificial sweeteners: different effects on ad libitum food intake and body weight after
10 weeks of supplementation in overweight subjects. Am J Clin Nutr 76, 721–729.
312 DIETARY FACTORS AND INSULIN RESISTANCE
19. Ludwig, D. S., Majzoub, J. A., Al-Zahrani, A., Dallal, G. E., Blanco, I. and Roberts,
S. B. (1999) High glycaemic index foods, overeating, and obesity. Pediatrics 103 (3),
E26.
20. Prentice, A. M. and Jebb, S. A. (2003) Fast foods, energy density and obesity – a
possible mechanistic link. Obes Rev 4 (4), 187–194.
21. Green, S. M. and Blundell, J. E. (1996) Effect of fat and sucrose-containing foods on
the size of eating episodes and energy intake in lean dietary restrained and unrestrained
females: potential for causing over-consumption. Eur J Clin Nutr 50, 625–635.
22. Rolls, B. J., Morris, E. L. and Roe, L. S. (2002) Portion size of food affects energy
intake in normal-weight and overweight men and women. Am J Clin Nutr 76, 1207–1213.
23. Rennie, K. and Jebb, S. A. (2004) Sedentary lifestyles are associated with being
overweight and consumption of savoury snacks in young people (4–18 years). Proc
Nutr Soc (in press).
24. Campbell, K. and Crawford, D. (2001) Family food environments as determinants of
preschool-aged children’s eating behaviours: implications for obesity prevention policy.
Areview.Aust J Nutr Dietet 58, 19–25.
25. Saris, W. H. (1998) Fit, fat and fat free: the metabolic aspects of weight control. [Review;
50 refs]. Int J Obes 22 (Suppl. 2), S15–S21.
26. Jebb, S. A. and Krebs, J. D. Lifestyle determinants of obesity. In: Kumar, S. and
Barnett, A. H., eds. Obesity and Diabetes. New York: Wiley (in press).
27. Pi-Sunyer, F. X. (1993) Short-term medical benefits and adverse effects of weight loss.
AnnInternMed119 (7), 722–726.
28. Goldstein, D. J. (1992) Beneficial health effects of modest weight loss. Int J Obes 16,
397–415.
29. Goodpaster, B. H., Kelley, D. E., Wing, R. R., Meier, A. and Thaete, F. L. (1999)
Effects of weight loss on regional fat distribution and insulin sensitivity in obesity.
Diabetes 48, 839–847.
30. Dhindsa, P., Scott, A. R. and Donnelly, R. (2003) Metabolic and cardiovascular effects
of very-low-calorie diet therapy in obese patients with type 2 diabetes in secondary
failure: outcomes after 1 year. Diabet Med 20, 319–324.
31. Davidson, M. H., Hauptman, J., DiGirolamo, M., Foreyt, J. P., Halsted, C. H. and
Heber, D. et al. (1999) Weight control and risk factor reduction in obese subjects treated
for 2 years with orlistat: a randomized controlled trial. JAMA 281 (3), 235–242.
32. James, W. P., Astrup, A., Finer, N., Hilsted, J., Kopelman, P. and Rossner, S. et al.
(2000) Effect of sibutramine on weight maintenance after weight loss: a randomised
trial. STORM Study Group. Sibutramine Trial of Obesity Reduction and Maintenance.
Lancet 356 (9248), 2119–2125.
33. Reaven, G., Segal, K., Hauptman, J., Boldrin, M. and Lucas, C. (2001) Effect of orlistat-
assisted weight loss in decreasing coronary heart disease risk in patients with syndrome
X. Am J Cardiol 87 (7), 827–831.
34. Finer, N., Bloom, S. R., Frost, G. S., Banks, L. M. and Griffiths, J. (2000) Sibutramine
is effective for weight loss and diabetic control in obesity with type 2 diabetes:
a randomised, double-blind, placebo-controlled study. Diabetes Obes Metab 2 (2),
105–112.
35. Sjostrom, C. D., Lissner, L., Wedel, H. and Sjostrom, L. (1999) Reduction in incidence
of diabetes, hypertension and lipid disturbances after intentional weight loss induced by
bariatric surgery: the SOS intervention study. Obes Res 7 (5), 477–484.
36. Friedman, J. E., Dohm, G. L., Leggett-Frazier, N., Elton, C. W., Tapscott, E. B. and
Pories, W. P. et al. (1992) Restoration of insulin responsiveness in skeletal muscle of
morbidly obese patients after weight loss. Effect on muscle glucose transport and glucose
transporter GLUT4. J Clin Invest 89 (2), 701–705.
REFERENCES 313
37. Weinsier, R. L., James, L. D. and Darnell, B. E. (1992) Lipid and insulin concentrations
in obese postmenopausal women: seperate effects of energy restriction and weight loss.
Am J Clin Nutr 56, 44–49.
38. Shulman, G. I. (2000) Cellular mechanisms of insulin resistance. J Clin Invest 106 (2),
171–176.
39. Krebs, J. D., Evans, S., Cooney, L., Mishra, G. D., Finer, N. and Jebb, S. A. (2002)
Changes in risk factors for cardiovascular disease with body fat loss in obese women.
Diabetes Obes Metab 4 (6), 379–387.
40. Tuomilehto, J., Lindstrom, J., Eriksson, J. G., Valle, T. T., Hamalainen, H. and Ilanne-
Parikka, P. et al. (2001) Prevention of type 2 diabetes mellitus by changes in lifestyle
among subjects with impaired glucose tolerance. N Engl J Med 344, 1343–1350.
41. Diabetes Prevention Program Research Group. (2002) Reduction in the incidence of type
2 diabetes with lifestyle intervention or metformin. N Engl J Med 346, 393–403.
42. Torgerson, J. S. et al. (2004) XENDOS: a randomised study of orlistat as an adjunct to
lifestyle changes for the prevention of type 2 diabetes in obese patients. Diabetes Care
27 (1), 155–161.
43. Goldberg, G., ed. (2003) Plants: Diet and Health, British Nutrition Foundation. Oxford:
Blackwell.
44. Storlien, L. H., Pan, D. A., Kriketos, A. D. and Baur, L. A. (1993) High fat diet-induced
insulin resistance. Lessons and implications from animal studies. AnnNYAcadSci683,
82–90.
45. Marshall, J. A., Bessesen, D. H. and Hamman, R. F. (1997) High saturated fat and low
starch and fibre are associated with hyperinsulinaemia in a non-diabetic population: the
San Luis Valley Diabetes Study. Diabetologia 40 (4), 430–438.
46. Lovejoy, J. and DiGirolamo, M. (1992) Habitual dietary intake and insulin sensitivity in
lean and obese adults. Am J Clin Nutr 55 (6), 1174–1179.
47. Feskens, E. J., Virtanen, S. M., Rasanen, L., Tuomilehto, J., Stengard, J. and Pekka-
nen, J. et al. (1995) Dietary factors determining diabetes and impaired glucose tolerance.
A 20-year follow-up of the Finnish and Dutch cohorts of the Seven Countries Study.
Diabetes Care 18 (8), 1104–1112.
48. Marshall, J. A., Hoag, S., Shetterly, S. and Hamman, R. F. (1994) Dietary fat predicts
conversion from impaired glucose tolerance to NIDDM. The San Luis Valley Diabetes
Study. Diabetes Care 17 (1), 50–56.
49. Storlien, L. H., Pan, D. A., Kriketos, A. D., O’Connor, J., Caterson, I. D. and Cooney,
G. J. et al. (1996) Skeletal muscle membrane lipids and insulin resistance. Lipids 31
(Suppl.), S261–S265.
50. Vessby, B., Aro, A., Skarfors, E., Berglund, L., Salminen, I. and Lithell, H. (1994) The
risk to develop NIDDM is related to the fatty acid composition of the serum cholesterol
esters. Diabetes 43, 1353–1357.
51. Vessby, B., Unsitupa, M., Hermansen, K., Riccardi, G., Rivellese, A. A. and Tapsell,
L. C. et al. (2001) Substituting dietary saturated for monounsaturated fat impairs insulin
sensitivity in healthy men and women: the KANWU Study. Diabetologia 44 (3),
312–319.
52. Feskens, E. J., Loeber, J. G. and Kromhout, D. (1994) Diet and physical activity as
determinants of hyperinsulinemia: the Zutphen Elderly Study. Am J Epidemiol 140 (4),
350–360.
53. Mayer-Davis, E. J., Monaco, J. H., Hoen, H. M., Carmichael, S., Vitolins, M. Z. and
Rewers, M. J. et al. (1997) Dietary fat and insulin sensitivity in a triethnic population:
the role of obesity. The Insulin Resistance Atherosclerosis Study (IRAS). Am J Clin Nutr
65 (1), 79–87.
314 DIETARY FACTORS AND INSULIN RESISTANCE
54. Salmeron, J., Hu, F. B., Manson, J. E., Stampfer, M. J., Colditz, G. A. and Rimm, E. B.
et al. (2001) Dietary fat intake and risk of type 2 diabetes in women. Am J Clin Nutr 73
(6), 1019–1026.
55. Storlien, L. H., Jenkins, A. B., Chisholm, D. J., Pascoe, W. S., Khouri, S. and Krae-
gen, E. W. (1991) Influence of dietary fat composition on development of insulin resis-
tance in rats. Relationship to muscle triglyceride and omega-3 fatty acids in muscle
phospholipid. Diabetes 40 (2), 280–289.
56. Adler, A. I., Boyko, E. J., Schraer, C. D. and Murphy, N. J. (1994) Lower prevalence
of impaired glucose tolerance and diabetes associated with daily seal oil or salmon
consumption among Alaska Natives. Diabetes Care 17 (12), 1498–1501.
57. Simopoulos, A. P. (1999) Essential fatty acids in health and chronic disease. Am J Clin
Nutr 70 (Suppl. 3), 560S–569S.
58. Grimble, R. F. (1998) Dietary lipids and the inflammatory response. Proc Nutr Soc 57
(4), 535–542.
59. Harris, W. S. (1996) n-3 fatty acids and lipoproteins: comparison of results from human
and animal studies. Lipids 31 (3), 243–252.
60. Chambrier, C., Bastard, J. P., Rieusset, J., Chevillotte, E., Bonnefont-Rousselot, D.
and Therond, P. et al. (2002) Eicosapentaenoic acid induces mRNA expression of
peroxisome proliferator-activated receptor γ. Obes Res 10 (6), 518–525.
61. Hill, J. O. and Prentice, A. M. (1995) Sugar and body weight regulation. Am J Clin Nutr
62 (Suppl. 1), 264S–274S.
62. Bravata, D. M., Sanders, L., Huang, J., Krumholz, H. M., Olkin, I. and Gardner, C. D.
et al. (2003) Efficacy and safety of low-carbohydrate diets. A systematic review. JAMA
289, 1837–1850.
63. Foster, G. D., Wyatt, H. R., Hill, J. O., McGuckin, B. G., Brill, C. and Mohammed,
B. S. et al. (2003) A randomised trial of a low-carbohydrate diet for obesity. N Engl J
Med 348, 2082–2090.
64. Salmeron, J., Manson, J. E., Stampfer, M. J., Colditz, G. A., Wing, A. L. and Wil-
lett, W. C. (1997) Dietary fiber, glycemic load, and risk of non-insulin-dependent dia-
betes mellitus in women. JAMA 277 (6), 472–477.
65. Thorburn, A., Muir, J. and Proietto, J. (1993) Carbohydrate fermentation decreases
hepatic glucose output in healthy subjects. Metabolism 42, 780–785.
66. Karlstrom, B., Vessby, B., Asp, N. G., Boberg, M., Gustafsson, I. B. and Lithell, H.
et al. (1984) Effects of an increased content of cereal fibre in the diet of type 2 (non-
insulin-dependent) diabetic patients. Diabetologia 26, 272–277.
67. Juntunen, K. S., Laaksonen, D. E., Poutanen, K. S., Niskanen, L. K. and Mykka-
nen, H. M. (2003) High-fibre rye bread and insulin secretion and sensitivity in healthy
postmenopausal women. Am J Clin Nutr 77, 385–391.
68. Juntunen, K. S., Niskanen, L. K., Liukkonen, K. H., Poutanen, K. S., Holst, J. J. and
Mykkanen, H. M. (2002) Postprandial glucose, insulin and incretin responses to grain
products in healthy subjects. Am J Clin Nutr 75, 254–262.
69. Meyer, K. A., Kushi, L. H., Jacobs, D. R., Slavin, J., Sellers, T. A. and Folsom, A. R.
(2000) Carbohydrates, dietary fiber, and incident type 2 diabetes in older women. Am J
Clin Nutr 71 (4), 921–930.
70. McKeown, N. M., Meigs, J. B., Liu, S., Wilson, P. W. F. and Jacques, P. F. (2002)
Whole-grain intake is favourably associated with metabolic risk factors for type 2
diabetes and cardiovascular disease in the Framingham Offspring Study. Am J Clin Nutr
76, 390–398.
71. Fung, T. T., Hu, F. B., Pereira, M. A., Liu, S., Stampfer, M. J. and Colditz, G. A. et al.
(2002) Whole-grain intake and the risk of type 2 diabetes: a prospective study in men.
Am J Clin Nutr 76, 535–540.
REFERENCES 315
72. Pereira, M. A., Jacobs, D. R., Jr., Pins, J. J., Raatz, S. K., Gross, M. D. and Slavin, J. L.
et al. (2002) Effect of whole grains on insulin sensitivity in overweight hyperinsulinemic
adults. Am J Clin Nutr 75 (5), 848–855.
73. Reaven, G. M. (1997) Do high carbohydrate diets prevent the development or attenuate
the manifestations (or both) of syndrome X? A viewpoint strongly against. Curr Opin
Lipidol 8 (1), 23–27.
74. Wolever, T. M. and Bolognesi, C. (1996) Prediction of glucose and insulin responses
of normal subjects after consuming mixed meals varying in energy, protein, fat,
carbohydrate and glycemic index. JNutr126 (11), 2807–2812.
75. Kiens, B. and Richter, E. A. (1996) Types of carbohydrate in an ordinary diet affect
insulin action and muscle substrates in humans. Am J Clin Nutr 63, 47–53.
76. Frost, G. (1996) The effect of low-glycaemic carbohydrate on insulin and glucose
response in vivo and in vitro in patients with coronary heart disease. Metabolism 45
(6), 669–672.
77. Farnsworth, E., Luscombe, N. D., Noakes, M., Wittert, G., Argyiou, E. and Clifton,
P. M. (2003) Effect of a high-protein, energy-restricted diet on body composition,
glycaemic control, and lipid concentration in overweight and obese hyperinsulinaemic
men and women. Am J Clin Nutr 78, 31–39.
78. Lavigne, C., Tremblay, F., Asselin, G., Jacques, H. and Marette, A. (2001) Prevention
of skeletal muscle insulin resistance by dietary cod protein in high fat-fed rats. Am J
Physiol Endocrinol Metab 281 (1), E62–E71.
79. Stampfer, M. J., Colditz, G. A. and Willett, W. C. (1988) A prospective study of
moderate alcohol drinking and risk of diabetes in women. Am J Epidemiol 128, 549–558.
80. Ajani, U. A., Hennekens, C. H. and Spelsberg, A. (2000) Alcohol consumption and risk
of type diabetes mellitus among US male physicians. Arch Intern Med 160, 1025–1030.
81. Kao, W. H., Puddey, I. B. and Boland, L. L. (2001) Alcohol consumption and the risk
of type 2 diabetes mellitus: atherosclerosis risk in communities study. Am J Epidemiol
154, 748–757.
82. Perry, I. J., Wannamethee, S. G., Walker, M. K., Thompson, A. G., Whincup, P. H. and
Shaper, A. G. (1995) Prospective study of risk factors for development of non-insulin
dependent diabetes in middle-aged British men. BMJ 310, 560–564.
83. Cordain, L., Melby, C. L., Hamamoto, A. E., O’Neill, D. S., Cornier, M. A. and
Barakat, H. A. et al. (2000) Influence of moderate chronic wine consumption on insulin
sensitivity and other correlates of syndrome X in moderately obese women. Metab: Clin
Exp 49 (11), 1473–1480.
84. Salonen, J. T., Nyyssonen, K., Tuomainen, T. P., Maenpaa, P. H., Korpela, H. and
Kaplan, G. A. et al. (1995) Increased risk of non-insulin dependent diabetes mellitus
at low plasma vitamin E concentrations: a four year follow up study in men. BMJ 311
(7013), 1124–1127.
85. Reunanen, A., Knekt, P., Aaran, R. K. and Aromaa, A. (1998) Serum antioxidants and
risk of non-insulin dependent diabetes mellitus. Eur J Clin Nutr 52 (2), 89–93.
86. Facchini, F. S., Humphreys, M. H., DoNascimento, C. A., Abbasi, F. and Reaven,
G. M. (2000) Relation between insulin resistance and plasma concentrations of lipid
hydroperoxides, carenoids and tocopherols. Am J Clin Nutr 72 (3), 776–779.
87. Facchini, F., Coulston, A. M. and Reaven, G. M. (1996) Relationship between dietary
vitamin intake and resistance to insulin-mediated glucose disposal in healthy volunteers.
Am J Clin Nutr 63 (6), 946–949.
88. Salmeron, J., Ascherio, A., Rimm, E. B., Colditz, G. A., Spiegelman, D. and Jenk-
ins, D. J. et al. (1997) Dietary fiber, glycemic load, and risk of NIDDM in men. Diabetes
Care 20 (4), 545–550.
316 DIETARY FACTORS AND INSULIN RESISTANCE
89. Anderson, R. A., Polansky, M. M., Bryden, N. A. and Canary, J. J. (1991) Supplement-
al-chromium effects on glucose, insulin, glucagon and urinary chromium losses in
subjects consuming controlled low-chromium diets. Am J Clin Nutr 54, 909–916.
90. Anderson, R. A., Cheng, N., Bryden, N. A., Polansky, M. M., Chi, J. and Feng, J.
(1997) Elevated intakes of supplemental chromium improve glucose and insulin variables
in individuals with type 2 diabetes. Diabetes 46, 1786–1791.
91. Vincent, J. B. (2000) The biochemistry of chromium. JNutr130, 715–718.
92. Boer, J. M., Feskens, E. J., Schouten, E. G., Havekes, L. M., Seidell, J. C. and
Kromhout, D. (1998) Lipid profiles reflecting high and low risk for coronary heart
disease: contribution of apolipoprotein E polymorphism and lifestyle. Atherosclerosis
136 (2), 395–402.
12
Physical Activity and Insulin
Resistance
Nicholas J. Wareham, Søren Brage, Paul W. Franks
and Rebecca A. Abbott
12.1 Introduction
The past 20 years has seen an explosion of interest in the relationship between
physical activity and insulin resistance. These studies have addressed not only
whether there is an association and how strong it is, but also the mechanisms that
may underlie it. This chapter takes a predominantly epidemiological approach
to describing this association, and our concentration is on a systematic review of
studies that have quantified the relationship between activity and/or fitness and
insulin resistance. The level of causal inference from these studies varies and,
as in all other areas of epidemiological enquiry, can be assessed by reference to
the classic Bradford Hill criteria.
1
These include assessment of the strength and
consistency of the association, the degree of dose–response effect and biologi-
cal plausibility. The demonstration of reversibility in a clinical trial contributes
massively to causal inference and also points the way for preventive efforts.
A key question in the context of the design of preventive strategies is whether
the association of inactivity with insulin resistance is similar in all individuals.
If it is, then a population-wide preventive strategy would be most appropriate.
However, if sub-populations were demonstrably more at risk of the metabolic
consequences of sedentary living, then targeted prevention would be a logical
strategy. Thus in this chapter we consider the evidence for heterogeneity of asso-
ciation between different sub-groups in the population. The chapter concludes
with a discussion of major unresolved uncertainties and areas of future enquiry.
Insulin Resistance. Edited by Sudhesh Kumar and Stephen O’Rahilly
2005 John Wiley & Sons, Ltd ISBN: 0-470-85008-6
318 PHYSICAL ACTIVITY AND INSULIN RESISTANCE
12.2 Evidence from observational studies of the association
between physical activity and insulin resistance
Rather than only present data from papers that support the theory that physi-
cal activity is protective against the development of insulin resistance, we have
elected to undertake a more systematic summary. In describing the studies, we
have separated studies in adults (Table 12.1) from those in children and adoles-
cents (Table 12.2). We excluded studies with fewer than 50 adult participants.
We have only included those studies that have a measure of insulin resistance,
either from a euglycaemic hyperinsulinaemic clamp or more indirectly from
insulin measurement at fasting or in an intravenous or oral glucose tolerance
test. This focus on insulin measurement excludes those studies where the out-
come of interest is related to insulin resistance such as measures of glucose
homeostasis or the metabolic syndrome.
12.3 Summary of findings from observational
studies in adults
Table 12.1 shows that a total of 39 cross-sectional studies relating an assessment
of physical activity or fitness to a measure of insulin sensitivity were identi-
fied. Thirty-four of these studies demonstrated that some dimension of physical
activity was inversely associated with fasting insulin or other proxy measures
of insulin resistance. None of the studies found the association to be in the
opposite direction and four of the five inconclusive studies were either small
(Ross
2
(n = 50), Palaniappan et al.
3
(n = 207), Parker et al.
4
(n = 358)) or used
a global assessment of activity,
5
which may have resulted in non-differential
misclassification and attenuation of the true association. Thus, overall the data
suggests that the finding of an inverse association between activity and insulin
resistance is strong and consistent between studies.
In 30 of these cross-sectional studies self-reported or interviewer administered
physical activity questionnaires were used as the main measure of activity. This
concentration on self-report assessment introduces the possibility of recall bias.
This is less likely to be a direct phenomenon than it would be in a study where
individuals with a diagnostic label were being compared with those without,
since people with insulin resistance would tend to be unaware of their condi-
tion. Direct bias of this nature would be much more likely if people with and
without diabetes were being compared, for example. However, it is more likely
in this context that self-report is biased with respect to obesity, which would
in turn create a bias with respect to the outcome of insulin resistance since the
relationship between obesity and insulin sensitivity is so strong. Adjustment for
obesity whilst removing its effect as a confounder would not deal with the issue
of associated recall bias.