Báo cáo khoa hoc:" Attenuating effects of preferential treatment with Student-t mixed linear models: a simulation study" docx
Bạn đang xem bản rút gọn của tài liệu. Xem và tải ngay bản đầy đủ của tài liệu tại đây (963.53 KB, 19 trang )
Original
article
Attenuating
effects
of
preferential
treatment
with
Student-t
mixed
linear
models:
a
simulation
study
Ismo
Strandén
a
Daniel
Gianola
a
Department
of
Animal
Sciences,
University
of
Wisconsin,
Madison,
WI
53706,
USA
b
Animal
Production
Research,
Agricultural
Research
Centre -
MTT,
31600
Jokioinen,
Finland
(Received
14
May
1998;
accepted
16
October
1998)
Abstract -
Preferential
treatment
of
cows
in
four
herds
of
a
multiple
ovulation
and
embryo
transfer
scheme
under
selection
was
simulated.
Prevalence
and
amount
of
preferential
treatment
depended
on
a
function
correlated
with
true
breeding
value.
Three
mixed
effect
linear
models
were
compared
in
terms
of
their
ability
to
handle
preferential
treatment:
the
classical
Gaussian
model,
a
model
with
multivariate
t-
distributed
errors
clustered
by
herd,
and
a
model
with
independent
t-distributed
errors.
In
the
models
with
t-distributed
errors,
both
the
scale
parameters
and
the
degrees
of
freedom
were
considered
unknown.
A
Bayesian
analysis
was
carried
out
for
all
three
models
via
the
Gibbs
sampler,
and
posterior
means
were
used
to
infer
about
genetic
variance,
herd-year
effects,
breeding
values
and
realised
response
to
selection.
Performance
over
repeated
sampling
was
assessed
via
Monte
Carlo
mean
squared
error.
In
the
absence
of
preferential
treatment,
the
three
models
had
a
similar
performance.
When
preferential
treatment
was
prevalent
and
strong,
the
univariate
t-model
was
the
best;
hence,
the
Gaussian
assumption
for
the
errors
was
clearly
inappropriate.
It
appears
that
some
robust
linear
models
can
handle
preferential
treatment
of
animals
better
than
the
standard
mixed
effect
linear
model
with
Gaussian
assumptions.
©
Inra/Elsevier,
Paris
dairy
cattle
/ preferential
treatment
/ simulation
/ Bayesian
statistics
/ Student-t
distribution
/ Gibbs
sampling
*
Correspondence
and
reprints
E-mail:
Résumé -
Atténuation
des
effets
de
traitement
préférentiel
dans
un
modèle
linéaire
mixte
à
distribution
de
Student
(t).
Étude
de
simulation.
On
a
simulé
le
traitement
préférentiel
de
certaines
vaches
dans
quatre
troupeaux
de
sélection
utilisant
la
transplantation
embryonnaire.
La
fréquence
et
l’effet
du
traitement
préférentiel
ont
dépendu
d’une
fonction
corrélée
à
la
valeur
génétique
vraie.
On
a
comparé
trois
modèles
linéaires
mixtes
pour
leur
aptitude
à
prendre
en
compte
le
traitement
préférentiel :
le
modèle
classique
Gaussien,
un
modèle
avec
des
erreurs
t-multivariates
groupées
par
troupeau
et
un
modèle
avec
des
erreurs
t-distribuées
indépendantes.
Dans
le
modèle
où
les
erreurs
suivaient
une
distribution
t,
les
paramètres
d’échelle
et
les
degrés
de
liberté
ont
été
considérés
inconnus.
Une
analyse
bayésienne
a
été
effectuée
pour
les
trois
modèles
à
partir
de
l’échantillonnage
de
Gibbs
et
les
moyennes
a
posteriori
ont
été
utilisées
pour
en
inférer
au
sujet
de
la
variance
génétique,
des
effets
troupeau-année,
des
valeurs
génétiques
et
des
réponses
réalisées
à
la
sélection.
La
performance
des
modèles
a
été
évaluée
au
travers
des
erreurs
quadratiques
moyennes.
En
l’absence
de
traitement
préférentiel,
les
trois
modèles
ont
eu
une
performance
similaire.
Quand
le
traitement
préférentiel
a
été
fréquent
et
d’effet
important,
le
modèle
t-univariate
a
été
le
meilleur
et
le
modèle
Gaussien
a
été
clairement
inadapté.
Il
apparaît
que
des
modèles
linéaires
robustes
peuvent
prendre
en
compte
les
traitements
préférentiels
mieux
que
les
modèles
linéaires
mixtes
Gaussiens
classiques.
@
Inra/Elsevier,
Paris
bovins
laitiers
/
traitement
préférentiel
/
simulation
/
statistique
bayésienne
/
distribution
de
Student
1.
INTRODUCTION
Preferential
treatment
is
any
management
practice
that
is
applied
non-
randomly
to
animals
within
a
contemporary
group
[9].
For
example,
better
housing
and
feeding,
hormonal
treatment,
longer
milking
intervals
on
test
day
and
feeding
according
to
production
are
known
to
be
applied
selectively
in
dairy
production.
Preferential
treatment
occurs
in
dairy
cattle,
presumably
to
increase
the
economic
value
of
a
cow
or
the
probability
that
it
will
be
chosen
as
a
bull-dam.
Several
studies
(e.g.
[17,
20!)
have
found
that
genetic
evaluations
for
milk
yield
are
inconsistent
with
expectations
based
on
theory.
This
may
be
due
to
inadequate
statistical
assumptions
or
failure
to
account
properly
for
selection
or
preferential
treatment
of
cows.
Preferential
treatment
is
often
suspected
when
no
apparent
reasons
exist
for
such
discrepancies.
Kuhn
et
al.
[9]
simulated
effects
of
preferential
treatment
on
’animal
model’
genetic
evaluations.
Mean
squared
error
of
prediction
of
breeding
values
increased
as
the
extent
of
preferential
treatment
increased.
Kuhn
and
Freeman
[10]
found
that
when
the
dam
of
a
sire
was
treated
preferentially,
more
than
30
daughters
with
untreated
records
were
needed
to
offset
the
bias
in
prediction
of
breeding
value
caused
by
the
dam’s
information.
Bias
increased
as
the
proportion
and
number
of
daughters
receiving
preferential
treatment
increased.
Bias
decreased
when
all
daughters
given
preferential
treatment
were
in
the
same
herd;
this
is
so
because
the
’herd-year’
effect
in
the
model
captures
part
of
the
preferential
treatment
administered
in
a
particular
herd-year.
In
order
to
account
for
preferential
treatment,
Harbers
et
al.
[7]
included
an
environmental
correlation
between
related
females
in
a
genetic
evaluation
model
for
a
MOET
(multiple
ovulation
and
embryo
transfer)
scheme.
This
improved
accuracy
of
cow
evaluations
when
preferential
treatment
was
mild.
Weigel
et
al.
[29]
simulated
different
strategies
of
preferential
treatment
and
found
that
it
was
not
possible
to
detect
it
by
monitoring
within-herd
variance;
obviously,
this
parameter
does
not
provide
information
about
the
probability
that
a
cow
within
a
herd
is
treated
preferentially.
Burnside
and
Meyer
[3]
simulated
effects
of
bovine
somatotropin
(bST).
Sire
evaluations
were
least
accurate
when
bST
administration
was
targeted
to
the
best
producing
cows.
In
the
context
of
prediction
(e.g.
!8]),
a
bias
takes
place
when
the
expected
values
of
the
predictand
and
of
the
predi!tor
differ.
Evaluation
of
bias
requires
knowledge
of
the
true
model
but,
in
practice,
this
is
not
available,
so
ad
hoc
assessments
of
bias
have
been
suggested.
Several
studies
[15,
16,
27,
28]
found
upward
’biases’
of
cow’s
pedigree
indexes
for
protein
or
milk
yield
in
Finnish
Ayrshire.
It
is
unclear
if
this
discrepancy
is
due
to
chance,
but
preferential
treatment
of
dams
of
cows
may
be
a
culprit.
On
the
other
hand,
Powell
and
Norman
[19]
found
that
pedigree
indexes
understated
the
first
estimated
breeding
values
of
daughters
of
proven
sires
mated
to
lower
producing
dams.
Little
work
has
been
undertaken
on
how
to
cope
with
preferential
treatment
in
practice,
at
least
from
a
statistical
point
of
view.
Kuhn
and
Freeman
[11]
studied
power
transformations
of
records
but
this
was,
at
best,
slightly
effective
in
reducing
bias
due
to
preferential
treatment.
An
alternative
approach
is
to
consider
an
error
distribution
with
thicker
tails
than
the
normal,
to
allow
for
more
variation.
A
commonly
used
one
is
the
t-distribution,
which
is
symmetric
and
leptokurtic.
It
has
been
advocated
because
of
its
simplicity
[12],
and
because
only
one
parameter
(the
degrees
of
freedom)
is
needed
to
describe
robustness.
A
suitable
robust
distribution
may
be
capable
of
attenuating
the
impact
of
outliers
on
data
analysis.
Many
authors
have
employed
statistical
models
with
t-distributed
residuals
[4,
12,
13,
25,
31]
in
linear
and
non-linear
regression
models,
with
varying
degrees
of
success.
Use
of
the
t-distribution
in
the
context
of
mixed
effects
or
hierarchical
models
is
relatively
recent
!1,
2,
5,
6,
22-24,
26,
30].
Our
objective
was
to
assess
frequentist
properties
of
Bayesian
point
estima-
tors
obtained
from
mixed
linear
models
where
residuals
were
assumed
to
be
either
Gaussian
or
t-distributed.
Milk
production
records
obtained
in
herds
in
which
some
preferential
treatment
was
practised
were
simulated.
The
analy-
sis
focused
on
mean
squared
error
of
estimation
of
genetic
variance,
herd-year
effects,
breeding
values
and
genetic
response
to
selection.
2.
STRUCTURE
OF
THE
SIMULATION
2.1.
Conceptual
population
Milk
production
records
in
a
hypothetical
’adult’
MOET
nucleus
scheme
[18]
were
simulated.
The
scheme
extended
the
simple
hierarchical
mating
structure
of Stranden
et
al.
!21].
Our
modification
allowed
bulls
of
the
previous
generation
to
mate
current
generation
females.
The
nucleus
consisted
of
32
cows
and
eight
bulls
in
every
generation.
In
each
generation,
every
nucleus
cow
produced
(by
multiple
ovulation
and
embryo
transfer
to
recipients)
eight
offspring,
four
females
and
four
males.
An
animal
could
be
selected
only
once
into
the
nucleus
as
a
parent
and
unselected
animals
were
culled.
The
females
were
selected
among
those
offspring
to
the
nucleus
that
had
completed
a
first
lactation.
Males
were
selected
within
those
that
had
been
born
in
the
preceding
generation.
In
practice,
this
would
allow
the
bulls
to
have
a
progeny
test
outside
the
nucleus
before
selection.
However,
such
progeny
testing
was
not
built
in
this
simulation.
Thus,
males
within
a
full-sib
family
had
the
same
estimated
breeding
value
and
three
such
males
were
randomly
discarded.
Each
selected
male
was
mated
to
four
cows,
chosen
randomly
from
those
that
had
been
selected
as
replacements.
.
8
1
32
1
.
Selection
pressure
in
males
and
females
was
32
4
and
2g
= -,
respectively,
32
4
128
4
per
generation.
With
this
scheme
carried
out
for
four
generations,
the
data
included
544
cows
with
records
(32
in
the
base
plus
32
x
4
x
4
=
512
female
progeny)
and
32
sires
with
daughters
in
production,
i.e.
a
total
of
576
animals.
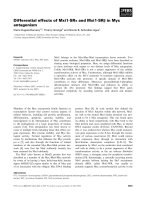
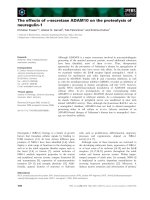
A
diagram
of
the
simulated
population
is
shown
in
figure
1.
Base
generation
cows
were
assigned
to
four
herds
in
equal
numbers,
i.e.
eight
cows
per
herd.
Female
offspring
of
a
cow
remained
in
the
same
herd
as
her
dam,
whereas
sires
were
used
across
herds.
Breeding
values
of
base
animals
were
drawn
at
random
from
N(0,0.25)
distribution.
Records
of
the
base
animals
were
generated
by
adding
a
herd-year
effect
(independently,
normally
distributed)
to
a
breeding
value
and
to
an
independently
drawn
residual
from
N(0,0.75)
distribution.
Records
in
subsequent
generations
were
simulated
similarly,
except
that
the
breeding
value
of
an
individual
was
formed
by
averaging
the
breeding
value
of
its
parents
and
adding
a
N
C0,
2 1L7 u 2(l
F
)J
segregation
residual,
where
a2
is
the
additive
genetic
variance
and
F
is
the
average
inbreeding
coefficient
of
the
parents.
The
selection
criterion
in
the
breeding
scheme
was
BLUP
of
breeding
value
with
the
true
variance
components.
The
statistical
model
included
the
herd-year
as
a
fixed
effect
and
animal
as
a
random
effect
(but
ignored
preferential
treatment,
as
discussed
later)
using
all
genetic
relationships
available
up
to
the
time
of
selection.
2.2.
Preferential
treatment
In
practice,
preferential
treatment
takes
place
in
the
course
of
a
selection
programme
so
this
is
the
way
that
the
present
simulation
proceeded.
None
of
the
base
population
cows
were
treated
preferentially,
so
there
were
512
cows
eligible
to
receive
preferential
treatment.
A
scheme
in
which
the
preferential
treatment
assigned
depended
on
the
’perceived’
breeding
value
of
an
animal
(e.g.
based
on
a
genetic
evaluation
available
before
the
animal
produces
the
record)
was
adopted.
The
records
were
generated
as
where
y
ij
is
the
record
of
animal j
made
in
herd-year
i,
hi
is
a
herd-year
effect,
Uj
is
the
breeding
value
of
animal
j,
and
e
ij
is
an
independent
residual.
The
preferential
treatment
02!
was
a
stochastic
effect
taking
the
values:
where
!(.)
is
the
standard
normal
cumulative
distribution
function,
p
min
is
a
constant
smaller
than
the
herd-year
effect
hi,
and u/j =
!+(u!+v!)
/
afl
+
w
is
a
’value’
function
such
that
Ui
rv
A!(0,er!),
vj
-
N(0,
Q
v),
Cov(u_,,f
j)
=
0,
so
Wj
rv
N(À,
1).
In
the
preceding,
0’
;
is
the
variance
of
breeding
values
and
w
j2
is
an
’uncertainty’
variance.
The
ratio
O’!
2 describes
the
uncertainty
the
herd
!u
manager
has
about
the
true
breeding
value
of
animal
j.
For
example,
if
the
breeder
is
very
uncertain
about
the
breeding
value
of
the
animal,
this
ratio
of
variances
should
be
high.
Three
values
of
the
uncertainty
were
considered,
0’2
1
-
1
=
——,
1,
100.
The
correlation
between
Wj
and
the
breeding
value
Uj
is
/
100
j2
!l/2
C1
1 + ;! 2)-1/2
giving
0.995, 0.71
and
0.10
at
values
of
the
uncertainty
equal
B
!/
to 100’ 1 and
100,
respectively.
100
The
preferential
treatment
scheme
in
equation
(2)
induces
a
correlation
be-
tween
related
animals
Corr(u/j ,
Wjl)
= a JJ ’10’2
u +
2 Cov( 2 v
J’ VI) J
where
ajj,
is
the
tween
related
animals
Corr(iu,,w,’) =
—&dquo;—!—!——&dquo;
v
,
where
a,,’
is
the
a! + a!
additive
relationship
between
animals j
and
j’.
If
the
Vj
deviates
are
inde-
pendent,
then
Corr(u/j ,
u
/j, )
=
a!!!!!!(!u
+
o!)’
For
example,
if j
and
j’are
full-sibs
and
Qz
=
0’;,
say,
then
Corr(’u;_,,u!’)
= !. 4
In
general,
the
higher
the
breeding
value
the
higher
the
amount
preferential
treatment
and
the
chance
of
receiving
it.
The
constant
p
min
in
equation
(2)
controls
the
range
of
production
associated
with
preferential
treatment.
It
was
set
equal
to
-5Qh
where
ah
is
the
standard
deviation
of
herd-year
effects.
These
were
drawn
from
a
normal
distribution
with
mean
zero
and
variance
a 2
and
two
different
values
of
the
herd-year
variance
were
considered:
afl
=
au
and
2
U2
The
constant
A
controls
the
proportion
of
cows
to
be
preferentially
treated.
Normal
distribution
theory
can
be
used
to
find
a
value
of
A
such
that
a
desired
proportion
of
cows
receives
preferential
treatment.
The
proportion
of
preferentially
treated
cows
increases
with
.!,
because
Pr(u/j
>
0)
increases
concomitantly.
Three
different
prevalences
of
preferential
treatment
were
considered:
1 out
of
10,
1 out
of
32,
and
1 out
of
64
cows.
These
correspond
to A
values
of
-1.2816,
-1.8627
and
-2.1539,
respectively.
It
was
intended
to
keep
the
proportion
of
preferentially
treated
animals
roughly
constant
from
generation
to
generation.
To
do
so,
it
must
be
noted
that
selection
is
expected
to
increase
mean
breeding
value
and
to
reduce
genetic
variance
over
time.
In
order
to
account
for
these
effects,
the
formula
for
w
was
changed
to:
where
u
is
the
mean
breeding
value
of
animals
available
for
preferential
treatment
in
the
generation
to
which
animal j
belongs,
and
Su
is
the
additive
genetic
variance
for
individuals
born
in
that
generation.
The
probability
distribution
of
the
amount
of
preferential
treatment
(Di!)
depends
on
the
values
of
Qh
and A
as
shown
in
the
Appendix.
The
average
amount
of
preferential
treatment
actually
applied
was
assessed
via
a
simula-
tion
of
1000
replicates
of
the
MOET
scheme.
Mean
increase
(mean
of
0)
in
production
due
to
preferential
treatment
under
varying
prevalence
of
prefer-
ential
treatment
and
amount
of
herd-year
variance
is
in
table
I.
As
intended,
production
increased
with
prevalence
of
preferential
treatment,
and
with
or h* 2
Average
value
of
preferential
treatment
was
not
affected
by
level
of
uncertainty
j2
2 .
This
is
not
shown
in
table
1,
but
it
was
expected
because
the
distribution
Q!
of
A
zj
does
not
depend
on
this
ratio.
Table
I.
Average
increase
in
simulated
lactation
production
due
to
preferential
treatment
as
a
function
of
herd-year
variance
(a
h)
and
of
prevalence
of
preferential
treatment
(values
in
parenthesis
are
Monte
Carlo
standard
errors
from
1 000
replicates
of
the
MOET
scheme,
au
= additive
genetic
variance).
2.3.
Statistical
models
and
computations
Three
linear
statistical
models
were
compared,
both
with
and
without
pref-
erential
treatment
incorporated
in
the
simulation.
The
objective
was
to
assess
the
relative
ability
of
these
models
to
handle
perturbations
caused
by
unknown
preferential
treatment.
In
all
three
models,
the
linear
structure
for
the
records
included
an
unknown
herd-year
effect
(treated
as
fixed
computationally),
the
unknown
breeding
value
of
the
cow
and
a
residual,
distributed
according
to
an
appropriate
error
distribution,
as
noted
below.
In
the
three
models,
a
multivari-
ate
normal
distribution
N(0,
Aa!),
where
A
is
a
576
x
576
relationship
matrix,
was
used
for
the
genetic
effects,
so
there
was
no
difference
in
this
respect.
The
three
models,
differing
only
in
the
error
distribution
were
the
following.
1)
G:
a
purely
Gaussian
model
with
errors
Niid(0,
Q
e ).
2)
t-l:
errors
were
independently
and
identically
distributed
as
univariate-t,
ti
(0,
0’ e 2,
v,).
Here,
the
variance
of
the
distribution
is
U2V
,I(V,
e
-
2),
where
Qe
is
a
scale
parameter
and
v,
are
the
unknown
degrees
of
freedom.
3)
t-H:
within
herd
i (i
=
1,
2,
3,
4),
the
error
vector
ei
had
the
multivariate-
t
distribution
t
ni
(0,
I
ni
U2
,
ve)
where
ni
is
the
number
of
records
in
herd
i.
Here,
Var(e
i)
=
I!o!fe/(fe - 2).
Although
the
errors
are
uncorrelated,
they
are
not
independent,
this
being
a
property
of
the
multivariate
t-distribution.
Error
vectors
in
different
herds
were
mutually
independent,
however,
but
with
the
same
or
and
ve
parameters.
We
refer
to
this
model
as
a
’herd-clustered’
one.
The
G
model
is
the
usual
one;
model
t-1
discounts
outliers
y
zj
on
a
’case’
by
’case’
basis,
and
model
t-H
discounts
outlying
vectors
yz
for
the
entire
herd
i.
Because
the
’value
function’
w!
used
to
generate
preferential
treatment
does
not
depend
on
the
herd,
there
is
no
apparent
reason
why
model
t-H
should
outperform
model
t-1.
It
should
be
noted
that
as
Ve
-j
oo,
the
two
t-distributions
tend
towards
the
Gaussian
one.
A
Bayesian
structure
was
adopted
for
inference.
Prior
distributions
were
the
same
for
all
three
models.
Herd
effects
were
assigned
a
uniform
prior
and,
as
noted,
a
multivariate
normal
process
was
used
as
a
prior
distribution
for
the
breeding
values.
The
dispersion
components
Qu
and
Qe
were
assigned
inde-
pendent
scaled
inverted
chi-square
distributions
with
four
degrees
of
freedom
and
mean
equal
to
the
true
variance
component,
i.e.
0.75
for
the
residual
vari-
ance
and
0.25
for
the
genetic
variance.
In
the
t-models,
the
prior
for
a
is
for
the
scale
of
the
distribution
and
not
for
the
residual
variance,
which
is
a e
2v
,l(v, -
2)
as
noted
before.
In
the
two
models
involving
the
t-distribution,
the
residual
degrees
of
freedom
parameter
v,
was
considered
unknown.
Degrees
of
freedom
values
allowed
in
the
herd-clustered
t-model
were
4,
10,
100
or
1
000,
all
equally
likely,
a
priori.
In
the
univariate
t-distribution
model,
the
space
of v
e
was
4, 6,
8,
10,
12
or
14,
all
receiving
equal
prior
probability.
These
values
were
chosen
arbitrarily.
It
is
possible
to
use
a
continuous
prior
for
v,
[23]
but
the
discrete
distribution
employed
here
facilitated
implementation.
A
Gibbs
sampler
was
used
to
carry
out
the
Bayesian
computations
employing
the
full
conditional
distributions
described
in
Strandén
[22].
Tests
made
in
several
sim-
ulations
with
varying
starting
values
indicated
that
a
burn-in
period
of
7 000
iterates
with
70 000
Gibbs
iterates
thereafter
(all
samples
kept)
was
enough
to
obtain
sufficiently
precise
estimates
of
posterior
means
of
the
parameters.
About
60
min
of
CPU
time
were
required
to
perform
70 000
iterations,
for
any
of
the
models,
in
an
HP
9 000(3)
computer.
2.4.
Frequentist
comparison
Each
replicate
of
the
simulation
consisted
of
a
data
set
generated
as
per
the
scheme
in
figure
1
under
the
appropriate
assumptions
of
preferential
treatment.
A
Bayesian
analysis
of
the
data
set
according
to
each
of
the
three
models
was
carried
out
in
each
replicate.
Mean
squared
errors
of
posterior
mean
estimates
were
computed,
over
replicates,
for:
a)
genetic
variance,
b)
herd-year
effects,
and
c)
breeding
values.
Mean
squared
errors
were
also
computed
for
three
classes
of
breeding
values:
sires,
cows
who
had
been
preferentially
treated
and
cows
without
preferential
treatment.
d)
An
additional
end-point
of interest
was
mean
squared
error
of
estimated
response
to
selection,
assessed
by
predicting
breeding
values
using
posterior
means
from
the
three
models
contrasted.
’True’
response
was
the
mean
difference
in
true
breeding
value
(due
to
selection
using
BLUP)
between
animals
born
in
the
last
generation
and
those
born
in
the
first
generation.
Differences
in
mean
squared
errors
between
models
should
reflect
the
relative
accuracy
of
estimation
of
genetic
trend.
A
’pilot
run’
[14]
was
conducted
to
assess
the
number
of
replicates
needed
to
attain
enough
precision
for
a
parameter
of
interest.
The
approximate
number
of
replications
required
to
achieve
an
absolute
precision
r
for
the
confidence
interval
given
a
pilot
run
of
n
replicates
was
found
using:
where
ti-1,1-
a/2
is
the
value
of
a
t-distribution
with
i -1
degrees
of
freedom
at
the
100(1 -
a)
percentile
(’confidence’).
Our
pilot
study
consisted
of
carrying
n
=
20
replicates
for
each
of
the
three
models.
The
number
of
replications
re-
quired
to
achieve
0.05
precision
with
95
%
confidence
for
the
genetic
variance
was
less
than
60
for
most
cases.
Hence,
it
was
decided
that
all
cases
would
be
replicated
60
times.
Absolute
precision
was
recalculated
after
60 replicates,
and
a
further
40
replicates
were
made
for
the
schemes
involving
1/10
preva-
lence
of
preferential
treatment.
One
scheme
92
2 =
3, -—
2 = 100 )
required
an
(
a2 a2
1)
u u
100
/
additional
40
replicates
to
achieve
the
required
precision.
Table
II indicates
the
schemes
and
number
of
replicates
performed
Because
of
its
heavy
computing
requirements,
the
analysis
was
performed
using
a
network
of
machines
administered
by
Professor
Miron
Livny
of
the
Department
of
Computer
Science,
University
of
Wisconsin
at
Madison.
This
cluster
was
accessed
using
the
Condor
system,
which
allows
running
jobs
simultaneously
at
many
computers
while
the
data
and
program
reside
in
one
computer.
Each
replicate
of
each
model
was
a
process
to
be
executed
in
this
network
of
computers.
There
were
between
10
and
15
computers
available
at
any
time,
giving
at
least
a
10-fold
increase
in
computing
power
compared
to
using
only
the
HP9000(3).
3.
RESULTS
AND
DISCUSSION
3.1.
Absence
of
preferential
treatment
The
objective
here
was
to
examine
possible
losses
in
efficiency
due
to
using
the
two
t-distribution
models
when
there
is
no
preferential
treatment
and
the
Gaussian
assumption
holds
throughout.
Averages
and
mean
squared
errors
of
estimates
of
additive
genetic
variance
are
given
in
table
III.
The
posterior
means
of
afl
for
each
of
the
three
models
were
practically
unbiased,
in
light
of
the
Monte
Carlo
variation.
However,
the
mean
squared
error
was
larger
for
the
two
t-models
than
for
the
Gaussian
one.
Hence,
if
the
Gaussian
assumption
holds,
posterior
means
of
additive
genetic
variance
for
the
t-models
are
less
accurate
than
those
from
the
G-model.
The
increase
in
mean
squared
error
over
the
Gaussian
model
was
about
5-6
%
for
the
t-H
model,
and
7-18
%
for
the
t-1
model.
Tables
IV and
Vgive
the
posterior
distributions
of
the
degrees
of
freedom
for
the
two
t-models
in
the
absence
of
preferential
treatment.
The
analysis
carried
out
with
the
herd-clustered
t-model
clearly
favoured
a
model
with
Gaussian
errors,
as
indicated
by
a
posterior
probability
of
about
90
%
for
the
degrees
of
freedom
being
larger
than
10.
Also,
the
univariate
t-model
assigned
the
highest
posterior
probability,
about
40
%,
to
the
largest
value
of
the
degrees
of
freedom
(v
e
=
14)
considered.
The
posterior
distributions
were
not
sharp,
this
being
a
function
of
the
low
informational
content
the
data
have
about
ve.
However,
both
analyses
favoured
the
larger
values
of v
e
or,
equivalently,
the
Gaussian
assumption
for
the
errors.
For
example,
in
the
herd-clustered
t-model,
the
posterior
odds
ratio
of
v,
=
1000
relative
to
v,
=
4
was
17.7
and
29:7
for
2 =
1 and
ah
2 =
3,
respectively.
In
the
univariate
t-model,
the
odds
ratio
(
Ju
(Ju
of
v,
=
14
relative
to
ve
=
4
was
384
and
404
for
the
two
values
of
the
ratio
between
herd
and
additive
genetic
variances.
Mean
squared
errors
of
estimates
of
location
parameters
were
similar
in
all
models
(table
VI! ,
although
slightly
smaller
for
the
G-model.
As
expected,
mean
squared
errors
were
larger
for
breeding
values
of
cows
(smallest
amount
of
information)
than
for
sires.
When
herd-year
variance
was
large,
relative
to
the
additive
genetic
variance,
mean
squared
error
of
estimation
of
breeding
values
increased.
When
estimating
realised
response
to
selection,
the
mean
squared
errors
were
0.031
(G
model),
0.030
(t-H
model)
and
0.029
(t-1
model).
In
summary,
in
the
absence
of
preferential
treatment
and
with
the
Gaussian
assumption
holding
throughout,
the
t-models
were
less
accurate
for
estimation
of
Q!,
but
were
as
competitive
as
the
Gaussian
model
for
estimation
of
breeding
values
and
of
genetic
trend.
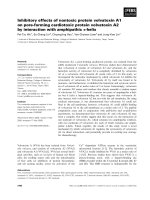
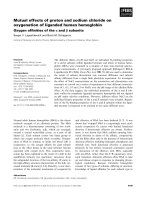
3.2.
Preferentially
treated
data
3.2.1.
Additive
genetic
variance
Mean
squared
error
of
estimates
of
additive
genetic
variance
are
in
figure
2.
Differences
between
models
were
clearest
when
preferential
treatment
was
more
prevalent
(1/10)
and
when
the
herd-year
variance
was
high
(this
affects
the
distribution
of
0).
Also,
differences
between
models
were
largest
when
uncertainty
about
true
breeding
values
was
low,
so
the
value
function
is
a
high
correlate
of
breeding
value.
There
was
little
difference
between
the
G
and
the
t-H
models,
but
the
univariate
t-model
had
the
best
performance
when
prevalence
of
preferential
treatment
was
medium
(1 out
of
32
cows)
or
high
(1 out
of
10
cows).
The
univariate
t-model
was
robust
to
variation
in
the
uncertainty
parameter;
this
was
not
the
case
for
the
G
and
the
t-H
models,
whose
performance
was
hampered
under
severe
forms
of
preferential
treatment.
3.2.2.
Posterior
distribution
of
the
degrees
of
freedom
Posterior
probabilities
of
the
degrees
of
freedom
under
the
herd-clustered
t-model
were
often
higher
for
the
larger
values
of
ve,
thus
supporting
the
Gaussian
model,
especially
when
preferential
treatment
was
uncommon,
or
uncertainty
was
high.
Only
under
medium
(1/32)
or
high
(1/10)
prevalence
of
preferential
treatment
and
a
high
herd-year
variance
the
largest
values
of
the
degrees
of
freedom
did
not
have
the
highest
posterior
probability.
However,
this
depended
on
the
level
of
uncertainty
and
on
the
amount
of
herd-year
variance.
For
example,
when
prevalence
of
preferential
treatment
was
1/10
and
with
(
T2
=
3a’,
low
values
of
the
degrees
of
freedom
had
higher
posterior
probabilities
when
uncertainty
was
low;
however,
as
uncertainty
increased,
the
posterior
distribution
tended
to
favour
larger
values
of
the
degrees
of
freedom.
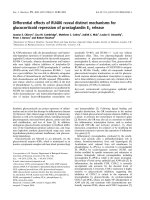
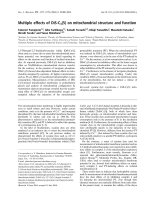
Posterior
probabilities
of
v,
for
the
univariate
t-model
are
given
in
figure
3.
Here,
posterior
distributions
tended
to
be
flat.
Higher
probabilities
were
as-
signed
to
the
largest
values
of
the
degrees
of
freedom
only
when
preferential
treatment
was
rare
and
the
herd-year
variance
low.
As
in
the
herd-clustered
t-model,
high
uncertainty
often
resulted
in
higher
probabilities
assigned
to
the
highest
degrees
of
freedom
values,
as
one
would
expect.
However,
other
degrees
of
freedom
values
also
received
relatively
high
probabilities.
When
preferen-
tial
treatment
was
prevalent
(1/10)
and
the
herd-year
variance
was
large,
the
posterior
distribution
was
sharp,
with
a
modal
value
of
ve
=
4
at
all
levels
of
uncertainty.
This
points
away
from
a
Gaussian
distribution
of
the
residuals.
With
a
small
data
set
such
as
the
one
in
this
simulated
MOET
scheme,
one
should
not
expect
the
posterior
distribution
of
the
degrees
of
freedom
param-
eter
to
be
highly
peaked.
Nevertheless,
the
univariate
t-model
recognised
the
non-Gaussian
situation
even
when
prevalence
was
rare
(1/64),
provided
that
the
variance
between
herds
was
relatively
large.
This
is
because
the
expected
value
of
the
preferential
treatment,
E(Di!),
increased
with
or2 h,
as
illustrated
in
table
I.
3.2.3.
Estimates
of
herd-year
effects,
breeding
values
and
genetic
response
to
selection
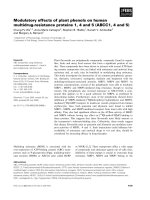
Average
of
mean
squared
error
of
estimates
of
herd-year
effects
was
similar
for
the
three
models
except
when
preferential
treatment
was
prevalent
or
herd-
year
variance
was
high,
but
it
was
always
smallest
for
the
univariate
t-model
(figure
l!).
When
preferential
treatment
was
common
(1/10),
the
univariate
t-model
clearly
had
the
smallest
mean
squared
error
at
each
level
of
uncertainty
and
value
of
o,2 It
*
The
average
of
mean
squared
error
of
estimates
of
all
breeding
values
is
shown
in
figure
5.
This
criterion
was
about
the
same
with
all
models
except
when
preferential
treatment
was
common
and
the
herd-year
variance
high.
Here,
when
uncertainty
was
high,
there
were
no
differences
between
the
models,
but
at
low
levels
of
uncertainty,
the
univariate
t-model
was
markedly
superior.
The
picture
for
mean
squared
errors
of
estimates
of
sire
and
cow
breeding
values
and
for
genetic
response
was
similar
to
that
for
of
all
breeding
values,
so
the
figures
are
not
presented.
In
all
cases,
differences
between
models
were
clear,
favouring
the
univariate
t-model
when
preferential
treatment
was
more
prevalent
(1/10).
The
same
was
true
for
preferentially
treated
cows
(figure
6),
but
mean
squared
errors
were
larger
than
for
breeding
values
of
cows
that
were
not
treated
preferentially.
The
univariate
t-model
had
a
similar
or
slightly
worse
performance
than
the
Gaussian
or
herd-clustered
models
when
preferential
treatment
was
rare
or
mildly
prevalent,
but
it
was
superior
when
such
treatment
was
common.
In
particular,
at
the
lowest
level
of
uncertainty
and
at
the
highest
herd-year
variance,
the
univariate
t-model
gave
predictions
of
breeding
value
of
preferentially
treated
cows
that
had
a
mean
squared
error
of
about
a
third
of
that
observed
with
the
Gaussian model.
In
this
situation,
the
herd-clustered
.
model
improved
estimates
somewhat
relative
to
the
Gaussian
model.
4.
CONCLUSIONS
In
the
absence
of
preferential
treatment,
the
t-models
were
as
good
as
the
Gaussian
model
for
estimating
breeding
values
and
response
to
selection.
When
preferential
treatment
was
mildly
prevalent
(1/32)
the
models
performed
simi-
larly.
However,
when
preferential
treatment
was
common
(1/10)
and
especially
when
the
herd-year
variance
was
large
relative
to
the
additive
genetic
variance,
the
univariate
t-model
was
clearly
the
best,
at
least
in
terms
of
mean
squared
error.
Under
preferential
treatment,
the
posterior
distribution
of
the
degrees
of
freedom
in
the
univariate
t-model
pointed
away
from
the
correctness
of
the
Gaussian
assumption.
The
univariate
t-model
was
quite
robust
to
variation
in
the
simulation
parameters,
but
it
is
unknown
whether
this
robustness
holds
across
different
forms
of
preferential
treatment.
This
simulation
could
not
differentiate
clearly
between
the
Gaussian
and
the
herd-clustered
t-models,
although
the
latter
was
always
slightly
better
under
preferential
treatment.
A
reason
for
the
lack
of
difference
between
these
two
models
may
be
the
low
number
of
herds
in
the
simulation.
With
a
few
clusters
(herds)
the
statistical
information
about
the
degrees
of
freedom
is
low,
so
the
posterior
distribution
of
this
parameter
cannot
be
estimated
accurately.
In
conclusion,
it
appears
that
the
univariate
t-model
can
attenuate
adverse
effects
of
preferential
treatment
as
applied
here.
It
leads
to
better
inferences
about
breeding
values
and
genetic
trends
than
those
obtained
with
the
Gaussian
model,
especially
when
preferential
treatment
is
prevalent,
at
least
under
the
conditions
of
the
study.
If,
on
the
other
hand,
preferential
treatment
is
non-
existent,
or
the
assumption
of
a
Gaussian
distribution
of
the
residuals
seems
to
be
true,
there
is
little
loss
in
efficiency
from
using
a
robust
model,
such
as
the
univariate
t.
It
is
encouraging
that
a
symmetric
error
distribution,
such
as
Student
t,
improved
upon
the
Gaussian
one
under
a
single-tailed
form
of
preferential
treatment
as
in
equation
(2).
This
suggests
that
a
robust
asymmetric
distribution
may
do
even
better,
but
perhaps
at
the
expense
of
conceptual
and
computational
simplicity.
ACKNOWLEDGEMENT
We
wish
to
thank
W.G.
Hill,
University
of
Edinburgh,
for
some
useful
comments.
REFERENCES
[1]
Albert
J.H., Chib
S., Bayesian
analysis
of
binary
and
polychotomous
response
data,
J.
Am.
Stat.
Assoc.
88
(1993)
669-679.
[2]
Besag
J.,
Green
P.,
Higdon
D.,
Mengersen
K.,
Bayesian
computation
and
stochastic
systems,
Stat.
Sci.
10
(1995)
3-66.
[3]
Burnside
E.B.,
Meyer
K.,
Potential
impact
of
bovine
somatotropin
on
dairy
sire
evaluation,
J.
Dairy
Sci.
71
(1988)
2210-2219.
[4]
Geweke
J.,
Bayesian
treatment
of
the
independent
Student-t
linear
model,
J.
Appl.
Econometrics
8
(1993)
S19-S40.
[5]
Gianola
D.,
Stranden
I.,
Foulley
J.L.,
Modelos
lineales
con
distribuciones
t:
potencial
en
genetica
quantitativa,
Actas,
5ta
Conferencia
Espanola
de
Biometria,
Valencia,
Spain,
1995,
pp.
3-4.
[6]
Gianola
D.,
Sorensen
D.,
A
mixed
effects
threshold
model
with
a
t
distri-
bution,
47th
Annual
Meeting
of
the
European
Association
for
Animal
Production,
Lillehammer,
Norway,
1996,
15
p.
[7]
Harbers
A.G.F.,
Lohuis
M.M.,
Dekkers
J.C.M.,
Correction
for
preferential
treatment
of
MOET
families
by
including
an
environmental
correlation
in
genetic
evaluation,
in:
Proceedings
of
the
5th
World
Congress
on
Genetics
Applied
to
Livestock
Production,
Guelph,
Canada,
1994,
vol.
17,
pp.
11-14.
[8]
Henderson
C.R.,
Applications
of
Linear
Models
in
Animal
Breeding,
University
of
Guelph, Guelph,
Ontario,
Canada,
1984.
[9]
Kuhn
M.T.,
Boettcher
P.J.,
Freeman
A.E.,
Potential
biases
in
predicted
transmitting
abilities
of
females
from
preferential
treatment,
J.
Dairy
Sci.
77
(1994)
2428-2437.
[10]
Kuhn
M.T.,
Freeman
A.E.,
Biases
in
predicted
transmitting
abilities
of
sires
when
daughters
receive
preferential
treatment,
J.
Dairy
Sci.
78
(1995)
2067-2072.
[11]
Kuhn
M.T.,
Freeman
A.E.,
Power
transformations
for
reducing
bias
in
ge-
netic
evaluation
caused
by
preferential
treatment,
J.
Dairy
Sci.
(Abstr.)
(1996)
suppl.
1,
143.
[12]
Lange
K.L.,
Little
R.J.A.,
Taylor
J.M.G.,
Robust
statistical
modeling
using
the
t
distribution,
J.
Am.
Stat.
Assoc.
84
(1989)
881-896.
[13]
Lange
K.,
Sinsheimer
J.S.,
Normal/Independent
distributions
and
their
ap-
plications
in
robust
regression,
J.
Comp.
Graph.
Stat.
2
(1993)
175-198.
[14]
Law
A.M.,
Kelton
W.D.,
Simulation
Modeling
and
Analysis,
McGraw-Hill,
New
York,
1982.
[15]
Lidauer
M.,
Mdntysaari
E.A.,
Detection
of
bias
in
animal
model
pedigree
indices
of
heifers,
Agric.
Food
Sci.
Finland
5
(1996)
387-397.
[16]
Mdntysaari
E.A.,
Sillanpaa
M.,
Bias
in
pedigree
indices
of
dairy
bulls:
Should
the
management
group
effects
be
fixed
and
should
we
use
smaller
heritability?,
44
th
Annual
Meeting
of
the
European
Association
for
Animal
Production,
Aarhus,
Denmark,
1993,
Abstracts
I,
pp.
236-237.
[17]
Murphy
P.A., Everett
R.W., Van
Vleck
L.D.,
Comparison
of
first
lactations
and
all
lactations
of
dams
to
predict
sons’
milk
evaluation,
J.
Dairy
Sci.
65
(1982)
1999-2005.
[18]
Nicholas
F.W.,
Smith
C.,
Increased
rates
of
genetic
change
in
dairy
cattle
by
embryo
transfer
and
splitting,
Anim.
Prod.
36
(1983)
341-353.
[19]
Powell
R.L.,
Norman
H.D.,
Accuracy
of
cow
indexes
according
to
repeata-
bility,
evaluation,
herd
yield,
and
registry
status,
J.
Dairy
Sci.
71
(1988)
2232-2240.
[20]
Rothschild
M.F.,
Douglass
L.W.,
Powell
R.L.,
Prediction
of
son’s
modified
contemporary
comparison
from
pedigree
information,
J.
Dairy
Sci.
64
(1981)
331-341.
[21]
Stranden
L,
Mdki-Tanila
A.,
Mdntysaari
E.A.,
Genetic
progress
and
rate
of
inbreeding
in
a
closed
adult
MOET
nucleus
under
different
mating
strategies
and
heritabilities,
J.
Anim.
Breed.
Genetics
108
(1991)
401-411.
[22]
Stranden
L,
Robust
mixed
effects
linear
models
with
t
distributions
and
application
to
dairy
cattle
breeding,
Ph.D.
thesis,
University
of
Wisconsin,
Madison,
1996.
[23]
Stranden
I.,
Gianola
D., Gaussian
versus
Student-t
mixed
effects
linear
mod-
els
for
milk
yield
in
Ayrshire
cattle,
48th
Annual
Meeting
of
the
European
Association
for
Animal
Production,
Vienna,
1997,
Abstracts
1,
pp.
262-263.
[24]
Stranden
I,
Gianola
D.,
Inferences
about
variance
components
in
the
univari-
ate
mixed
linear
t
model
using
Laplacian-t
approximations,
in:
Proceedings
of
the
6th
World
Congress
on
Genetics
Applied
to
Livestock
Production,
Armidale,
Australia,
1998, vol.
25,
pp.
537-540.
[25]
Sutradhar
B.C.,
Ali
M.M.,
Estimation
of
the
parameters
of
a
regression
model
with
a
multivariate
t
error
variable,
Comm.
Stat.
Theory
Meth.
15
(1986)
429-450.
[26]
Tempelman
R.J.,
Firat
M.Z.,
Beyond
the
linear
mixed
model:
perceived
versus
real
benefits,
Proceedings
of
the
6th
World
Congress
on
Genetics
Applied
to
Livestock
Production,
Armidale,
Australia,
1998,
vol.
25,
pp.
605-612.
[27]
Uimari
P.,
Mantysaari
E.A.,
Repeatability
and
bias
of
estimated
breeding
values
for
dairy
bulls
and
bull
dams
calculated
from
animal
model
evaluations,
Anim.
Prod.
57
(1993)
175-182.
[28]
Uimari
P.,
Mantysaari
E.A.,
Relationship
between
bull
dam
herd
character-
istics
and
bias
in
estimated
breeding
values
of
bull,
Agric.
Sci.
Finland
4
(1995)
463-472.
[29]
Weigel
D.J.,
Pearson
R.E.,
Hoeschele
I.,
Impact
of
different
strategies
and
amounts
of
preferential
treatment
on
various
methods
of
bull-dam
selection,
J.
Dairy
Sci.
77
(1994)
3163-3173.
[30]
West
M.,
Outlier
models
and
prior
distributions
in
Bayesian
linear
regression,
J.
Roy.
Statist.
Soc.
B
46
(1984)
431-439.
[31]
Zellner
A.,
Bayesian
and
non-Bayesian
analysis
of
the
regression
model
with
multivariate
Student-t
error
terms,
J.
Am.
Stat.
Assoc.
71
(1976)
400-405.
APPENDIX:
Distribution
of
the
preferential
treatment
variable
When
w!
is
positive
and
very
large,
A
ij
tends
to hi - pm,n,
so
in
this
case
equation
(1)
becomes:
When
w!
is
negative,
6.ij
=
0,
as
indicated
in
(1)
so
y
ij
= h
2
+
uj
+
e!.
Hence,
given
hi,
the
range
in
production
records
due
to
preferential
treatment
is
expected
to
be
hi -
pm
in
= hi
+
5
Qh
=
(Zi
+
5)Œ
h
where
zi
N
N(0, 1).
Unconditionally,
the
expected
range
is
then
5o
h.
For
6.ij
defined
in
equation
(2),
the
average
preferential
treatment
applied,
conditionally
on
hi
would
be
where
0,B
(.)
is
normal
density
with
mean A
and
variance
1.
For
A
=
0,
OA
(-)
is
the
standard
normal
density
0(.).
Because
If z
00
4)(w)o(w)dw
=
24)’(z) I
and
!(0)
=
1,
it
follows
that
2
so
E(A
jj
)
=
E(E(02!!hi)) _ -!Jmin·
Likewise,
E(!7jlhi)
=
24
(h -Pmin)
2
for
A
=
0.
Thus,
!
With
pm
;&dquo;
_
-5(]’
h,
we
have
E(Di!)
=
1.875(]’
h
and
Var(02!) !
4.068(]’!.
Then,
C.V.(Aij) !!
108
%
when
50
%
of
the
cows
receive
preferential
treatment.