Báo cáo khoa hoc:"Breeding values for identified quantitative trait loci under selection" ppsx
Bạn đang xem bản rút gọn của tài liệu. Xem và tải ngay bản đầy đủ của tài liệu tại đây (869.42 KB, 16 trang )
Original
article
Breeding
values
for identified
quantitative
trait
loci
under
selection
Jack
C.M.
Dekkers
Department
of
Animal
Science,
225C
Kildee
Hall,
Iowa
State
University,
Ames,
IA,
50011,
USA
(Received
26
March
1999;
accepted
6
July
1999)
Abstract -
The
use
of
an
identified
quantitative
trait
locus
(QTL)
in
selection
requires
the
integration
of
breeding
values
(BV)
for
the
known
QTL
with
estimates
of
polygenic
BV.
For
a
QTL
with
two
alleles,
BV
for
the
QTL
are
traditionally
based
on
the
allele
substitution
effect,
a
=
a
+
d(q -
p),
where
a
and
d
are
additive
and
dominance
effects,
and
p
and
q are
gene
frequencies
in
the
current
generation.
It
is
shown
here
that
to
maximize
single
generation
response,
BV
for
a
QTL
with
dominance
must
be
derived
based
on
gene
frequencies
among
selected
mates
rather
than
frequencies
in
the
current
(unselected)
generation.
Because
selection
affects
gene
frequencies
that
in
turn
affect
optimal
BV
for
the
QTL,
gene
substitution
effects
must
be
derived
numerically.
Response
from
selection
on
optimized
versus
standard
BV
for
the
QTL
was
evaluated
for
a
range
of
parameters.
Benefits
of
optimal
selection
were
greatest
for
intermediate
gene
frequency
and
increased
with
a
magnitude
of
additive
and dominance
effects
up
to
9
%.
Extra
response
was
negligible
for
gene
frequencies
less
than
0.05
or
greater
than
0.85.
In
conclusion,
strategies
for
marker-
assisted
selection
that
aim
to
maximize
short-term
response
must
account
for
the
effects
of
dominance
and
changes
in
gene
frequency
at
the
QTL
on
performance
of
future
progeny.
©
Inra/Elsevier,
Paris
marker-assisted
selection
/
dominance
/
breeding
values
/
quantitative
trait
loci
Résumé -
Valeurs
génétiques
pour
des
loci
quantitatifs
identifiés
en
situation
de
sélection.
L’utilisation
d’un
locus
quantitatif
(QTL)
identifié
en
sélection
nécessite
l’intégration
des
valeurs
génétiques
(BV)
pour
le
QTL
connu
avec
les
estimées
des
BV
polygéniques.
Pour
un
QTL
avec
deux
allèles,
les
BV
à
un
QTL
sont
traditionnellement
basées
sur
l’effet
de
substitution
allélique,
a
=
a
+
d(q -
p),
où
a
et
d
sont
les
effets
additifs
et
de
dominance
et
où
p
et
q sont
les
fréquences
géniques
à
la
génération
présente.
On
montre
ici
que pour
maximiser
la
réponse
à
une
seule
génération
de
sélection,
les
BV
pour
un
QTL
avec
dominance
doivent
être
calculées
à
partir
des
fréquences
géniques
parmi
les
conjoints
sélectionnés
plutôt
que
des
fréquences
dans
la
génération
présente
non
sélectionnée.
Parce
que
la
sélection
E-mail:
affecte
les
fréquences
géniques
qui
à
leur
tour
affectent
les
BV
optimales
pour
le
QTL,
les
effets
de
substitution
de
gènes
doivent
être
calculés
numériquement.
La
réponse
à
la
sélection
sur
la
valeur
génétique
optimisée
ou
classique
pour
le
QTL
a
été
évaluée
pour
une
série
de
paramètres.
Les
bénéfices
de
la
sélection
optimale
ont
été
plus
importants
pour
les
fréquences
de
gène
intermédiaires
et
ont
augmenté
jusqu’à
9
%
avec
l’importance
des
effets
additifs
et
de dominance.
La
réponse
supplémentaire
a
été
négligeable
pour
les
fréquences
géniques
inférieures
à
0,05
ou
supérieures
à
0,85.
En
conclusion,
les
stratégies
de
sélection
assistée
par
marqueurs
qui
maximisent
la
réponse
à
court
terme
doivent
tenir
compte
des
effets
de
dominance
et
des
changements
de
fréquence
génique
au
QTL
sur
la
performance
de
la
descendance
future.
©
Inra/Elsevier,
Paris
sélection
assistée
par
marqueurs
/
dominance
/
valeur
génétique
/
locus
quanti-
tatif
1.
INTRODUCTION
Permanent
genetic
improvement
for
quantitative
traits
is
created
by
selection
on
the
additive
effects
of
genes
that
affect
the
trait
of
interest.
Additive
effects
are
termed
breeding
values
and
form
the
basis
for
genetic
improvement
programs
in
livestock
and
plants.
An
individual’s
breeding
value
is
defined
as
the
expected
performance
of
progeny
under
random
mating
(4!.
Selection
can
be
made
on
estimates
of
the
collective
additive
effects
of
genes
on
the
trait
without
knowledge
of
the
genes
involved.
Such
estimated
breeding
values
(EBV)
can
be
derived
based
on
phenotypic
records
of
the
individual
and
its
relatives.
To
date,
most
programs
for
improvement
of
additive
genetic
merit
in
livestock
and
plants
have
relied
on
selection
based
on
EBV
derived
from
phenotypic
records.
Increasingly,
however,
information
is
becoming
available
on
the
effects
of
individual
genes
that
affect
quantitative
traits,
so-called
quantitative
trait
loci
(QTL).
Information
on
QTL
can
be
combined
with
EBV
derived
from
phenotypic
records
to
improve
rates
of
genetic
improvement.
Use
of
information
from
identified
QTL
(major
genes)
in
selection
for
quantitative
traits
was
first
described
by
Neimann-Sorensen
and
Robertson
[13].
They
developed
procedures
to
weight
information
from
an
identified
QTL
with
phenotypic
information
using
selection
index
procedures
(8!,
based
on
the
amount
of
genetic
variance
explained
by
the
QTL.
Smith
[15]
and
Smith
and
Webb
[16]
extended
these
procedures
and
compared
the
rates
of
response
from
one
generation
of
selection
on
this
index
to
the
response
from
selection
on
phenotypic
information
alone.
Lande
and
Thompson
[10]
derived
selection
criteria
combining
information
from
genetic
markers
linked
to
QTL
with
phenotypic
information,
using
the
selection
index
theory.
Marker
information
was
combined
into
a
marker
score,
which
was
equal
to
the
sum
of
the
average
effects
associated
with
markers.
Average
effects
were
defined
as
allele
substitution
effects
and
derived
as
partial
coefficients
of
regression
of
phenotype
on
number
of
marker
alleles
(10!.
Soller
[17]
considered
the
discrete
nature
of
effects
at
an
identified
QTL
in
predicting
response
to
selection.
Selection
was
on an
index
of
the
breeding
value
for
the
QTL,
which
was
assumed
to
be
known
without
error,
and
an
EBV
for
polygenic
effects.
Pong-Wong
and
Woolliams
[14]
showed
that
the
discrete
index
used
by
Soller
[17]
is
equivalent
to
the
indexes
of
Smith
[15]
and
Lande
and
Thompson
[10]
when
QTL
effects
are
known
without
error.
The
indexes
described
by
the
above
authors
were
designed
to
maximize
the
average
genetic
level
of
progeny
when
mated
to
a
random
group
of
unselected
parents.
In
particular,
the
effects
of
identified
QTL
or
markers
used
in
these
indexes
were
derived
based
on
their
average
effects
in
an
unselected
population.
In
practical
breeding
programs,
however,
selection
takes
place
in
both
sexes,
and
selected
parents
are
mated
to
a
selected
rather
than
an
unselected
group
of
mates.
This
may
change
the
average
effect
of
alleles
for
genes
that
express
dominance.
The
impact
of
selection
of
mates
on
the
breeding
value
for
identified
QTL
was
recognized
by
Larzul
et
al.
!11!,
who
developed
a
deterministic
model
for
selection
on
a
combination
of
an
identified
QTL
and
polygenes
in
a
breeding
program
with
overlapping
generations.
Breeding
values
and
their
estimates
were
obtained
in
an
iterative
manner
within
the
context
of
the
defined
selection
program.
Larzul
et
al.
(11!,
however,
did
not
consider
the
nature
of
optimal
breeding
values
for
identified
QTL,
nor
did
they
investigate
the
impact
of
the
use
of
optimal
versus
standard
breeding
values
for
the
identified
QTL
on
selection
response.
The
objectives
of
this
paper
were,
therefore,
to
derive
breeding
values
for
identified
QTL
that
maximize
the
response
to
single
generation
selection
and
to
evaluate
the
advantage
of
selection
based
on
optimum
breeding
values
over
selection
based
on
conventional
breeding
values
for
single
genes.
A
single
identified
QTL
with
known
effects
is
considered
for
simplicity,
but
implications
for
selection
on
marked
QTL
or
when
QTL
effects
are
not
known
without
error
are
discussed.
The
objectives
of
this
paper
are
important
relative
to
the
use
of
information
of
individual
genes
in
genetic
improvement
programs.
2. METHODS
2.1.
Notation
Consider
generation
0
of
an
unselected
population
of
infinite
size
with
discrete
generations
and
in
gametic
phase
equilibrium
!1!.
The
population
is
recorded
for
a
quantitative
trait
that
is
affected
by
an
identified
QTL
and
unlinked
polygenes.
All
individuals
are
genotyped
for
the
QTL
prior
to
their
age
of
selection.
The
QTL
has
two
alleles,
B and
b,
with
frequencies
po
and
qo.
Following
Falconer
and
MacKay
!4!,
genotypic
values
for
the
QTL
are
a,
d
and
-
a for
individuals
with
genotypes
Gi
equal
to
BB,
Bb
and
bb,
respectively.
Parameters
and
notation
for
the
identified
QTL
are
summarized
in
table
L
Effects
and
frequencies
of
alleles
at
the
QTL
are
assumed
to
be
known
without
error.
Polygenic
effects
for
the
quantitative
trait
conform
to
the
infinitesimal
genetic
model
[4].
After
accounting
for
effects
at
the
identified
QTL,
the
phenotypic
standard
deviation
of
the
trait
is
op
and
heritability
is
h2.
Breeding
values
for
polygenic
effects
are
estimated
with
accuracy
r&dquo;,
for
males
and
r
f
for
females,
resulting
in
a
standard
deviation
of
estimated
breeding
values
for
polygenic
effects
equal
to
am
=
r&dquo;,h!P
for
males
and
cry
=
rfh
Qr
for
females.
With
polygenic
breeding
values
estimated
based
on
own
performance,
rm
=
r
=
h.
The
results
derived
here,
however,
apply
to
estimates
of
the
polygenic
breeding
values
derived
based
on
selection
index
procedures,
using
information
from
relatives,
or
based
on
the
best
linear
unbiased
prediction
methods,
with
a
model
that
includes
a
QTL
genotype
as
a
fixed
effect
(e.g.
[9]).
Consider
the
selection
of
a
fraction
Q9
of
males
and
Qd
of females
to
produce
the
next
generation
(generation
1).
Mating
of
selected
parents
is
at
random.
Selection
is
by
truncation
on an
EBV
that
combines
the
breeding
value
for
the
identified
QTL
with
an
estimate
of
the
polygenic
breeding
value:
where
A2!k
is
the
total
EBV
for
animal
k of
sex j
(male
or
female)
and
QTL
genotype
i (BB,
Bb
or
bb),
gi!
is
the
breeding
value
for
the
QTL
for
individuals
with
QTL
genotype
i of
sex
j,
as
a
deviation
from
the
QTL
breeding
value
for
individuals
with
genotype
Bb
(gBb
,j
=
0),
and
Û
ijk
is
an
estimate
of
the
polygenic
breeding
value
for
animal
ijk.
Following
Falconer
and
MacKay
!4!,
breeding
values
for
the
QTL
for
individuals
with
genotypes
BB,
Bb
and bb
are
equal
to
+2q
oao,
(q
o
- p
o
)a
o,
and
-2p
oao,
where
ao
is
defined
as
the
average
allele
substitution
effect
and
is
equal
to
ao
=
a
+
(q
o
-
po
)d.
When
selection
is
within
a
generation,
QTL
breeding
values
can
for
simplicity
be
deviated
from
the
breeding
value
of
the
heterozygote
without
changing
the
ranking
of
individuals
by
subtracting
(q
o
-
po
)a
o.
This
results
in
adjusted
QTL
breeding
values
g
ij
equal
to
+a
o,
0
and
-a
o
(see
table
7).
2.2.
Optimal
QTL
breeding
values
Under
random
mating
to
selected
mates,
the
EBV
of
an
individual
that
is
expected
to
maximize
response
from
the
current
to
the
next
generation
can
be
derived
as
two
times
the
expected
mean
of
progeny
conditional
on
the
information
available.
Consider
an
individual
ijk
with
QTL
genotype
Gi
and
polygenic
EBV
equal
to
Û
ijk
,
which
is
mated
at
random
to
a
group
of
mates
with
QTL
gene
frequencies
pm
and
qm
and
average
polygenic
EBV
equal
to
Let
pi
and
qi
denote
the
frequency
of
gametes
carrying
the
B and
b
allele:
pi
equals
1,
1/2
and
0
for
Gi
equal
to
BB,
Bb
and
bb,
and q
i
=
1 - p
i.
Under
random
mating
to
selected
mates,
B and
b
gametes
are
combined
at
random
to
B and
b
gametes
with
frequencies
pm
and
q&dquo;,,.
Again
taken
as
a
deviation
from
the
average
EBV
of
Bb
individuals,
the
EBV
of
an
individual
with
QTL
genotype
Gi
can
be
derived
as:
Using
the
fact
that
pi
+
qi
=
1
and
pm
+ q
m
=
1,
the
latter
equation
can
be
simplified
to:
Resulting
QTL
breeding
values
are
equal
to
+a.&dquo;,,,
0
and
-a.&dquo;,,
for
individuals
with
genotypes
BB,
Bb
and
bb.
Note
that
this
result
is
consistent
with
the
quantitative
genetic
theory
[4,
17],
except
that
the
gene
substitution
effect
am
is
based
on
gene
frequencies
among
selected
mates
rather
than
frequencies
among
all
selection
candidates.
Letting
ps
and
q9
be
the
frequencies
of
B and
b
among
selected
males
and
pd
and
qd
the
frequencies
among
selected
females,
optimal
breeding
values
for
the
QTL
become
equal
to
+a,,
0
and
-as
for
sires
and
equal
to
+a
d,
0
and
- a
d
for
dams,
with:
2.3.
Numerical
procedures
for
derivation
of
optimal QTL
breeding
values
The
problem
with
the
implementation
of
the
procedures
described
above
for
selection
on
the
identified
QTL
is
that
optimal
breeding
values
for
the
QTL
in
index
(4)
depend
on
the
gene
frequency
of
the
QTL
among
mates,
which
in
turn
depends
on
the
selection
that
takes
place
among
mates
and,
therefore,
on
the
index
used
for
selection.
This
means
that
optimum
breeding
values
cannot
be
derived
analytically,
but
that
iterative
procedures
are
required.
These
procedures,
which
are
derived
below,
involve
the
prediction
of
gene
frequencies
among
selected
sires
and
dams
for
given
values of
as
and
ad,
followed
by
updating
a9
and
ad
in
an
iterative
manner
based
on
the
new
frequencies
among
selected
sires
and
dams.
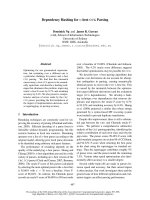
2.3.1.
Deterministic
model
for
selection
on
given
QTL
breeding
values
For
each
sex,
truncation
selection
on
index
Â
ijk
=
2(q
i
-
1/2)a
m
+
u2!!
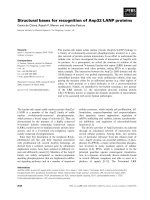
involves
selection
across
three
Normal
distributions
that
correspond
to
individuals
with
QTL
genotypes
BB,
Bb
and
bb,
as
illustrated
in
figure
1.
Distributions
have
means
equal
to
+as,
0
and
-as
for
sires
and
equal
to
+ a
d,
0
and
-a
d
for
dams.
The
standard
deviation
of
the
three
distributions
is
equal
to
am
for
males
and
Q
for
females.
The
frequency
of
each
distribution
is
determined
by
the
frequency
of
QTL
genotypes
among
selection
candidates,
which
under
random
mating
is
equal
to
P6
,
2p
oqo
and
qo
in
generation
0.
For
a
given
set
of
frequencies,
means
(based
on
a! )
and
standard
deviations
of
the
three
distributions,
a
unique
truncation
point
Cj
exists
across
the
three
distributions
for
sex j
that
results
in
the
correct
selected
fraction
(Q
s
for
males
and
Qd
for
females).
Let
f
ij
and
x
ij
be
the
selected
fraction
and
standardized
truncation
point,
respectively,
for
the
distribution of
EBV
for
individuals
with
QTL
genotype
i
of
sex
j.
The
unique
truncation
point
on
the
EBV
scale,
cj,
relates
to
the
standardized
truncation
points
x
zj
based
on:
where
i
lij
is
equal
to
+a
j,
0
and
-a
j
for
genotypes
BB,
Bb
and
bb.
Also,
the
following
relationships
must
exist
between
the
standardized
truncation
points
x2! :
In
addition,
the
f
ij
fractions
selected
from
distribution
ij,
which
are
equal
to
1 -
1>(
Xij
),
where 4)
is
the
cumulative
distribution
function
for
a
standard
normal
distribution,
must
satisfy
a
constraint
on
the
overall
fraction
selection:
Equations
(7)-(9)
uniquely
define
the
truncation
point
c!.
Even
for
given
distribution
parameters,
an
analytical
solution
does
not
exist
but
Cj
must
be
solved
iteratively.
Iteration
can
be
based
on
a
Newton
method
algorithm,
as
developed
by
Ducrocq
and
Quaas
!3!,
or
on
a
bisection
method
as
suggested
by
Gibson
[6]
and
given
in
Appendix
I.
Once
the
unique
truncation
point
cj
has
been
obtained,
the
QTL
frequency
among
selection
candidates
(p
s
and
pd)
can
be
derived
from
With
random
mating
of
selected
parents,
the
average
genetic
value
of
progeny
can
be
derived
based
on
where
U,
is
the
average
polygenic
value
of
progeny.
This
value
ul
can
be
pre-
dicted
using
standard
methods
of
predicting
response
to
selection
pooled
across
QTL
genotypes
and
sexes
as:
where
i
ij
is
the
selection
intensity
for
genotype
i
from
sex j.
2.3.2.
Iterative
procedure
for
deriving
optimal
QTL
breeding
values
Iterative
procedures
for
finding
the
unique
truncation
points
for
given
allele
substitution
effects
must
be
incorporated
within
an
iterative
procedure
for
finding
the
optimal
QTL
substitution
effects
as
and
ad.
The
following
procedure
can
be
used:
3)
Find
the
unique
truncation
points
c!
and
cd
and
fractions
selected,
f
ij
,
based
on
the
procedures
described
in
section
2.3.1.
4)
Compute
the
frequency
of
QTL
alleles
among
selected
parents
p,
and
pd,
based
on
equation
(10).
5)
Using
the
new
solutions
for
p,
and
pd,
compute
new
values
for
as
and
ad
as:
as
=
a
+
(q
d
-
Pd)d
and
ad
=
a
+
(q
s
-
ps
)d.
A
multiplicative
relaxation
factor
may
be
required
here,
reducing
changes
in
as
and
ad
from
one
iteration
to
another,
to
allow
convergence.
6)
Repeat
steps
2
through
5
until
as
and
ad
converge
to
stable
solutions.
Once
optimal
solutions
have
been
obtained,
the
expected
genetic
level
among
progeny
can
be
determined
based
on
equations
(11)
and
(12).
Note
that
the
starting
values
for
this
iterative
procedure,
which
are
set
in
step
1,
provide
results
for
classic
selection
with
a
known
QTL.
2.4.
Optimal
QTL
breeding
values
with
gametic
phase
disequilibrium
In
section
2.3,
the
parental
generation
was
assumed
to
be
in
gametic
phase
equilibrium.
When
gametic
phase
disequilibrium
is
present
in
the
parental
population
as
a
result
of
prior
selection,
average
polygenic
values
will
differ
by
QTL
genotype;
with
truncation
selection,
individuals
with
the
favorable
QTL
genotype
tend
to
have
lower
polygenic
values.
This
disequilibrium
must
be
incorporated
in
selection
decisions.
Let
7!
ij
be
the
average
polygenic
breeding
value
for
QTL
genotype
i for
sex
j.
Under
random
mating
of
selected
parents,
average
polygenic
values
will
be
equal
for
male
and
female
progeny
and
equidistant
between
the
three
progeny
genotypes,
and
hence
let
UBB
,j
=
usb,! -!B6,j -u66,j
=
6.
Assuming
6 can
be
estimated
with
sufficient
accuracy,
gametic
phase
disequilibrium
between
the
QTL
and
polygenes
can
be
accounted
for
in
the
selection
index
as
follows
(e.g.
!14!)
where
Û
ijk
is
now
the
individual’s
polygenic
EBV
as
a
deviation
from
the
average
polygenic
breeding
value
for
individuals
of
QTL
genotype
i
and
sex
j.
Based
on
this,
optimal
QTL
allele
substitution
effects
can
be
derived
as
before
but
with
the
effect
of
gametic
phase
disequilibrium
included
in
the
allele
substitution
effect
as:
Note
that
because
6 is
negative,
a
gametic
phase
disequilibrium
will
reduce
the
average
allele
substitution
effect
associated
with
the
QTL.
3. RESULTS
3.1.
One
generation
response
Methods
for
the
optimization
of
single
generation
response
were
applied
and
the
responses
were
compared
to
selection
on
an
index
in
which
breeding
values
for
the
QTL
were
derived
based
on
frequency
in
the
parental
generation
(a
=
a
+
(1 -
2p
o
)d).
These
two
strategies
will
be
referred
to
as
optimal
and
standard
gene-assisted
selection
(GAS),
respectively.
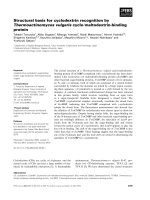
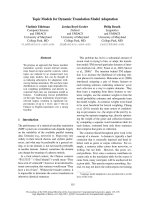
Figure
2 compares
the
response
to
one
generation
of
optimal
GAS
to
response
to
standard
GAS,
as
a
function
of
frequency
of
the
favorable
allele
at
the
QTL.
The
results
are
shown
for
varying
levels
of
additive
and
dominance
effects
at
the
QTL.
QTL
effects
are
expressed
relative
to
the
standard
deviation
of
EBV
for
polygenic
effects
(or),
which
is
what
determines
the
selection
response
for
the
QTL
for
polygenes,
rather
than
relative
to
the
genetic
or
phenotypic
standard
deviation.
Therefore,
the
results
in
figure 2
hold
for
specified
magnitudes
a
and
d
in
terms
of
standard
deviations
of
EBV
but
regardless
of
heritability
and
phenotypic
standard
deviations.
Relative
QTL
effects
in
figure
2 can,
however,
be
converted
to
values
relative
to
the
genetic
standard
deviation
by
multiplying
a
and
d
by
the
accuracy
of
EBV
and
to
values
relative
to
the
phenotypic
standard
deviation
by
multiplying
a
and
d
by
accuracy
and
the
square
root
of
heritability.
For
example,
with
polygenic
EBV
based
on
own
phenotype
alone
for
a
trait
with
heritability
equal
to
0.25,
and
a
phenotypic
standard
deviation
equal
to
one,
one
standard
deviation
of
EBV
converts
to
0.5
genetic
standard
deviations
(accuracy
=
0.5)
and
to
0.25
phenotypic
standard
deviations
(square
root
of
heritability
=
0.5).
Hence,
a
QTL
with
a
=
1!
represents
a
gene
with
only
moderate
effects
for
a
trait
with
low
heritability.
For
figure
2,
the
standard
deviation
and
accuracy
of
EBV
is
assumed
equal
for
males
and
females.
Over
a
single
generation,
benefits of
optimal
GAS
over
standard
GAS
were
the
greatest
for
QTL
frequencies
between
0.3
and
0.5
and
increased
with
the
magnitude
of
additive
and
dominance
effects
at
the
major
gene
(figure
2).
Extra
response
was
negligible
for
gene
frequencies
less
than
0.05
and
greater
than
0.85.
Extra
response
was
greater
than
8
%
for
QTL
with
large
effects
(a
>
1Q)
and
complete
dominance
(d
>
1Q)
and
with
the
favorable
allele
at
intermediate
frequency.
For
several
combinations
of
parameter
values,
extra
responses
showed
bi-modality
as
a
function
of
gene
frequencies.
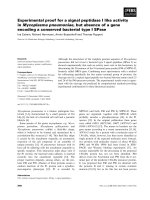
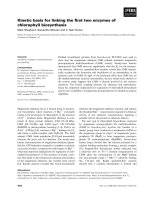
Figure 3
shows
the
effect
of
selection
intensity
on
extra
response
from
optimal
selection
for
a
QTL
with
complete
dominance
and
a
=
1Q.
The
benefit
of
optimal
selection
increased
with
the
intensity
of
selection.
Selection
of
5
%
among
males
and
40
%
among
females
had
similar
results
as
selection
of
20
%
for
both
males
and
females.
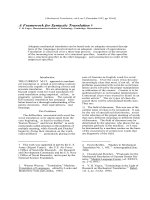
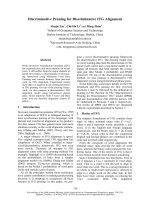
Figure
4 shows
the
relationship
between
optimal
allele
substitution
effects
at
the
QTL
and
gene
frequency
for
a
QTL
with
complete
dominance
and
with
5
%
selected
among
males
and
40
%
among
females.
The
standard
allele
substitution
effect
changes
with
gene
frequency
in
a
linear
manner,
based
on
a
=
a+(q-p)d.
Optimal
allele
substitution
effects
changed
in
a
nonlinear
manner,
depending
on
QTL
frequency
among
mates.
Optimal
allele
substitution
effects
were
lower
than
the
standard
substitution
effects.
For
females,
optimal
substitution
effects
were
up
to
75
%
lower
than
standard
substitution
effects.
Optimal
allele
substitution
effects
were
more
greatly
affected
for
females
than
males
because
selection
intensity
was
greater
for
males,
and,
therefore,
QTL
frequency
differed
more
drastically
from
QTL
frequency
among
all
candidates
for
selected
males
than
for
selected females.
For
recessive
QTL
(negative
dominance),
an
opposite
effect
would
occur
(results
not
shown);
optimal
breeding
values
are
greater
than
standardized
breeding
values
under
selection
because
breeding
values
(a
+
(q - p)d)
increase
with
p
for
negative
d.
This
increase
in
QTL
breeding
values
will
increase
the
emphasis
on
QTL
relative
to
polygenes.
3.2.
Multiple
generation
response
Responses
to
optimal
and
standard
GAS
were
also
compared
over
multiple
generations,
starting
from
a
population
in
gametic
phase
equilibrium.
QTL
allele
substitution
effects
were
updated
each
generation
for
both
optimal
and
standard
GAS
to
account
for
the
changes
in
gene
frequency
and
gametic
phase
disequilibrium
between
the
QTL
and
polygenes.
Polygenic
means
by
genotype
class
were
assumed
known
without
error.
Polygenic
variance
was
assumed
to
remain
constant.
Figure 5
shows
the
extra
cumulative
benefit
of
selection
on
optimal
over
standard
QTL
breeding
values.
Figure
6
shows
changes
in
gene
frequency
for
the
two
selection
strategies.
Cumulative
benefits
increased
over
generations
until
gene
frequencies
were
between
0.3
and
0.5
and
then
decreased.
This
trend
is
consistent
with
the
relationship
between
single
generation
response
and
gene
frequency
observed
in
figures 2
and
3.
Extra
cumulative
responses
after
ten
generations
were
relatively
small
(less
than
2
%
for
the
chosen
examples).
4.
DISCUSSION
The
objective
of
this
paper
was
to
derive
breeding
values
for
a
single
locus
that,
when
used
in
combination
with
EBV
for
polygenic
effects,
maximize
single
generation
response
to
selection
based
on
expected
performance
of
progeny.
Single
locus
breeding
values
thus
derived
were
equivalent
to
breeding
values
derived
on
the
standard
quantitative
genetic
theory
[4]
but
with
the
average
effect
of
allele
substitution,
a
derived
from
gene
frequency
among
mates,
rather
than
frequency
in
the
unselected
parental
generation.
With
a
=
a
+
(q -
p)d,
the
difference
between
optimal
and
standard
breeding
values
for
an
individual
locus
therefore
depends
on
the
degree
of
dominance,
d,
and
the
effect
of
selection
on
the
gene
frequency
among
selected
mates.
The
latter
depends
on
selection
emphasis
that
is
placed
on
the
individual
locus
and
its
effect
and
frequency.
With
phenotypic
selection
and
when
the
trait
is
affected
by
a
large
number
of
genes
of
minor
effect,
the
effect
of
selection
on
gene
frequency
will
be
small,
and,
hence,
the
difference
between
optimal
and
standard
breeding
values
for
a
single
locus
will
be
minimal.
With
direct
selection
on
QTL
of
sizeable
effect,
selection
can,
however,
have
a
substantial
impact
on
gene
frequencies,
and,
therefore,
optimal
QTL
breeding
values
can
differ
significantly
from
standard
breeding
values
for
a
locus
with
dominance.
This
is
illustrated
in
figure
4.
The
importance
of
derivation
of
optimum
breeding
values
for
a
single
locus
lies
in
the
current
advances
in
molecular
genetics,
which
lead
to
the
uncovering
of
loci
that
affect
quantitative
traits,
either
by
direct
identification
or
indirectly
through
linked
genetic
markers.
Use
of
this
information
in
genetic
improvement
involves
combining
information
on
identified
QTL
with
EBV
for
the
collective
effects
of
other
genes
that
affect
the
trait
(polygenic
effects).
The
results
from
this
paper
show
that,
if
the
QTL
exhibits
dominance,
substantial
additional
genetic
progress
can
be
made
over
a
single
generation
if
breeding
values
for
the
QTL
take
into
account
the
effect
of
selection
on
gene
frequencies
among
mates.
Although
benefits
were
small
for
QTL
with
moderate
additive
and
dominance
effects,
improvements
of
up
to
9
%
in
single
generation
response
were
observed
for
QTL
with
larger
additive
and
dominance
effects
(see
figure
2).
Greatest
benefits
for
the
use
of
optimal
over
standard
QTL
breeding
values
were
obtained
for
gene
frequencies
in
the
parental
generation
between
0.3
and
0.5,
depending
on
the
magnitude
of
the
QTL
effects.
For
a
QTL
with
positive
dominance,
genetic
variance
contributed
by
the
QTL
and,
therefore,
the
opportunity
to
change
gene
frequency
is
greatest
for
this
range
of
gene
frequencies
(4!.
The
use
of
optimal
QTL
breeding
values
over
successive
generations
resulted
in
greater
cumulative
response
than
the
use
of
standard
QTL
breeding
values
(figure
5),
although
the
benefit
of
optimal
over
standard
breeding
values
decreased
over
generations.
It
is
important
to
note
that
the
optimal
QTL
breeding
values
derived
here
maximize
single
generation
responses
but
may
not
maximize
cumulative
response
over
multiple
generations.
This
has
been
illustrated
by
several
authors
(e.g.
[7,
14!)
for
additive
genes,
for
which
standard
QTL
breeding
values
maximize
single
generation
response,
and
by
others
(e.g.
[11])
for
QTL
with
dominance.
The
reason
for
the
suboptimality
of
QTL
selection
strategies
that
maximize
single
generation
response
over
multiple
generation
is
that
selection
changes
not
only
the
population
mean
but
also
population
parameters
(frequency
and,
thereby,
variance
at
the
QTL)
!2!.
Single
generation
selection
thereby
affects
opportunities
for
response
in
subsequent
generations.
Manfredi
et
al.
[12]
and
Dekkers
and
Van
Arendonk
[2]
developed
methods
to
optimize
QTL
selection
over
multiple
generations.
The
additional
benefit
of
multiple
generation
optimization
over
single
generation
optimization
will
be
investigated
in
subsequent
work.
In
the
present
study,
QTL
genotypes
could
be
observed
directly,
and
the
effect
of
the
QTL
was
assumed
known
without
error.
In
many
cases,
QTL
genotype
must
be
inferred
from
linked
genetic
markers,
and
QTL
effects
will
be
estimated
with
some
error.
Both
these
factors
will
reduce
the
effect
of
selection
on
changes
in
frequency
at
the
QTL
and,
therefore,
the
difference
between
optimal
and
standard
breeding
values.
With
uncertainty
about
estimates
of
QTL
effects,
the
effect
of
selection
on
QTL
frequencies
may
be
difficult
to
predict.
This
will
increase
the
errors
of
prediction
of
optimal
breeding
values.
It
must
also
be
noted
that
derivation
of
optimal
QTL
breeding
values
requires
estimates
of
additive
(a)
and
dominance
(d)
effects
at
the
QTL,
as
well
as
an
estimate
of
the
frequency
of
the
QTL.
These
estimates
may
be
difficult
to
obtain
in
outbred
populations
based
on
linked
markers.
For
example,
the
best
linear
unbiased
prediction
method
developed
by
Fernando
and
Grossman
[5]
and
extended
by
others
for
the
incorporation
of
marker
information
in
breeding
value
estimation
estimates
the
average
effect
of
the
QTL,
rather
than
separate
additive
and
dominance
effects.
For
non-additive
QTL,
the
resulting
QTL
breeding
value
estimates
will
depend
on
the
QTL
frequency
among
mates
of
animals
that
contributed
information
to
estimate
the
QTL
effect.
With
selection
on
the
QTL,
the
QTL
frequency
among
mates
of
these
animals
may
not
be
the
same
as
the
QTL
frequency
among
individuals
to
which
animals
that
are
selected
based
on
the
QTL
will
be
mated.
The
same
holds
for
the
multiple
regression
methods
suggested
by
Lande
and
Thompson
!10!,
in
which
marker
effects
are
estimated
as
linear
coefficients
of
regression
of
phenotypes
on
number
of
marker
alleles.
Implementation
of
optimal
QTL
breeding
values
in
strategies
for
marker-assisted
selection
in
outbred
populations,
therefore,
requires
further
investigation.
ACKNOWLEDGMENTS
Financial
support
from
the
Iowa
Pork
Producers
Association
through
the
National
Pork
Board
for
aspects
of
this
work
is
greatly
appreciated.
This
is
Journal
Paper
No.
J-18323
of
the
Iowa
Agriculture
and
Home
Economics
Experiment
Station,
Ames,
Iowa,
USA
(Project
No.
3456)
and
supported
by
the
Hatch
Act
and
State
of
Iowa
funds.
REFERENCES
[1]
Bulmer
M.G.,
The
Mathematical
Theory
of
Quantitative
Genetics,
Clarendon
Press,
Oxford,
1980.
[2]
Dekkers
J.C.M., Van
Arendonk
J.A.M.,
Optimizing
selection
for
quantitative
traits
with
information
on
an
identified
locus
in
outbred
populations,
Genet.
Res.
(1998)
257-275.
[3]
Ducrocq
V.,
Quaas
R.L.,
Prediction
of
genetic
response
to
truncation
selection
across
generations,
J.
Dairy
Sci.
71
(1988)
2543-2553.
[4]
Falconer
D.S.,
MacKay
T.F.C.,
Introduction
to
Quantitative
Genetics,
Long-
man,
Harlow,
UK,
1996.
[5]
Fernando
R.L.,
Grossman
M.,
Marker-assisted
selection
using
best
linear
un-
biased
prediction,
Genet.
Sel.
Evol.
21
(1989)
467.
[6]
Gibson
J.P.,
An
Introduction
to
the
Design
and
Economics
of
Animal
Breeding
Strategies,
Course
notes,
Centre
for
Genetic
Improvement
of
Livestock,
University
of
Guelph,
Canada,
1995,
p.
149.
[7]
Gibson
J.P.,
Short-term
gain
at
the
expense
of
long-term
response
with
selec-
tion
of
identified
loci,
Proc.
5th
World
Congr.
Genet.
Appl.
Livest.
Prod.
21
(1994)
201-204.
[8]
Hazel
L.N.,
The
genetic
basis
of
constructing
selection
indexes,
Genetics
28
(1943)
476-490.
[9]
Kennedy
B.W.,
Quinton
M.,
Van
Arendonk
J.A.M.,
Estimation
of
effects
of
single
genes
on
quantitative
traits,
J.
Anim.
Sci.
70
(1992)
2000-2012.
[10]
Lande
R.,
Thompson
R.,
Efficiency
of
marker-assisted
selection
in
the
im-
provement
of
quantitative
traits,
Genetics
124
(1990)
743-756.
!11!
Larzul
C., Manfredi
E., Elsen
J.M.,
Potential
gain
from
including
major
gene
information
in
breeding
value
estimation,
Genet.
Sel.
Evol.
29
(1997)
161-184.
[12]
Manfredi
E.,
Barbieri
M.,
Fournet
F.,
Elsen
J.M.,
A
dynamic
deterministic
model
to
evaluate
breeding
strategies
under
mixed
inheritance,
Genet.
Sel.
Evol.
30
(1998)
127-148.
[13]
Neimann-Sorensen
A.,
Robertson
A.,
The
association
between
blood
groups
and
several
production
characteristics
in
three
Danish
cattle
breeds,
Acta
Agric.
Scand. (1961)
161-196.
[14]
Pong-Wong
R.,
Woolliams
J.A.,
Response
to
mass
selection
when
an
identi-
fied
major
gene
is
segregating,
Genet.
Sel.
Evol.
30
(1998)
313-337.
[15]
Smith
C.,
Improvement
of
metric
traits
through
specific
genetic
loci,
Anim.
Prod.
9
(1967)
349-358.
[16]
Smith
C.,
Webb
A.J.,
Effects
of
major
genes
on
animal
breeding
strategies,
Z.
Tierzucht.
Zuchtgsbiol.
98
(1981)
161-169.
[17]
Soller
M.,
The
use
of
loci
associated
with
quantitative
effects
in
dairy
cattle
improvement,
Anim.
Prod.
27
(1978)
133-139.
APPENDIX
I:
Bisection
method
to
determine
unique
truncation
point
to
select
across
multiple
Normal
distributions
Selection
of
a
fraction
Q
by
truncation
across
three
distributions
with
frequencies
pi,
mean
pi
(i
=
1, 2, 3)
and
standard
deviation
0’!.
Let
c
be
the
unique
truncation
point
on
the
original
scale
and
xi
and
fi
the
standardized
truncation
point
and
fraction
selected
for
distribution
i.
Based
on
the
definition
of
a
standardized
truncation
point,
xi
=
(c -
pi
)lo
i
and
fi
=
1 —
1
>(
Xi),
where
1>
is
the
cumulative
Normal
distribution
function.
Then,
truncation
point
c
must
be
chosen
such
that
p, f,
+p2/2
+
P3
h
=
Q.
The
following
iterative
procedure
can
be
used
to
find
truncation
point
c
(based
on
(6!).
1)
For
all
i,
find
the
standardized
truncation
point
xi
corresponding
to
1 -
1>(
Xi
)
=
Q
using
the
inverse
Normal
distribution
function.
2)
Convert
standardized
truncation
points x
i
to
the
original
scale
based
on
ci
=
xz
az
+
!,.
Choose
the
lowest
ci
as
lower
bound
for
C
(c
d
and
the
highest
ci
as
the
upper
bound
for
c
(c
U)
(c
must
lie
between
cL
and
cu
).
3)
Compute
the
midpoint
between
cL
and
cu
c,i,l
=
(c
L
+
cU
).
4)
Compute
standardized
truncation
points
corresponding
to
cM
for
each
distribution:
xi
=
(c
M
-
J-
li
)/a
i
and
the
corresponding
proportions
selected:
fi
=
1 -
4$(X
z ) .
5)
Compute
the
total
proportion
selected
as:
Q,1,1
= p
lfl
+ pzf2
+
P3
f3
.
6)
If
]OM —<3!
<
convergence
criterion,
the
unique
truncation
point
has
been
found:
c
=
cM
7)
If
Q,1,1 -
Q
<
0,
then
set
cu
=
cM.
If
Q,1,1 -
Q
>
0,
then
set
cL
=
c,!,l.
Return
to
step
3.