Báo cáo khoa hoc:" EM-REML estimation of covariance parameters in Gaussian mixed models for longitudinal data analysis" docx
Bạn đang xem bản rút gọn của tài liệu. Xem và tải ngay bản đầy đủ của tài liệu tại đây (376.78 KB, 13 trang )
Genet. Sel. Evol. 32 (2000) 129–141 129
c
INRA, EDP Sciences
Original article
EM-REML estimation
of covariance parameters
in Gaussian mixed models
for longitudinal data analysis
Jean-Louis FOULLEY
a∗
, Florence JAFFR
´
EZIC
b
,
Christ`ele R
OBERT-GRANI
´
E
a
a
Station de g´en´etique quantitative et appliqu´ee,
Institut national de la recherche agronomique,
78352 Jouy-en-Josas Cedex, France
b
Institute of Cell, Animal and Population Biology
The University of Edinburgh
Edinburgh EH9 3JT, UK
(Received 24 September 1999; accepted 30 November 1999)
Abstract – This paper presents procedures for implementing the EM algorithm to
compute REML estimates of variance covariance components in Gaussian mixed
models for longitudinal data analysis. The class of models considered includes random
coefficient factors, stationary time processes and measurement errors. The EM
algorithm allows separation of the computations pertaining to parameters involved
in the random coefficient factors from those pertaining to the time processes and
errors. The procedures are illustrated with Pothoff and Roy’s data example on growth
measurements taken on 11 girls and 16 boys at four ages. Several variants and
extensions are discussed.
EM algorithm / REML / mixed models / random regression / longitudinal data
R´esum´e – Estimation EM-REML des param`etres de covariance en mod`eles
mixtes gaussiens en vue de l’analyse de donn´ees longitudinales.
Cet article
pr´esente des proc´ed´es permettant de mettre en œuvre l’algorithme EM en vue
du calcul d’estimations REML des composantes de variance covariance en mod`eles
mixtes gaussiens d’analyse de donn´ees longitudinales. La classe de mod`eles consid´er´ee
concerne les coefficients al´eatoires, les processus temporels stationnaires et les erreurs
de mesure. L’algorithme EM permet de dissocier formellement les calculs relatifs
aux param`etres des coefficients al´eatoires de ceux impliqu´es dans les processus et la
r´esiduelle. Ces m´ethodes sont illustr´ees par un exemple provenant de Pothoff et Roy
∗
Correspondence and reprints
E-mail:
130 J L. Foulley et al.
sur des mesures de croissance prises sur 11 filles et 16 gar¸cons `a quatre ˆages diff´erents.
On discute enfin plusieurs variantes et extensions de cette m´ethode.
algorithme EM / REML / mod`eles mixtes / r´egression al´eatoire / donn´ees
longitudinales
1. INTRODUCTION
There has been a great deal of interest in longitudinal data analysis among
biometricians over the last decade: see e.g., the comprehensive synthesis of both
theoretical and applied aspects given in Diggle et al. [4] textbook. Since the
pioneer work of Laird and Ware [13] and of Diggle [3], random effects models
[17] have been the cornerstone of statistical analysis used in biometry for this
kind of data. In fact, as well illustrated in the quantitative genetics and animal
breeding areas, practitioners have for a long time restricted their attention to
the most extreme versions of such models viz. to the so called intercept or
repeatability model with a constant intra-class correlation, and to the multiple
trait approach involving an unspecified variance covariance structure.
Harville [9] first advocated the use of autoregressive random effects to
the animal breeding community for analysing lactation records from different
parities. These ideas were later used by Wade and Quaas [33] and Wade et al.
[34] to estimate correlation among lactation yields produced over different time
periods within herds and by Schaeffer and Dekkers [28] to analyse daily milk
records.
As well explained in Diggle et al. [3], potentially interesting models must
include three sources of variation: (i) between subjects, (ii) between times
within a subject and (iii) measurement errors. Covariance parameters of such
models are usually estimated by maximum likelihood procedures based on
second order algorithms. The objective of this study is to propose EM-REML
procedures [1, 21] for estimating these parameters especially for those involved
in the serial correlation structure (ii).
The paper is organized as follows. Section 2 describes the model structure
and Section 3 the EM implementation. A numerical example based on growth
measurements will illustrate these procedures in Section 4, and some elements
of discussion and conclusion are given in Section 5.
2. MODEL STRUCTURE
Let y
ij
be the jth measurement (j =1, 2, ,n
i
) recorded on the ith
individual i =1, 2, , I at time t
ij
. The class of models considered here
can be written as follows:
y
ij
= x
ij
β + ε
ij
(1)
where x
ij
β represents the systematic component expressed as a linear combina-
tion of p explanatory variables (row vector x
ij
) with unknown linear coefficients
(vector β), and ε
ij
is the random component.
EM-REML for longitudinal data 131
As in [3], ε
ij
is decomposed as the sum of three elements:
ε
ij
=
K
k=1
z
ijk
u
ik
+ w
i
(t
ij
)+e
ij
. (2)
The first term represents the additive effect of K random regression factors u
ik
on covariable information z
ijk
(usually a (k − 1)th power of time) and which
are specific to each ith individual. The second term w
i
(t
ij
) corresponds to the
contribution of a stationary Gaussian time process, and the third term e
ij
is
the so-called measurement error.
By gathering the n
i
measurements made on the ith individual such that
y
i
= {y
ij
}, ε
i
= {ε
ij
} and X
i(n
i
×p)
=(x
i1
, x
i2
, , x
in
i
)
, (1) and (2) can be
expressed in matrix notation as
y
i
= X
i
β + ε
i
, (3)
and
ε
i
= Z
i
u
i
+ W
i
+ e
i
, (4)
where Z
i(n
i
×K)
=(z
i1
, z
i2
, , z
ij
, ,z
in
i
)
, z
ij(K×1)
= {z
ijk
}, u
i(K×1)
=
{u
ik
} for k =1, 2, , K, W
i
= {w
i
(t
ij
)}, and e
i
= {e
ij
} for j =1, 2, , n
i
.
We will assume that ε
i
∼ N(0, V
i
) with
V
i
= Z
i
GZ
i
+ R
i
(5)
where G
(K×K)
is a symmetric positive definite matrix, which may alternatively
be represented under its vector form g = vechG. For instance, for a linear
regression, g =(g
00
,g
01
,g
11
)
where g
00
refers to the variance of the intercept,
g
11
to the variance of the linear regression coefficient and g
01
to their covariance.
R
i
in (5) has the following structure in the general case
R
i
= σ
2
H
i
+ σ
2
e
I
n
i
, (6)
where σ
2
e
I
n
i
= var(e
i
), and for stationary Gaussian simple processes, σ
2
is the
variance of each w
i
(t
ij
) and H
i
= {h
ij,ij
} the (n
i
× n
i
) correlation matrix
among them such that h
ij,ij
= f(ρ, d
ij,ij
) can be written as a function f of a
real positive number ρ and of the absolute time separation d
ij,ij
= |t
ij
− t
ij
|
between measurements j and j
made on the individual i.
Classical examples of such functions are the power: f(ρ, d)=ρ
d
; the
exponential: exp(−d/ρ), and the Gaussian: exp(−d
2
/ρ
2
), functions. Notice that
for equidistant intervals, these functions are equivalent and reduce to a first
order autoregressive process (AR1).
R
i
in (6) can be alternatively expressed in terms of ρ, σ
2
and of the ratio
λ = σ
2
e
/σ
2
R
i
= σ
2
(H
i
+ λI
n
i
)=σ
2
˜
H
i
. (7)
This parameterisation via r =(σ
2
,ρ,λ)
allows models to be addressed both
with and without measurement error variance (or “nugget” in geostatistics).
132 J L. Foulley et al.
3. EM IMPLEMENTATION
Let γ =(g
, r
)
be the 3+K(K +1)/2 parameter vector and x =(y
, β
, u
)
be the complete data vector where y =(y
1
, y
2
, , y
i
, , y
I
)
and u =
(u
1
, u
2
, u
i
, , u
I
)
. Following Dempster et al. [1], the EM algorithm
proceeds from the log-likelihood L(γ; x)=lnp(x|γ)ofx as a function of
γ. Here L(γ; x) can be decomposed as the sum of the log-likelihood of u as a
function of g and of the log-likelihood of ε
∗
= y −Xβ −Zu as a function of r,
L(γ; x)=L(r; ε
∗
)+L(g; u)+const., (8)
where X
(N×p)
=(X
1
, X
2
, , X
i
, , X
I
)
and Z
(N×KI)
=(Z
1
, Z
2
, ,Z
i
, , Z
I
)
.
Under normality assumptions, the two log-likelihoods in (8) can be expressed
as:
L(g; u)=−1/2
KIln2π + Iln|G| +
I
i=1
u
i
G
−1
u
i
, (9)
L(r; ε
∗
)=−1/2
Nln2π +
I
i=1
ln|R
i
| +
I
i=1
ε
∗
i
R
−1
i
ε
∗
i
. (10)
The E-step consists of evaluating the conditional expectation of the complete
data log-likelihood L(γ; x)=lnp(x|γ) given the observed data y with γ set
at its current value γ
[t]
i.e., evaluating the function
Q(γ|γ
[t]
)=E[L(γ; x)|y, γ = γ
[t]
], (11)
while the M-step updates γ by maximizing (11) with respect to γ i.e.,
γ
[t+1]
= arg max
Υ
Q(γ|γ
[t]
). (12)
The formula in (8) allows the separation of Q(γ|γ
[t]
) into two components, the
first Q
u
(g|γ
[t]
) corresponding to g, and the second Q
ε
(r|γ
[t]
) corresponding to
r, i.e.,
Q(γ|γ
[t]
)=Q
u
(g|γ
[t]
)+Q
ε
(r|γ
[t]
). (13)
We will not consider the maximization of Q
u
(g|γ
[t]
) with respect to g in detail;
this is a classical result: see e.g., Henderson [11], Foulley et al. [6] and Quaas
[23]. The (k, l) element of G can be expressed as
(G
[t+1]
)
kl
= E
I
i=1
u
ik
u
il
|y, γ
[t]
. (14)
If individuals are not independent (as happens in genetical studies), one has to
replace
I
i=1
u
ik
u
il
by u
k
A
−1
u
l
where u
k
= {u
ik
} for i =1, 2, , I and A is
a(I × I) symmetric, positive definite matrix of known coefficients.
Regarding r, Q
ε
(r|γ
[t]
) can be made explicit from (10) as
Q
ε
(r|γ
[t]
)=−1/2
I
i=1
ln|R
i
| +
I
i=1
tr(R
−1
i
Ω
i
)
+ const., (15)
EM-REML for longitudinal data 133
where Ω
i(n
i
×n
i
)
= E(ε
∗
i
ε
∗
i
|y, γ
[t]
) which can be computed from the elements
of Henderson’s mixed model equations [10, 11].
Using the decomposition of R
i
in (7), this expression reduces to (16)
Q
ε
(r|γ
[t]
)=−1/2
Nln σ
2
+
I
i=1
ln|
˜
H
i
(ρ, λ)|
+σ
−2
I
i=1
tr{[
˜
H
i
(ρ, λ)]
−1
Ω
i
}
+ const.
In order to maximize Q
ε
(r|γ
[t]
) in (16) with respect to r, we suggest using
the gradient-EM technique [12] i.e., solving the M-step by one iteration of a
second order algorithm. Since here E(Ω
i
)=σ
2
˜
H
i
, calculations can be made
easier using the Fisher information matrix as in [31]. Letting
˙
Q = ∂Q/∂r,
¨
Q = E(∂
2
Q/∂r∂r
) the system to solve can be written
−
¨
Q∆r =
˙
Q, (17)
where ∆r is the increment in r from one iteration to the next.
Here, elements of
˙
Q and
¨
Q can be expressed as:
˙q
1
= Nσ
−2
− σ
−4
I
i=1
tr(
˜
H
−1
i
Ω
i
)
˙q
2
=
I
i=1
tr
∂H
i
∂ρ
(
˜
H
−1
i
− σ
−2
˜
H
−1
i
Ω
i
˜
H
−1
i
)
˙q
3
=
I
i=1
tr(
˜
H
−1
i
− σ
−2
˜
H
−1
i
Ω
i
˜
H
−1
i
)
and
¨q
11
= Nσ
−4
; ¨q
12
= σ
−2
I
i=1
tr
∂H
i
∂ρ
˜
H
−1
i
¨q
13
= σ
−2
I
i=1
tr(
˜
H
−1
i
); ¨q
22
=
I
i=1
tr
∂H
i
∂ρ
˜
H
−1
i
∂H
i
∂ρ
˜
H
−1
i
¨q
23
=
I
i=1
tr
˜
H
−1
i
∂H
i
∂ρ
˜
H
−1
i
;
¨q
33
=
I
i=1
tr(
˜
H
−1
i
˜
H
−1
i
)
where 1, 2 and 3 refer to σ
2
, ρ and λ respectively.
134 J L. Foulley et al.
The expressions for
˙
Q and
¨
Q are unchanged for models without measurement
error; one just has to reduce the dimension by one and use H
i
in place of
˜
H
i
.
The minimum of −2L can be easily computed from the general formula given
by Meyer [20] and Quaas [23]
−2L
m
=[N −r(X)]ln 2π +ln|G
#
|+ln|R
#
|+ln|M
#
|+ y
R
#−1
y −
ˆ
θ
R
#−1
y
where G
#
= A ⊗ G (A is usually the identity matrix), R
#
= ⊕
I
i=1
R
i
,(⊗
and ⊕ standing for the direct product and sum respectively) M
#
= M/σ
2
with M the coefficient matrix of Henderson’s mixed model equations in
ˆ
θ =(
ˆ
β
,
ˆ
u
)
i.e., for T
i
=(X
i
, 0, 0, ,Z
i
, ,0) and Γ
−
=
00
0G
#−1
,
M =
I
i=1
T
i
˜
H
−1
i
T
i
+ σ
2
Γ
−
.
Here y
R
#−1
y −
ˆ
θ
R
#−1
y =[N − r(X)]ˆσ
2
/σ
2
which equals to N −r(X) for
σ
2
evaluated at its REML estimate, so that eventually
−2L
m
=[N − r(X)](1 + ln 2π)+Kln|A| + Iln|G| +ln|M|
+[N − dim(M)]ln ˆσ
2
+
I
i=1
ln |
˜
H
i
|. (18)
This formula is useful to compute likelihood ratio test statistics for comparing
models, as advocated by Foulley and Quaas [5] and Foulley et al. [7,8].
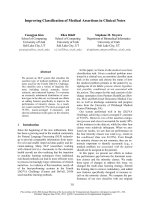
4. NUMERICAL APPLICATION
The procedures presented here are illustrated with a small data set due
to Pothoff and Roy [22]. These data shown in Table I contain facial growth
measurements made on 11 girls and 16 boys at four ages (8, 10, 12 and 14 years)
with the nine deleted values at age 10 defined in Little and Rubin [14].
The mean structure considered is the one selected by Verbeke and Molen-
berghs [32] in their detailed analysis of this example and involves an intercept
and a linear trend within each sex such that
E(y
ijk
)=µ + α
i
+ β
i
t
j
, (19)
where µ is a general mean, α
i
is the effect of sex (i =1, 2 for female and male
children respectively), and β
i
is the slope within sex i of the linear increase
with time t measured at age j (t
j
= 8, 10, 12 and 14 years).
The model was applied using a full rank parameterisation of the fixed effects
defined as β
=(µ + α
1
,α
2
− α
1
,β
1
,β
2
− β
1
). Given this mean structure,
six models were fitted with different covariance structures. These models
are symbolized as follows with their number of parameters indicated within
brackets:
{1} intercept + error (2)
{2} POW (2)
{3} POW + measurement error (3)
{4} intercept + POW (3)
{5} intercept + linear trend + error (4)
{6} unspecified (10)
EM-REML for longitudinal data 135
Table I. Growth measurements in 11 girls and 16 boys (from Pothoff and Roy [22]
and Little and Rubin [14]).
Age (years) Age (years)
Girl 8 10 12 14 Boy 8 10 12 14
1 210 200 215 230 1 260 250 290 310
2 210 215 240 255 2 215 230 265
3 205 245 260 3 230 225 240 275
4 235 245 250 265 4 255 275 265 270
5 215 230 225 235 5 200 225 260
6 200 210 225 6 245 255 270 285
7 215 225 230 250 7 220 220 245 265
8 230 230 235 240 8 240 215 245 255
9 200 220 215 9 230 205 310 260
10 165 190 195 10 275 280 310 315
11 245 250 280 280 11 230 230 235 250
12 215 240 280
13 170 260 295
14 225 255 255 260
15 230 245 260 300
16 220 235 250
Distance from the centre of the pituary to the pteryomaxillary fissure (unit 10
−4
m).
Table II. Covariance structures associated with the models considered.
Models
a
Z
i
GR
i
{1} 1
n
i
g
00
σ
2
e
I
n
i
{2} 0
n
i
— σ
2
H
i
{3} 0
n
i
— σ
2
H
i
+ σ
2
e
I
n
i
{4} 1
n
i
g
00
σ
2
H
i
{5} (1
n
i
, t
i
)
g
00
g
01
g
01
g
11
σ
2
e
I
n
i
{6} 0
n
i
— {σ
e
[t
i
,t
i
]
}
a
{1} = intercept + error; {2} =POW;{3} = POW + measurement error; {4} =
intercept + POW; {5} = intercept + linear trend + error; {6} = unspecified where
POW is defined as σ
2
H
i
with H
i
= {h
i,tt
= ρ
|t
i
−t
i
|
}; t
i
is the n
i
×1 vector of ages
at wich measurements are made on individual i.
Variance covariance structures associated with each of these six models are
shown in Table II. Due to the data structure, the power function f(ρ, d)=ρ
d
(in short POW) reduces here to an autoregressive first order process (AR1)
having as correlation parameter ρ
2
.
136 J L. Foulley et al.
EM-REML estimates of the parameters of those models were computed via
the techniques presented previously. Iterations were stopped when the norm
i
∆γ
2
i
/
i
γ
2
i
of both g and r, was smaller than 10
−6
. Estimates of
g and r, −2L values and the corresponding elements of the covariance structure
for each model are shown in Tables III and IV.
Random coefficient models such as {5} are especially demanding in terms
of computing efforts. Models involving time processes and measurement errors
require a backtracking procedure [2] at the beginning of the iterative process
i.e., one has to compute r
[k+1]
as the previous value r
[k]
plus a fraction ω
[k+1]
of
the Fisher scoring increment ∆r
[k+1]
where r
[k]
is the parameter vector defined
as previously at iteration k. For instance, we used
ω =0.10 up to k = 3 in the
case of model 3.
Model comparisons are worthwhile at this stage to discriminate between all
the possibilities offered. However, within the likelihood framework, one has to
check first whether models conform to nested hypotheses for the likelihood test
procedure to be valid.
E.g. model 3 (POW + m-error) can be compared to model 2 (POW), as
model 2 is a special case of model 3 for σ
2
e
= 0, and also to model 1 (intercept)
which corresponds to ρ = 1. The same reasoning applies to the 3-parameter
model 4 (intercept + POW) which can be contrasted to model 1 (equivalent
to model 4 for ρ = 0) and also to model 2 (equivalent to model 4 for g
00
= 0).
In these two examples, the null hypothesis (H
0
) can be described as a point
hypothesis with parameter values on the boundary of the parameter space
which implies some change in the asymptotic distribution of the likelihood ratio
statistic under H
0
[29, 30]. Actually, in these two cases, the asymptotic null
distribution is a mixture 1/2X
2
0
+1/2X
2
1
of the usual chi-square with one degree
of freedom X
2
1
and of a Dirac (probability mass of one) at zero (usually noted
X
2
0
) with equal weights. This results in a P-value which is half the standard
one i.e., P − value = 1/2Pr[X
2
1
> ∆(−2L)
obs
]; see also Robert-Grani´eetal.
[26], page 556, for a similar application.
In all comparisons, model 2 (POW) is rejected while model 1 (intercept)
is accepted. This is not surprising as model 2 emphasizes the effect of time
separation on the correlation structure too much as compared to the values
observed in the unspecified structure (Tab. IV). Although not significantly
different from model 1, models 3 (POW + measurement error) and 5 (intercept
+ linear trend) might also be good choices with a preference to the first one
due to the lower number of parameters.
As a matter of fact, as shown in Table III, one can construct several models
with the same number of parameters which cannot be compared. There are
two models with two parameters (models 1 and 2) and also two with three
parameters (models 3 and 4). The same occurs with four parameters although
only the random coefficient model was displayed because fitting the alternative
model (intercept + POW + measurement error) reduces here to fitting the
sub-model 3 (POW + measurement error) due to ˆg
00
becoming very small.
Incidentally, running SAS Proc MIXED on this alternative model leads to
ˆg
00
= 331.4071, ˆρ =0.2395 and ˆσ
2
e
=1.0268 i.e. to fitting model 4 (intercept +
EM-REML for longitudinal data 137
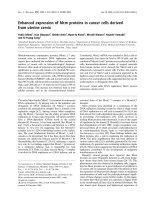
Table III. Likelihood statistics (ML, REML, −2L) of several models for the analysis of facial growth in 11 girls and 16 boys
(Pothoff and Roy [22]
;
Little and Rubbin [14]).
Method Model Random Effect
a
Time process
b
Error
c
Likelihood
g
00
g
01
g
11
σ
2
ρσ
2
e
#iter
d
#par −2L comp ∆[−2L] Distr
e
P -value
{1} 337.27 207.48 16 2 843.6408
{2} 545.40 0.802 9 2 850.7416
REML
{3} 380.96 0.966 164.99 13 3 842.8263 {3}-{2} 7.9153 0:1 0.0024
{3}-{1} 0.8145 0:1 0.1833
{4} 331.42 213.60 0.239 43 3 843.5586 {4}-{2} 7.1830 0:1 0.0037
{4}-{1} 0.0822 0:1 0.3872
{5} 835.50 −46.53 4.42 176.66 163 4 842.3559 {5}-{1} 1.2849 1:2 0.3914
{6}
f
10 835.3176 {6}-{1} 8.3222 8 0.4025
{1} 309.53 201.74 15 2 857.2247
{2} 510.95 0.792 7 2 865.4353
{3} 342.73 0.971 168.69 13 3 856.7004 {3}-{2} 8.7349 0:1 0.0016
{3}-{1} 0.5243 0:1 0.2345
{4} 307.36 203.92 0.151 39 3 857.2106 {4}-{2} 8.2247 0:1 0.0021
{4}-{1} 0.0141 0:1 0.4527
{5} 678.63 −34.99 3.37 177.00 209 4 856.3640 {5}-{1} 0.8607 1:2 0.5019
{6}
f
10 849.1997 {6}-{1} 8.0250 8 0.4310
a
Random effects model intercept (0) and/or slope (1): fixed part with sex, linear regression on age varying according to sex.
b
POW process: Cov
jk
= ρ
d
jk
σ
2
.
c
Residual in random regression models and measurement error σ
2
e
(“ nugget ”) for models involving R
i
= σ
2
H
i
+ σ
2
e
I
n
i
.
d
Stopping rule
: norm set to power −6.
e
Asymptotic distribution of the likelihood ratio under the null hypothesis: Chi-square or mixture of chi-squares.
f
Model with an unspecified covariance structure (10 parameters).
ML
138 J L. Foulley et al.
Table IV. Variance and correlation matrix among measures within individuals generated by several models for the analysis of
facial growth in 11 girls
and 16 boys.
a) REML
Model Variances Correlations
σ
11
σ
22
σ
33
σ
44
r
12
r
23
r
34
r
13
r
24
r
14
{1} inter 544.75 544.75 544.75 544.75 0.6191 0.6191 0.6191 0.6191 0.6191 0.6191
{2} POW 545.40 545.40 545.40 545.40 0.6426 0.6426 0.6426 0.4129 0.4129 0.2654
{3} POW+ m-error 545.95 545.95 545.95
545.95
0.6511 0.6511 0.6511 0.6075 0.6075 0.5669
{4} inter + POW 545.02 545.02 545.02 545.02 0.6304 0.6304 0.6304 0.6094 0.6094 0.6082
{5}
inter
550.31 523.14 531.30 574.77 0.6546 0.6482 0.6651 0.6081 0.6145 0.5448
{6} unspecified 542.29 486.59 626.82 498.94 0.6334 0.4963 0.7381 0.6626 0.6164 0.5225
b) ML
Model Variances Correlations
σ
11
σ
22
σ
33
σ
44
r
12
r
23
r
34
r
13
r
24
r
14
{1} inter 511.26 511.26 511.26 511.26 0.6054 0.6054 0.6054 0.6054 0.6054 0.6054
{2} POW 510.95 510.95 510.95 510.95 0.6265 0.6265 0.6265 0.3925 0.3925 0.2459
{3} POW+ m-error 511.42 511.42 511.42 511.42 0.6323 0.6323 0.6323 0.5967 0.5967 0.5630
{4} 511.28 511.28 511.28 511.28 0.6103 0.6103 0.6103 0.6014 0.6014 0.6012
{5} 511.41 492.74 501.02 536.25 0.6341 0.6302 0.6461 0.5971 0.6041 0.5465
{6} unspecified 505.12 455.79 598.03 462.32 0.6054 0.4732 0.7266 0.6570 0.6108 0.5226
+ slope
inter + POW
inter + slope
EM-REML for longitudinal data 139
POW). However, since the value of −2L
m
for model 4 is slightly higher than
that for model 3, it is the EM procedure which gives the right answer.
5. DISCUSSION-CONCLUSION
This study clearly shows that the EM algorithm is a powerful tool for
calculating maximum likelihood estimates of dispersion parameters even when
the covariance matrix V is not linear in the parameters as postulated in linear
mixed models.
The EM algorithm allows separation of the calculations involved in the R
matrix parameters (time processes + errors) and those arising in the G matrix
parameters (random coefficients), thus making its application to a large class
of models very flexible and attractive.
The procedure can also be easily adapted to get ML rather than REML
estimates of parameters with very little change in the implementation, involving
only an appropriate evaluation of the conditional expectation of u
ik
u
il
and of
ε
∗
i
ε
∗
i
along the same lines as given by Foulley et al. [8]. Corresponding results
for the numerical example are shown in Tables III and IV suggesting as expected
some downward bias for variances of random coefficient models and of time
processes.
Several variants of the standard EM procedure are possible such as those
based e.g., on conditional maximization [15, 18, 19] or parameter expansion
[16]. In the case of models without “measurement errors”, an especially simple
ECME procedure consists of calculating ρ
[t+1]
for σ
2
fixed at σ
2[t]
, with σ
2[t+1]
being updated by direct maximization of the residual likelihood (without
recourse to missing data), i.e.,
ρ
[t+1]
= ρ
[t]
−
I
i=1
tr
∂H
i
∂ρ
(
˜
H
−1
i
− σ
−2
˜
H
−1
i
Ω
i
˜
H
−1
i
)
I
i=1
tr
∂H
i
∂ρ
˜
H
−1
i
∂H
i
∂ρ
˜
H
−1
i
, (20)
σ
2[t+1]
=
I
i=1
y
i
− X
i
ˆ
β(ρ
[t]
, D
[t]
)
[W
i
(ρ
[t]
, D
[t]
)]
−1
[y
i
− X
i
ˆ
β(ρ
[t]
, D
[t]
)]
N − r(X)
where W
i
= Z
i
DZ
i
+ H
i
with D = G/σ
2
, and which can be evaluated using
Henderson’s mixed model equations by
σ
2[t+1]
=
I
i=1
y
i
H
−1
i
(ρ
[t]
)y
i
−
ˆ
θ
I
i=1
T
i
H
−1
i
(ρ
[t]
)y
i
N − r(X)
· (21)
Finally, random coefficient models can also be accommodated to include
heterogeneity of variances both at the temporal and environmental levels [8, 24,
25, 27] which enlarges the range of potentially useful models for longitudinal
data analysis.
140 J L. Foulley et al.
ACKNOWLEDGEMENTS
Thanks are expressed to Barbara Heude for her help in the numerical
validation of the growth example using the SAS
proc mixed procedure and
to Dr. I.M.S. White for his critical reading of the manuscript.
REFERENCES
[1] Dempster A.P., Laird N.M., Rubin D.B., Maximum likelihood from incom-
plete data via the EM algorithm, J. R. Statist. Soc. B 39 (1977) 1–38.
[2] Denis J.E., Schnabel R.B., Numerical methods for unconstrained optimization
and non linear equations, Prentice-Hall Inc, Englewood Cliffs, New Jersey, 1983.
[3] Diggle P.J., An approach to the analysis of repeated measurements, Biometrics
44 (1988) 959–971.
[4] Diggle P.J., Liang K.Y., Zeger S.L., Analysis of longitudinal data, Oxford
Science Publications, Clarendon Press, Oxford, 1994.
[5] Foulley J.L., Quaas R.L., Heterogeneous variances in Gaussian linear mixed
models, Genet. Sel. Evol. 27 (1995) 211–228.
[6] Foulley J.L., Im S., Gianola D., Hoeschele I., Empirical Bayes estimation of
parameters for n polygenic binary traits, Genet. Sel. Evol. 19 (1987) 197–224.
[7] Foulley J.L., Gianola D., San Cristobal M., Im S., A method for assessing
extent and sources of heterogeneity of residual variances in mixed linear models, J.
Dairy Sci. 73 (1990) 1612–1624.
[8] Foulley J.L., Quaas R.L., Thaon d’Arnoldi C., A link function approach to
heterogeneous variance components, Genet. Sel. Evol. 30 (1998) 27–43.
[9] Harville D.A., Recursive estimation using mixed linear models with autoregres-
sive random effects, in: Variance Components and Animal Breeding, in: Proceedings
of a Conference in Honor of C.R. Henderson, Cornell University, Ithaca, NY, 1979.
[10] Henderson C.R., Sire evaluation and genetic trends, in: Proceedings of the
animal breeding and genetics symposium in honor of Dr J Lush, American society of
animal science-American dairy science association, Champaign, 1973, pp. 10–41.
[11] Henderson C.R., Applications of linear models in animal breeding, University
of Guelph, Guelph, 1984.
[12] Lange K., A gradient algorithm locally equivalent to the EM algorithm, J. R.
Stat. Soc B 57 (1995) 425–437.
[13] Laird N.M., Ware J.H., Random effects models for longitudinal data, Bio-
metrics 38 (1982) 963–974.
[14] Little R.J.A., Rubin D.B., Statistical analysis with missing data. J. Wiley
and Sons, New-York, 1977.
[15] Liu C., Rubin D.B., The ECME algorithm: a simple extension of EM and
ECM with fast monotone convergence, Biometrika 81 (1994) 633–648.
[16] Liu C., Rubin D.B., Wu Y.N., Parameter expansion to accelerate EM: The
PX-EM algorithm, Biometrika 85 (1998) 765–770.
[17] Longford N.T., Random coefficient models, Clarendon Press, Oxford, 1993.
[18] Meng X.L., Rubin D.B., Maximum likelihood estimation via the ECM algo-
rithm: A general framework, Biometrika 80 (1993) 267–278.
[19] Meng X.L., van Dyk D.A., Fast EM-type implementations for mixed effects
models, J. R. Stat. Soc. B 60 (1998) 559–578.
[20] Meyer K., Restricted maximum likelihood to estimate variance components
for multivariate animal models with several random effects using a derivative-free
algorithm, Genet. Sel. Evol. 21 (1989) 317–340.
EM-REML for longitudinal data 141
[21] Patterson H.D., Thompson R., Recovery of interblock information when
block sizes are unequal, Biometrika 58 (1971) 545–554.
[22] Pothoff R.F., Roy S.N., A generalized multivariate analysis of variance model
useful especially for growth curve problems, Biometrika 51 (1964) 313–326.
[23] Quaas R.L., REML Note book, Mimeo, Cornell University, Ithaca, New York,
1992.
[24] Robert C., Foulley J.L., Ducrocq V., Inference on homogeneity of intra-class
correlations among environments using heteroskedastic models, Genet. Sel. Evol. 27
(1995) 51–65.
[25] Robert C., Foulley J.L., Ducrocq V., Estimation and testing of constant
genetic and intra-class correlation coefficients among environments, Genet. Sel. Evol.
27 (1995) 125–134.
[26] Robert-Grani´e C., Ducrocq V., Foulley J.L., Heterogeneity of variance for
type traits in the Montb´eliarde cattle breed, Genet. Sel. Evol. 29 (1997) 545–570.
[27] San Cristobal M., Foulley J.L., Manfredi E., Inference about multiplicative
heteroskedastic components of variance in a mixed linear Gaussian model with an
application to beef cattle breeding, Genet. Sel. Evol. 25 (1993) 3–30.
[28] Schaeffer L.R., Dekkers J.C.M., Random regressions in animal models for
test-day production in dairy cattle, in: Proceedings 5th World Cong. Genet. Appl.
Livest. Prod. 18 (1994) 443–446.
[29] Self S.G., Liang K.Y., Asymptotic properties of maximum likelihood estima-
tion and likelihood ratio tests under nonstandard conditions, J. Am. Stat. Assoc. 82
(1987) 605–610.
[30] Stram D.O., Lee J.W., Variance components testing in the longitudinal
mixed effects model, Biometrics 50 (1994) 1171–1177.
[31] Titterington D.M., Recursive parameter estimation using incomplete data.
J.R. Stat. Soc. B 46 (1984) 257–267.
[32] Verbeke G., Molenberghs G., Linear mixed models in practice, Springer
Verlag, New York, 1997.
[33] Wade K.M., Quaas R.L., Solutions to a system of equations involving a first-
order autoregression process, J. Dairy Sci. 76 (1993) 3026–3032.
[34] Wade K.M., Quaas R.L., van Vleck L.D., Estimation of the parameters
involved in a first-order autoregressive process for contemporary groups, J. Dairy
Sci. 76 (1993) 3033–3040.