Báo cáo khoa hoc:" Genetic diversity of eleven European pig breeds" potx
Bạn đang xem bản rút gọn của tài liệu. Xem và tải ngay bản đầy đủ của tài liệu tại đây (312.38 KB, 17 trang )
Genet. Sel. Evol. 32 (2000) 187–203 187
c
INRA, EDP Sciences
Original article
Genetic diversity
of eleven European pig breeds
Guillaume LAVAL
a∗
, Nathalie IANNUCCELLI
a
, Christian
L
EGAULT
b
, Denis MILAN
a
, Martien A.M.GROENEN
c
,
Elisabetta G
IUFFRA
d
, Leif ANDERSSON
d
, Peter H. NISSEN
e
,
Claus B. J
ØRGENSEN
e
, Petra BEECKMANN
f
,
Hermann G
ELDERMANN
f
, Jean-Louis FOULLEY
b
,
Claude C
HEVALET
a
, Louis OLLIVIER
b
a
Laboratoire de g´en´etique cellulaire, Institut national de la recherche agronomique,
BP 27, 31326 Castanet-Tolosan Cedex, France
b
Station de g´en´etique quantitative et appliqu´ee, Institut national de la recherche
agronomique, 78352 Jouy-en-Josas Cedex, France
c
Wageningen Institute of Animal Science, Wageningen Agricultural University,
Wageningen, The Netherlands
d
Department of Animal Breeding and Genetics, Swedish University
of Agricultural Sciences, Uppsala, Sweden
e
Division of Animal Genetics, the Royal Veterinary and Agricultural University,
Copenhagen, Denmark
f
Department of Animal Breeding and Biotechnology, Universit¨at Hohenheim,
Stuttgart, Germany
(Received 8 July 1999; accepted 14 January 2000)
Abstract – A set of eleven pig breeds originating from six European countries,
and including a small sample of wild pigs, was chosen for this study of genetic
diversity. Diversity was evaluated on the basis of 18 microsatellite markers typed over
a total of 483 DNA samples collected. Average breed heterozygosity varied from 0.35
to 0.60. Genotypic frequencies generally agreed with Hardy-Weinberg expectations,
apart from the German Landrace and Schw¨abisch-H¨allisches breeds, which showed
significantly reduced heterozygosity. Breed differentiation was significant as shown
by the high among-breed fixation index (overall F
ST
=0.27), and confirmed by
the clustering based on the genetic distances between individuals, which grouped
essentially all individuals in 11 clusters corresponding to the 11 breeds. The genetic
distances between breeds were first used to construct phylogenetic trees. The trees
indicated that a genetic drift model might explain the divergence of the two German
∗
Correspondence and reprints
E-mail:
188 G. Laval et al.
breeds, but no reliable phylogeny could be inferred among the remaining breeds. The
same distances were also used to measure the global diversity of the set of breeds
considered, and to evaluate the marginal loss of diversity attached to each breed. In
that respect, the French Basque breed appeared to be the most “unique” in the set
considered. This study, which remains to be extended to a larger set of European
breeds, indicates that using genetic distances between breeds of farm animals in
a classical taxonomic approach may not give clear resolution, but points to their
usefulness in a prospective evaluation of diversity.
genetic diversity / molecular marker / conservation / pig / European breed
R´esum´e – Diversit´eg´en´etique de onze races porcines europ´eennes.
Un ensemble
de onze races porcines en provenance de six pays europ´eens, et incluant un petit
´echantillon de sangliers, a ´et´e choisi pour une ´etude de diversit´eg´en´etique. Cette
diversit´ea´et´e´evalu´ee sur la base de 18 marqueurs microsatellites typ´es sur un total
de 483 ´echantillons d’ADN. Les races ´etudi´ees manifestent un taux d’h´et´erozygotie
allant de 0,35 `a 0,60. Les locus sont en ´equililibre de Hardy-Weinberg `a l’exception
du cas des races allemandes Landrace et Schw¨abisch-H¨allisches, qui manifestent un
d´eficit d’h´et´erozygotes. L’indice de diff´erenciation entre races est ´elev´e(F
ST
global
de 0,27) et les distances g´en´etiques entre individus permettent de les regrouper
pratiquement en 11 ensembles distincts, correspondant aux 11 races consid´er´ees. Les
distances g´en´etiques entre races ont d’abord ´et´e utilis´ees pour construire des arbres
phylog´en´etiques. Ces arbres sugg`erent qu’un mod`ele de d´erive g´en´etique pourrait
expliquer la divergence des deux races allemandes, mais aucune phylog´enie fiable
n’a pu ˆetre ´etablie entre les races restantes. Les mˆemes distances ont ensuite ´et´e
utilis´ees pour mesurer la diversit´eg´en´etique globale de l’ensemble et ´evaluer la perte
marginale de diversit´e associ´ee `a chacune des races ´etudi´ees. De ce point de vue,
la race fran¸caise Basque apparaˆıt comme la plus originale dans l’ensemble consid´er´e.
Cette ´etude, qui reste `a´etendre `a un plus grand nombre de races europ´eennes, indique
que l’utilisation des distances entre races animales domestiques dans une approche
taxonomique classique risque d’avoir un faible pouvoir de r´esolution, mais elle souligne
l’int´erˆet de les utiliser plutˆot pour des ´evaluations prospectives de diversit´e.
diversit´eg´en´etique / marqueur mol´eculaire / conservation / porc / race eu-
rop´eenne
1. INTRODUCTION
Europe contains a large proportion of the pig world population (circa 30%)
as well as of the pig world genetic diversity (37% of the breeds included in the
FAO inventory, according to Scherf [25]). However, the European pig industry
relies predominantly on a limited number of breeds, since one single breed,
the widely known Yorkshire (Large White in many countries), represents about
one third of the slaughter pig’s gene pool of the European Union. Europe thus
needs sources of novel genetic variation in order to improve commercial lines, as
exemplified by the Chinese Meishan breed included in several synthetic lines.
Also, novel genetic variants may be needed in order to respond to changes in
consumer demand or to be integrated in sustainable agricultural systems.
Conservation programmes, using both in situ and ex situ techniques, are
already under way in several European countries. In particular, gene banks
are currently being developed, though there are few for the pig. The need for
Genetic diversity in pigs 189
quantifying biodiversity in order to better rationalize conservation policies is
recognized (see Weitzman [32]).
In order to facilitate and rationalize the maintenance of pig genetic diversity,
it is essential that simple assays be quickly developed taking advantage of the
molecular genetics tools now available. Such tools have recently been developed
through progress made in genome studies and genotyping technologies. Major
contributions to the making of genetic maps have been made through the
EC-co-ordinated Pig Gene Mapping Project (PiGMaP) over the period 1991-
1996 (Archibald et al. [2]). In the second phase of this project, covering the
period 1994-1996, a pilot study on genetic diversity was planned (Archibald [1]),
along the recommendations made in 1993 to FAO by a working group (Barker
et al. [4]). The results obtained are presented in this paper, and conclusions for
further investigations are discussed.
2. MATERIALS AND METHODS
2.1. The breeds sampled
In order to sample the European pig diversity, an initial set of 12 breeds
belonging to 7 different countries was identified and animals were selected
according to the following sampling protocol. In large breeds, the sampling
objective was 50 animals (25 males, 25 females) unrelated at the grandparental
level. For smaller breeds, as this was often not possible, the objective was a male
and a female from each of 25 litters, each litter being farrowed by a different
female, and the 25 litters representing as many different sires as possible. The
7 laboratories involved in the study were responsible for blood collection and
preparation of the DNA samples in the breed(s) of their respective countries.
The 12 breeds of the study are listed in [1] (Tab. of p. 200). The Tamworth
breed was eventually not sampled, and the remaining set in this analysis
therefore included 11 breeds, originating from 6 countries. Table I gives the
list of those breeds, the codes used in the following presentation and the sizes
of the samples. It can be seen that the objective of 50 pigs per breed was
only reached (or approached) in the first 8 breeds of Table I. It should also be
mentioned that the Wild Pig sample provided by Sweden (SEWP) came from
wild animals hunted in Poland. For that reason, this population could not be
sampled according to the rules applied in domestic breeds. Finally a total of
483 DNA samples were collected (see Tab. I).
General information on those breeds is entered in the Animal Genetic
Data Bank of the European Association for Animal Production
(EAAP-AGDB). This information may be found in [26] and at
Similar informa-
tion may be found in the FAO Domestic Animal Diversity Information System
(DAD-IS: see [25] and />190 G. Laval et al.
Table I. Distribution of the breeds sampled in the European countries. (Numbers
in parentheses for total males and females assume equal numbers of each sex for the
SELR and SEWP).
Country-breed code Number of DNA samples
Country Breed name (entry number
in EAAP-AGDB) M F Total
Belgium Pi´etrain BEPI (988) 25 25 50
Denmark Sortbroget DKSO (1005) 14 45 59
France Basque FRBA (987) 22 25 47
France Gascon FRGA (935) 25 31 56
France Limousin FRLI (967) 27 29 56
France Normand FRNO (982) 21 31 52
(or Blanc de l’Ouest)
Germany German Landrace DELR (918) 25 25 50
Germany Schw¨abisch-H¨allisches DESH (997) 20 25 45
The Netherlands Great Yorkshire NLLW (938) 21 11 32
Sweden Swedish Landrace SELR (not entered) - - 24
Sweden European Wild Pig SEWP (not entered) - - 12
Total 200(218) 247(265) 483
2.2. The panel of microsatellite markers selected and the typings
A panel of microsatellite markers was selected by D. Milan (INRA) and
M. Groenen (WAU), following the FAO recommendations for diversity anal-
yses [4], and further approved by the FAO-ISAG Advisory Committee for
genetic distance studies. The markers were chosen for their quality, poly-
morphism, and absence of null alleles at the time of selection. At least one
marker on each chromosome was selected, apart from chromosome 18 (see
Tab. II). When two markers were on the same chromosome, they were cho-
sen with a minimal distance of 30 cM (for more information on the panel see
Table II also gives the num-
bers of alleles per locus in this set, which are on average markedly above those
found in the reference families of [2] and [23].
The typings of the DNA samples were distributed among the five following
laboratories: Castanet-Tolosan (Toulouse) for the four FR breeds and the BEPI,
Wageningen for the NLLW, Hohenheim (Stuttgart) for the two DE breeds,
Copenhagen for the DKSO and Uppsala for the SELR and SEWP breeds. All
laboratories used automated ABI sequencers with fluorescent dyes, apart from
the Hohenheim Laboratory where an ALF automated sequencer was used.
For further standardization of genotypes, 4 control animals were analysed
either on the same gels (FR, BE, NL, DK, SE), or on control gels (DE). These 4
animals were chosen from the PiGMaP reference families [2], namely 2 French
F1 animals from a Large White × Meishan cross and 2 Swedish F1 animals
from a Wild Pig × Large White cross.
Genetic diversity in pigs 191
Table II. The panel of markers.
Chromosome Marker Nb of alleles Nb of individuals
arm (1) (2) unambiguously genotyped
1p CGA 12 20 D
a
1q S0155 6 7 464
2p SW240 8 11 463
2q S0226 9 13 460
3p SW72 8 9 D
3q S0002 7 16 395
4p S0227 10 8 465
5q S0005 7 20 440
5q IGF1 10 12 451
6q SW122 10 9 459
6q S0228 12 10 D
7q SW632 6 13 466
7q S0101 9 8 D
8q S0225 8 10 467
8q S0178 4 11 454
9p SW911 9 9 462
10q SW951 5 4 462
11q S0386 10 8 D
12q S0090 4 8 461
13q S0068 9 16 D
13q S0215 10 8 456
14q SW857 6 9 456
15q S0355 14 8 D
15q SW936 13 11 D
16q S0026 8 7 D
17q SW24 8 13 455
Xq S0218 8 9 451
TOTAL (Mean) 27 230(8.5) 287(10.6) 8187(455)
(1) PiGMaP (Archibald et al. [2]) and USDA (Rohrer et al. [23]) reference families. (2)
Present study.
a
D: Marker discarded because no individual could be unambiguously
genotyped in one or several breeds.
192 G. Laval et al.
Moreover, to avoid differences in primer synthesis, all laboratories used
primers from a single synthesis provided by Max Rothschild (Ames, Iowa).
Raw data (allele size) were collected in Toulouse for identification of geno-
types (allele reference sizes are available at />/panel/refsize.htm).
In spite of the standardization, it was not always possible to unambiguously
identify the genotypes analysed in 5 different laboratory conditions. Thus the
number of genotypes identified was generally variable across breeds and loci,
and the genotype could not be determined for some breed-marker combinations
(see Tab. II). In particular, genotypes could not be unambiguously identified for
7 markers (SW72, S0228, S0101, S0386, S0068, S0355, SW936) in DELR and
DESH. In addition, the CGA locus exhibited very long alleles that could not be
resolved in most breeds and also had to be discarded. As a result, only 18 loci
could be used for comparing the breeds. Finally, out of the 483 DNA samples
collected a maximum of 467 animals could be used in the genetic analyses (see
Tab. II).
2.3. Genetic analysis
2.3.1. Within-breed diversity
Observed heterozygosities and their unbiased estimates taking account of
sample sizes were computed per autosomal locus and per breed, according to
the method described in [6]. An exact test of Hardy-Weinberg equilibrium was
performed (GENEPOP [20]), with a Bonferoni correction for repeated tests
over 187 breed-locus combinations. The exact P-value was obtained either by
the complete enumeration method [15] for loci with fewer than five alleles, or
by the Markov Chain method of [12] otherwise.
2.3.2. Between-breed diversity
Breed differentiation was evaluated by the fixation indices of Wright (see
[30] and [22]). The null hypothesis of random mating within and between pop-
ulations was tested by means of permutation tests (allele permutation within
population to test for F
IS
, and individual permutation between populations to
test for F
ST
) as shown by [6].
Genetic distances between individuals were estimated on the basis of their
own genotypes, using a multi-locus estimation of the kinship coefficients. This
between individual genetic distance D
BI
is defined as D
BI
=1− P [drawing
two identica1 alleles from the two individuals] [7, 8], setting D
BI
= 0, however,
when the two individuals have identical genotypes.
Genetic distances between breeds were calculated based on the allelic fre-
quencies in each breed, or in each breed-sex combination with appropriate
weight for the X-linked marker (1/3 for males and 2/3 for females). An equal
number of males and females was assumed in the 2 breeds (SELR and SEWP) in
which the sex was not identified. Two measures of distances were used, namely
the Reynolds’ [21] and the standard Nei’s distances [17], taking account of the
corrections needed for small sample size [18].
Genetic diversity in pigs 193
2.3.3. Clustering, phylogenetic tree reconstruction and measures
of breed diversity
Distances between individuals were used to infer phylogenies by the un-
weighted pair-group method with arithmetic mean (UPGMA) described in [13],
[27] and [5]. Distances between breeds were also used for tree construction ac-
cording to the neighbour-joining algorithm of [24], giving unrooted trees. The
bootstrapping procedure of PHYLIP [9] was used to evaluate the significance of
tree nodes and was extended to account for unequal sample size across breeds
and loci.
Genetic distances can also be used to measure diversity, as proposed by
Weitzman [31, 32]. This approach has been implemented here to provide
a further upward hierarchical representation of the breeds and to evaluate
marginal losses of diversity due to various patterns of breed extinction, as
advocated by [28].
3. RESULTS
3.1. Heterozygosity and deviation from Hardy-Weinberg
equilibrium
For each breed, Table III shows the observed and expected heterozygosities
and the numbers of alleles averaged across the 17 autosomal loci. Observed
heterozygosities ranged from 0.35 (for FRBA) to 0.60 (for BEPI) and average
numbers of alleles from 3.22 (FRBA) to 5.72 (DESH). Three loci, S0215, S0225
Table III. Average within-breed marker polymorphism (17 autosomal loci).
Number Average number of Test of
Breed genotyped Heterozygosity alleles H.W. N
b
e
(range across equilibrium
a
loci) Observed Expected Observed Effective
BEPI 40-46 0.60 0.59 5.33 2.44 NS 32686
DKSO 47-50 0.53 0.55 5.17 2.22 NS 44
FRBA 40-46 0.35 0.35 3.22 1.54 NS 13
FRGA 18-56 0.47 0.50 4.05 2 NS 28
FRLI 41-56 0.43 0.44 3.70 1.78 NS 13
FRNO 33-52 0.50 0.50 4.28 2. NS 33
DELR 38-50 0.54 0.62 5.61 2.63
∗
(0.15) 1837
DESH 41-45 0.53 0.66 5.72 2.94
∗
(0.20) 128
NLLW 28-30 0.51 0.50 4.11 2 NS 7368
SELR 20-24 0.57 0.57 4.78 2.32 NS -
SEWP 9-12 0.58 0.59 4.55 2.44 NS -
a
NS: not significant ;
∗
: P<0.05 and value of F
IS
(Weir and Cockerham [29]).
b
N
e
: effective population size given in Simon and Buchenauer [25].
194 G. Laval et al.
and SW951, were fixed in 6, 2 and 1 of our breeds respectively, and the 2 loci of
chromosome 5, S0005 and IGF1, reached a 0.92 observed heterozygosity in the
wild pig sample. The heterozygosities observed are close to their expectations
in all breeds except in DELR and DESH which show a markedly reduced
heterozygosity.
Deviations from Hardy-Weinberg equilibrium are significant for 8 locus-
breed combinations out of 187, which represents a percentage slightly below
the 5% expected in such a number of tests under the hypothesis of equilibrium.
However the deviations are all observed in DESH and DELR, which are
the only two breeds showing a globally significant deviation. In both cases,
deviation from Hardy-Weinberg equilibrium is linked to a quite high positive
F
IS
. Table III also shows that the breeds vary relatively more in effective size
than in heterozygosity. However, the significant rank correlation (0.8) between
population size and heterozygosity among the breeds in Table II indicates a
tendency for a positive association.
3.2. Breed differentiation and genetic distances
The fixation indices of Table IV show a generally high level of ge-
netic differentiation between breeds, with quite large differences across loci.
Table IV. Fixation indices per locus (Weir and Cockerham [30]; standard error in
parentheses).
Chromosome Locus F
IS
F
IT
F
ST
1 S0155 0.040 (0.028) 0.284 (0.075) 0.254 (0.087)
2 SW240 0.028 (0.057) 0.190 (0.083) 0.167 (0.063)
2 S0226 0.105 (0.078) 0.374 (0.075) 0.300 (0.068)
3 S0002 0.007 (0.010) 0.247 (0.063) 0.242 (0.060)
4 S0227 0.239 (0.117) 0.327 (0.093) 0.116 (0.034)
5 S0005 −0.009 (0.029) 0.185 (0.034) 0.193 (0.026)
5 IGF1 −0.018 (0.061) 0.165 (0.064) 0.180 (0.041)
6 SW122 −0.002 (0.053) 0.138 (0.043) 0.140 (0.028)
7 SW632 0.115 (0.080) 0.360 (0.059) 0.277 (0.053)
8 S0225 0.146 (0.041) 0.458 (0.123) 0.365 (0.120)
8 S0178 0.024 (0.028) 0.154 (0.042) 0.133 (0.037)
9 SW911 0.070 (0.057) 0.362 (0.075) 0.314 (0.080)
10 SW951 0.128 (0.061) 0.409 (0.043) 0.321 (0.066)
12 S0090 0.018 (0.044) 0.375 (0.095) 0.363 (0.088)
13 S0215 0.218 (0.081) 0.794 (0.116) 0.737 (0.160)
14 SW857 0.068 (0.034) 0.328 (0.069) 0.279 (0.077)
17 SW24 0.060 (0.037) 0.367 (0.036) 0.327 (0.038)
X S0218 0.090 (0.115) 0.310 (0.119) 0.243 (0.080)
TOTAL 0.052 (0.013) 0.306 (0.030) 0.270 (0.025)
Genetic diversity in pigs 195
Table V. Genetic distances between the eleven breeds (18 marker loci).
Reynolds genetic distance (above the diagonal), and Nei standard genetic distance (below the diagonal), (largest distances in bold;
smallest distances in italic).
BEPI DKSO FRBA FRGA FRLI FRNO DELR DESH NLLW SELR SEWP
BEPI 0.2155 0.3046 0.1532 0.2464 0.2133 0.2389 0.2014 0.2128 0.1024 0.1856
DKSO 0.4349 0.3775 0.2794 0.2534 0.2275 0.2641 0.2321 0.2984 0.1703 0.2363
FRBA 0.4525 0.6772 0.2725 0.4358 0.3397 0.4229 0.3589 0.3990 0.2918 0.3010
FRGA
0.2344
0.5669 0.3205 0.2963 0.2714 0.2961 0.2382 0.2711 0.1970 0.2209
FRLI 0.3807 0.3810 0.6696 0.4489 0.3126 0.3414 0.2886 0.2862 0.2371 0.2740
FRNO 0.3564 0.3760 0.4536 0.4498 0.4698 0.3082 0.2553 0.3138 0.1808 0.2210
DELR 0.6116 0.6920 1.1223 0.7532 0.7949 0.7658 0.1172 0.3107 0.2381 0.2860
DESH 0.5088 0.6085 0.7943 0.5490 0.6113 0.5825 0.2607 0.2799 0.2000 0.2090
NLLW 0.3416 0.5806 0.6151 0.4328 0.3877 0.5346 0.7444 0.6677 0.1994 0.3150
SELR 0.1634 0.3003 0.4101 0.3289 0.3513 0.2740 0.5935 0.4907 0.3043 0.1913
SEWP 0.3770 0.5236 0.4546 0.4109 0.4708 0.3871 0.9168 0.5632 0.7106 0.3864
196 G. Laval et al.
After 5000 permutations, performed with GENETIX [6], all F
ST
calculated by
pair of breeds are significantly different from 0 (P<0.0002). Table V gives the
Reynolds’s and Nei’s standard genetic distances. The two smallest distances
are obtained for the pairs BEPI-SELR (with both distances) and either DESH-
DELR for Reynolds or BEPI-FRGA for Nei standard. The two largest distances
are between FRBA on one hand and, on the other hand, either FRLI and DELR
for Reynolds or DELR and DESH for Nei standard.
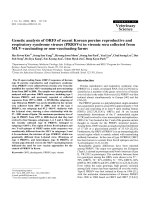
3.3. Clustering and phylogenetic trees
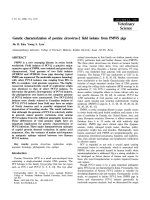
The between individuals UPGMA tree of Figure 1 shows eleven clusters
grouping the individuals which belong to the same breed. The only exceptions
are an exchange between DESH and DELR and a DESH individual which does
not fit in with any breed.
Figure 1. Hierarchical clustering based on genetic distances between individuals.
Genetic diversity in pigs 197
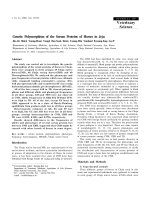
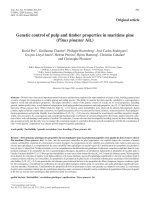
The neighbor-joining trees based on both distances indicate that, apart from
the two German breeds, no reliable phylogeny can be inferred since only the
node linking the two German breeds shows a bootstrap value (of 90%) close
to significance. When the analysis was restricted to the 9 breeds for which
genotypes were available at 25 loci (thus excluding the two German breeds),
even lower bootstrap values were obtained (results not shown). This suggests
that no reliable phylogeny can be constructed among those breeds, as if they
had differentiated according to a radiative scheme of divergence. In an analysis
restricted to the ten domestic breeds, after excluding the small sample of wild
pigs, the phylogeny of Figure 2 was obtained, further confirming a radiative
scheme of divergence.
Figure 2. Neighbor-joining tree of the ten domestic breeds.
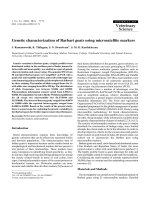
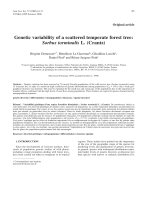
3.4. Distribution and amount of diversity
The Weitzmann representation, based on the Reynolds distance, is shown in
Figure 3, in which the branch length of each breed can be read as approximately
measuring its relative contribution to the corresponding diversity function. The
marginal losses of diversity attached to each breed, which may be taken as
a measure of their “uniqueness”, are shown in Table VI, based on the two
distances considered. On average, the highest and lowest losses of diversity are
incurred with the extinction of the Basque or the Pi´etrain breeds, respectively.
It can also be seen from Table VI that the loss of the two German breeds (DELR
and DESH) induces a markedly higher loss than the sum of the corresponding
individual breed losses, whereas the losses attached to two French local breeds
(FRBA and FRLI) add up almost exactly.
4. DISCUSSION
4.1. Within population structure
In these European pig breeds, average heterozygosity observed is around 0.5
(Tab. III). This level of polymorphism is similar to the values so far reported
for microsatellites in European pig and cattle breeds, e.g. by [10], [29] and [16],
but below the values observed in human or chimpanzee populations where the
expected heterozygosity ranges from 0.7 to 0.9 [11].
198 G. Laval et al.
Table VI. Marginal losses of Weitzman’s diversity
(1)
Breed loss
Reynolds Nei standard Average
(Q)
V (S/Q)∆=V (S) −V (S/Q)∆V/V V (S/Q)∆V = V (S) −V (S/Q)∆V/V (S)∆V/V (S)
%%%
None (0)
24810 0 0.00 46103 0 0.00 0.00
BEPI (1)
23786 1024 4.13 44469 1634 3.54 3.84
DKSO (2)
22640 2170 8.75 40399 5704 12.37 10.56
FRBA (3)
20452 4358 17.57 40170 5933 12.87 15.22
FRGA (4)
22253 2557 10.31 43574 2529 5.49 7.90
FRLI (5)
21512 3298 13.29 42293 3810 8.26 10.78
FRNO (6)
21987 2823 11.38 42606 3497 7.59 9.48
DELR (7)
22531 2279 9.19 39595 6508 14.12 11.65
DESH (8)
23638 1172 4.72 43496 2607 5.65 5.19
NLLW (9)
21951 2859 11.52 40297 5806 12.59 12.06
SELR (10)
23615 1195 4.82 44284 1819 3.95 4.38
SEWP (11)
22601 2209 8.90 41557 4546 9.86 9.38
3 + 5
17314 7496 30.21 36360 9743 21.13 25.67
7 + 8
20268 4542 18.31 32273 13830 30.00 24.15
2 + 10
21340 3470 13.99 38580 7523 16.32 15.15
3 + 4 + 5 + 6
12425 12385 49.92 29167 16936 36.74 43.33
2 + 7 + 8 + 10
16798 8012 32.29 25160 20943 45.43 38.86
2 + 3 + 5 + 7 + 9
10018 14792 59.62 18568 27535 59.72 59.67
(1)
V (S/Q) = diversity after deleting Q from the whole set S resulting in an absolute ∆V = V (S) −V (S/Q) and in a relative change
∆V/V (S) of diversity (distance values multiplied by 10 000).
.
Genetic diversity in pigs 199
Figure 3. Dendrogram of relationship established by the method of Weitzman [31]
using the Reynolds pairwise distances among the ten domestic breeds and the wild
pig.
This level of polymorphism when compared to the corresponding effective
sizes of the breeds, ranging from 13 to over 30 000 (Tab. III), cannot be seen
as the result of an equilibrium between drift and mutation. Under such a
model, assuming a mutation rate u of about 10
−4
for microsatellites and with
the effective sizes of Table III, 4N
e
u should vary from 0.005 to 13 and the
equilibrium values of heterozygosities would be expected to vary from 0.005 to
0.93. This contrast with the observed values, though based on current effective
sizes which may not reflect past ones, tends to confirm that standard population
genetics models cannot be easily extended to sets of breeds of farm animals;
probably because they cannot be considered as separate closed populations.
Since the 27 markers were selected, null alleles have been identified in
other familial studies: for instance S0215 (Moser et al. unpublished), and
S0386 (Archibald et al., personal communication). However, our study did not
provide any evidence of null alleles since 179 breed-locus combinations out of
187 may be considered as being in Hardy-Weinberg equilibrium. Therefore,
if null alleles existed in our breeds their frequencies would probably be low
and would not greatly distort the genotypic frequencies. In addition, all loci
showing a significant deviation from random union of gametes belonged to the
two German breeds. This suggests some inbreeding effect, counterbalanced by
high numbers of alleles (yielding a high expected heterozygosity), though the
presence of null alleles only in these breeds cannot be excluded.
4.2. Genetic structure of the 11 breeds sampled
The microsatellites used did not exhibit any breed specific allele allowing
simple identification of the breed to which each animal belonged. However,
200 G. Laval et al.
the UPGMA tree of individuals is in very good agreement with the breed
structure (Fig. 1). More precisely, using breed allelic frequencies to calculate
the likelihood that an animal belongs to a given breed and then assigning the
animal to the breed showing the largest likelihood (as proposed by Paetkau et
al. [19]) allowed all animals to be correctly assigned. In most cases this result
was obtained because an individual from one breed carried at least one allele
which was absent in the other breeds. This indicates that these markers provide
a way of measuring the genetic differentiation between the breeds considered.
This strong differentiation is also confirmed by the very large F
ST
values of
Table IV.
Neglecting the effects of migration, and assuming a low contribution of
mutations to the genetic diversity between these breeds, the differences in allelic
frequencies may be interpreted as primarily due to random genetic drift. The
genetic differentiation may be seen as the result of an increased mean inbreeding
coefficient F over a rather recent period of time. Under this hypothesis, the most
appropriate measure of diversification is provided by the Reynolds distance.
This distance has an expected value of 0.5(F
1
+ F
2
), where F
1
and F
2
are
the increases of inbreeding since divergence, or, more generally the average F
i
,
with, F
i
=1−
1 −
1
2N
i
n
,i=1, 2, assuming n generations of divergence
and a constant effective size N
i
.
The tree of Figure 2 shows that DESH and DELR are closely related.
The high distances separating them from the other breeds and their higher
numbers of alleles suggest that genetic drift might have structured these breeds
into 2 groups, a group of German breeds and another group of non-German
breeds among which it is difficult to distinguish any particular structure. The
assumption of a radiative divergence of the non-German breeds agrees with
the tentative phylogeny of Figure 2, which may sum up our interpretation of
the genetic differences observed between these European breeds. On the other
hand, the dendrogram of Figure 3 could suggest the existence of a distinct
subset of breeds belonging to the Landrace family, extending from the DELR
to the FRNO branches. These interpretations are of course limited to the ten
domestic breeds available in this study and they would obviously need to be
confirmed on a larger set.
4.3. Breed diversity
This study gave an opportunity for evaluating the global diversity of the
set of breeds considered, using the approach of Weitzman [31, 32]. Table VI
clearly shows the wide range of the contributions of each breed to the overall
diversity, ranging from about 4 to 15%. Table VI also shows that the results
are not entirely consistent over the 2 measurements of genetic distances used.
It can be noted that the Reynolds distance appears to be slightly more
discriminating between breeds, since contributions range from 4 to 17%. Based
on this distance, the 4 French local breeds altogether account for half of the
total diversity, which is an indication of the potential value of preserving local
endangered breeds in the maintenance of a species biodiversity. But, here again,
our conclusions should be considered as relative to the limited sample of breeds
Genetic diversity in pigs 201
considered, and do not preclude conclusions which might be obtained on a more
comprehensive set of breeds.
5. CONCLUSIONS
This study may be one of the first demonstrations of the feasibility of evalu-
ating genetic diversity across different countries following the FAO recommen-
dations [4]. An evaluation of buffalo genetic diversity along the same lines by
Barker et al. [3] is also to be mentioned. Once an agreement is reached on a
common set of markers, the essential requirements for achieving comparability
of allele sizing between different laboratories are (i) to include on the same gel a
set of common control DNA samples previously distributed to the participants,
and (ii) to preferably use primers derived from a single synthesis, as done in
the present experiment. For further studies, we strongly suggest use of DNA
from the control animals mentioned before, which are available upon request
to L. Andersson and D. Milan.
The panel of markers used in this trial exhibited a very high polymorphism,
confirming an early study of microsatellite polymorphisms in 4 major pig breeds
by [10] and the study on Belgian pig breeds of [29]. There are also good
indications that null alleles were at a low frequency in the samples investigated.
The 11 breeds chosen exhibit a very strong differentiation. In spite of this, it
appeared difficult to infer any reliable phylogeny among those populations.
This may not be too surprising given that our present domestic breeds are not
likely to have resulted from a strict tree-like branching process, as noted by
[28]. On the other hand, there is a need for measuring the overall diversity of a
set of breeds, since prospective evaluations of diversity are required for defining
appropriate conservation policies, as advocated by [32]. Such an approach may
be based on standard genetic distances, which is the Weitzman approach,
though similar procedures may also be implemented from contingency tables of
allelic frequencies, as shown by [14]. Our results certainly point to the usefulness
of global evaluations of diversity using molecular markers for the choice of
breeds worthy of preservation. However, as stressed by [4], final decisions should
take into account additional information on traits of economic importance and
on specific adaptive features.
ACKNOWLEDGEMENTS
This project was essentially supported by the EC Biotechnology programme
(PiGMaP contract BIO2-CT94-3044, coordinated by A. Archibald). Comple-
mentary support was provided by the EC Framework IV programme (contract
BIO4-CT98-0188). Additional financial support from the French Ministry of
Agriculture is also gratefully acknowledged.
The DNA samples from the Pi´etrain breed were prepared by Alex van
De Weghe and Luc Peelman (Ghent, Belgium). The sampling and DNA
preparation for the French samples are due to the cooperative efforts of D.
Brault, G. Burgaud, J.C. Caritez and J. Gruand (INRA) and M. Luquet and
F. Labroue (Institut technique du porc).
202 G. Laval et al.
We thank Prof. Max Rothschild (Ames, Iowa), US Pig Genome Co-ordinator,
for having freely provided the primers to the five typing laboratories in this
project.
Comments made by two anonymous referees are also gratefully acknowl-
edged.
REFERENCES
[1] Archibald A., The pig gene mapping project (PiGMaP) - identifying trait
genes, in: Hoeveler A., Cresti M. (Eds.), Biotechnology (1992-1994) Final Report,
Office for Official Publications of the European Communities, Luxembourg, 1997,
vol. 2, pp. 193–207.
[2] Archibald A., Haley C.S., Brown J., Couperwhite S., Mc Queen H.A., et al.,
The PiGMaP consortium linkage map of the pig (Sus scrofa), Mamm. Genome 6
(1995) 157–175.
[3] Barker J.S.F., Moore S.S., Hetzel D.J.S., Evans D., Tan S.G., Byrne K., Ge-
netic diversity of Asian water buffalo (Bubalus bubalis): microsatellite variation and
a comparison with protein-coding loci, Anim. Genet. 28 (1997) 103–115.
[4] Barker J.S.F., Hill W.G., Bradley D., Nei M., Fries R., Wayne R.K., Mea-
surement of domestic animal diversity (MoDAD): original working group report, FAO,
Rome, 1998.
[5] Becker R.A., Chambers J.M., Wilks A.R., The New S Language, Wadsworth
and Brooks/Cole, Pacific Grove, California, 1988.
[6] Belkhir K., Borsa P., Goudet J., Chikhi L., Bonhomme F., GENETIX, logi-
ciel sous WindowsTM pour la g´en´etique des populations, Laboratoire g´enome et pop-
ulations, CNRS UPR 9060, Universit´e de Montpellier II, Montpellier (France) (1998).
[7] Branlard G., Chevalet C., Sur la diversit´e des bl´es tendres cultiv´es en France,
Agronomie 4 (1984) 933–938.
[8] Chevalet C., Calcul des coefficients d’identit´e, in´egalit´es et distances g´en´etiques,
in: Legay J.M. (Eds.), Biom´etrie et G´en´etique, Soc. Fr. Biom. INRA (1980) pp. 42–49.
[9] Felsenstein J., PHYLIP (Phylogeny Inference Package) Version 3.5, Depart-
ment of Genetics, University of Washington, Seattle, 1993.
[10] Fredholm M., Winterø A.K., Christensen K., Kristensen B., Nielsen P.B.,
Davies W., Archibald A., Characterization of twenty four porcine (dA − dC)n −
(cT − cG)n microsatellites: Genotyping of unrelated animals from four breeds and
linkage studies, Mamm. Genome 4 (1993) 187–192.
[11] Garza J.C., Montgomery S., Freimer N.B., Microsatellite allele frequencies
in humans and chimpanzees with implications for constraints on allele size, Mol. Biol.
Evol. 12 (1995) 594–603.
[12] Guo S.W., Thompson E.A., Performing the exact test of Hardy-Weinberg
proportions for multiple alleles, Biometrics 48 (1992) 361–372.
[13] Hartl D.L., Clark A.G., Principles of Population Genetics, 3rd edn., Sinauer,
Sunderland, Massachussets, 1997.
[14] Lalo¨e D., Moazami-Goudarzi K., Souvenir Zafrindrajaona P., Analyse des
correspondances et biodiversit´e dans les races domestiques, Journ´ees de la soci´et´e
fran¸caise de Biom´etrie, 20-21 mai 1999, Grenoble, 5 p.
[15] Louis E.J., Dempster E.R., An exact test for Hardy-Weinberg and multiple
alleles, Biometrics 43 (1987) 805–811.
[16] MacHugh D.E., Loftus R.T., Bradley D.J. Sharp P.M., Cunningham P.,
Microsatellite DNA variation within and among European cattle breeds, Proc. R.
Soc. Lond. 256 (1994) 23–31.
Genetic diversity in pigs 203
[17] Nei M., Genetic distances between populations, Am. Nat. 106 (1972) 283-292.
[18] Nei M., Estimation of average heterozygosity and genetic distance from a
small number of individuals, Genetics 89 (1978) 583–590.
[19] Paetkau D., Calvert W., Stirling I., Strobeck C., Microsatellite analysis of
population structure in Canadian polar bears, Mol. Ecol. 4 (1995) 347–354.
[20] Raymond M., Rousset F., GENEPOP version 3.1b. Population genetics soft-
ware for exact tests and ecumenicism, J. Hered. 86 (1995) 248–249.
[21] Reynolds J., Weir B.S., Cokerham C.C., Estimation of the coancestry coeffi-
cient: basis for a short-term genetic distance, Genetics 105 (1983) 767–779.
[22] Robertson A., Hill W.G., Deviations from Hardy-Weinberg proportions: sam-
pling variances and use in estimation of inbreeding coefficients, Genetics 107 (1984)
703–718.
[23] Rohrer G.A., Alexander L.J., Keele J.W., Smith T.P.L., Beattie C.W., A
microsatellite linkage map of the porcine genome, Genetics 136 (1994) 231-245.
[24] Saitou N., Nei M., The neighbour-joining method: a new method for recon-
structing phylogenetic trees, Mol. Biol. Evol. 4 (1987) 406–425.
[25] Scherf B.D., World Watch List for Domestic Animal Diversity, 2nd edn., FAO,
Rome, 1995.
[26] Simon D.L., Buchenauer D., Genetic Diversity of European Livestock Breeds,
EAAP publication n
◦
66, Wageningen Pers, Wageningen, 1993.
[27] Sneath P.H.A., Sokal R.R., Numerical Taxonomy, WH Freeman, San Fran-
cisco, 1973.
[28] Thaon d’Arnoldi C., Foulley J.L., Ollivier L., An overview of the Weitzman
approach to diversity, Genet. Sel. Evol. 30 (1998) 149–161.
[29] van Zeveren A., Peelman L., van de Weghe A., Bouquet Y., A genetic study
of four Belgian pig populations by means of seven microsatellite loci, J. Anim. Breed.
Genet. 112 (1995) 191–204.
[30] Weir B.S., Cockerham C.C., Estimating F-statistics for the analysis of pop-
ulation structure, Evolution 38 (1984) 1358–1370.
[31] Weitzman M.L., On diversity, Quart. J. Econ. 107 (1992) 363–405.
[32] Weitzman M.L., What to preserve ? An application of diversity theory to
crane conservation, Quart. J. Econ. 108 (1993) 157–183.