Báo cáo khoa hoc:" The distribution of the effects of genes affecting quantitative traits in livestock" docx
Bạn đang xem bản rút gọn của tài liệu. Xem và tải ngay bản đầy đủ của tài liệu tại đây (310.55 KB, 21 trang )
Genet. Sel. Evol. 33 (2001) 209–229 209
© INRA, EDP Sciences, 2001
Original article
The distribution of the effects of genes
affecting quantitative traits in livestock
Ben H
AYES
a, ∗
, Mike E. G
ODDARD
a, b
a
Institute of Land and Food Resources, University of Melbourne, Parkville,
Victoria, 3052, Australia
b
Department of Natural Resources and Environment,
Victorian Institute of Animal Science,
Attwood, Victoria, 3049, Australia
(Received 24 January 2000; accepted 2 January 2001)
Abstract – Meta-analysis of information from quantitative trait loci (QTL) mapping experi-
ments was used to derive distributions of the effects of genes affecting quantitative traits. The
two limitations of such information, that QTL effects as reported include experimental error,
and that mapping experiments can only detect QTL above a certain size, were accounted for.
Data from pig and dairy mapping experiments were used. Gamma distributions of QTL effects
were fitted with maximum likelihood. The derived distributions were moderately leptokurtic,
consistent with many genes of small effect and few of large effect. Seventeen percent and 35%
of the leading QTL explained 90% of the genetic variance for the dairy and pig distributions
respectively. The number of segregating genes affecting a quantitative trait in dairy populations
was predicted assuming genes affecting a quantitative trait were neutral with respect to fitness.
Between 50 and 100 genes were predicted, depending on the effective population size assumed.
As data for the analysis included no QTL of small effect, the ability to estimate the number
of QTL of small effect must inevitably be weak. It may be that there are more QTL of small
effect than predicted by our gamma distributions. Nevertheless, the distributions have important
implications for QTL mapping experiments and Marker Assisted Selection (MAS). Powerful
mapping experiments, able to detect QTL of 0.1σ
p
, will be required to detect enough QTL to
explain 90% the genetic variance for a quantitative trait.
distribution of gene effects / quantitative trait loci / genetic variance / marker assisted
selection
1. INTRODUCTION
Traits of economic and ecological importance in livestock species are fre-
quently quantitative. Both genetic and environmental variations contribute
to the variation observed in quantitative traits in livestock populations. The
∗
Correspondence and reprints
E-mail:
210 B. Hayes, M.E. Goddard
genetic component of variation has been widely modelled assuming a large
number of genes of small effect, termed the infinitesimal model. The infinites-
imal model is attractive as it facilitates simple and elegant statistical descriptions
of inheritance, such as predictable changes in genetic variance as a result of
selection [5]. The discovery of a small number of genes of very large effect,
such as the effect of the Hal gene on meat quality in pigs [17], led to a mixed
model of inheritance of quantitative traits with many genes of small effect and
rare genes of very large effect.
Recently, quantitative trait loci (QTL) of moderate effect have been found
to be segregating even in selected populations [2, 9]. We define a QTL as any
gene having an effect of any measurable size on the quantitative trait. Detection
of these QTL indicates the basic assumption of the infinitesimal model is
flawed. Neither do the findings agree with the mixed model, which generally
only accommodates single genes of very large effect. Then for a deeper
understanding of the genetics of quantitative traits, information regarding the
distribution of effects of QTL affecting quantitative traits is needed.
One source of information is from QTL mapping experiments. The aim
of these experiments is to detect genes which contribute to quantitative trait
variation, and determine their position on the chromosome. The livestock
species with the most reported mapping information at present are pigs and
dairy cattle. Results of four QTL mapping experiments with markers bracket-
ing a large proportion of the porcine genome have been reported [2,3, 15,22,
23]. Results of three QTL mapping experiments in dairy cattle with markers
bracketing a large proportion of the bovine genome have been reported [4,9,
29]. At present, mapping experiments are not powerful enough to detect all
the QTL that cause variation in quantitative traits, and QTL effects are only
reported above a size determined by the experimental significance level. A
second major limitation of using reported QTL effects to derive distributions
of the effects of genes on quantitative traits is that effects reported are observed
with experimental error.
In this paper we aim to derive distributions of QTL effects in pigs and
dairy cattle using meta-analysis of published estimates of QTL effects. A
QTL effect is defined as the effect of substituting the decreasing allele for
the increasing allele. Dominance effects of the QTL are not considered for
simplicity. The two major limitations of published estimates, that effects are
observed with error, and only effects above a certain size for each experiment
are reported, were accounted for. QTL effects were assumed to follow a gamma
distribution. Gamma distributions are extremely flexible, and with only two
parameters can describe any shape from equal gene effects to highly leptokurtic
distributions [12]. As the total number of QTL detected in livestock species to
date is limited, data from QTL experiments were accumulated across traits. The
distributions of QTL effects derived are therefore for an “average” quantitative
Distribution of QTL effects 211
trait. Consequences of the distributions for QTL mapping experiments and
Marker Assisted Selection (MAS) are explored.
2. METHODS
2.1. Criteria for inclusion of data
The literature was searched for results of QTL mapping experiments with
markers covering a large proportion of the autosomal genome in pigs and dairy
cattle. Data were the published estimates of QTL effects, and the standard
errors of the effects. Within an experiment, data were included if the authors
reported the QTL effect as significant, at the most stringent significance level
used in that experiment. If no standard errors were presented but P values were
available, approximate standard errors were calculated from P values using the
t distribution. If LOD scores were presented, these were converted to P values
using a χ
2
1
distribution, and then to standard errors using the t distribution.
We assumed significant QTL reported in different experiments were different
QTL, even if QTL mapped to approximately the same region. We made this
assumption because at present mapping experiments are not precise enough to
determine if QTL reported in different experiments map to exactly the same
position on the genome.
2.2. Pig data set
Pig data were from crossbreeding experiments between divergent breeds.
Three experiments generated F
2
progeny [2,3,15], and one experiment gen-
erated backcross progeny [22,23]. The authors analysed their data assuming
these breeds were fixed for alternate alleles at the QTL. The data extracted for
this analysis were the additive effect of the QTL (half the difference between
the two homozygotes) for significant QTL. Traits for which QTL were reported
included growth, carcase and meat quality. The study of Andersson et al. [2]
reported QTL effects as significant using a chromosome-wide significance
level, whereas the other studies used a genome-wide significance level. Across
all pig experiments, 32 significant additive QTL were reported.
2.3. Dairy data set
The three dairy experiments used a granddaughter design for QTL detec-
tion, with effects reported within grandsire families [28]. Data were gene
substitution effects, the difference between the average effects of the two QTL
alleles from the grandsire [8]. Gene substitution effects may include both
additive and dominance effects. However in the within family designs used,
additive and dominance effects could not be separated. When QTL effects
212 B. Hayes, M.E. Goddard
were reported in daughter yield deviations (DYD), the effects were doubled to
give the phenotypic effect. Traits for which QTL were reported were protein
and fat percentage (P%, F%), and protein, fat and milk yields (PY, FY, MY).
Across all dairy experiments, 50 significant QTL effects were reported.
Effects for the % traits reported by Georges et al. [9] were an order of 10
larger than effects for % traits reported in other studies, perhaps because they
were actually in units of g · L
−1
. The phenotypic standard deviation for the %
traits in Georges et al. [9] (derived from standard deviation of daughter yield
deviations) was an order 10 larger than phenotypic standard deviations reported
in other experiments. As a result, after QTL effects were scaled by phenotypic
standard deviations, effects for % traits in Georges et al. [9] were comparable
with those elsewhere.
The QTL effect for MY reported by Zhang et al. [29] was an order of two
larger than effects reported elsewhere. The phenotypic standard deviation for
MY in Zhang et al. [29] was also large. After scaling, the QTL MY effect
reported by Zhang et al. [29] was similar in magnitude to those reported else-
where. The study of Zhang et al. [29] was unusual in that if QTL effects were
detected in a number of families, only the largest and the mean (across families)
QTL effects were reported. Only the largest QTL effects were reported with
standard errors. As the standard errors of the QTL effects are required in our
methods for deriving the distribution of QTL effects (see below), only these
largest QTL effects were used. Some data are included in both the studies
of Zhang et al. [29] and Georges et al. [9], but the published results were
sufficiently different that data from both studies were included in the analysis.
The study of Ashwell et al. [4] used a substantially lower threshold for
significant effects than other experiments.
In order to accumulate effects across traits within pig and dairy experiments,
each effect and standard error were divided by the phenotypic standard deviation
of the trait. If estimates of additive genetic variance, V
A
, and the environmental
variance, V
E
, were reported with variance due to fixed effects removed, the
phenotypic standard deviation used was
√
V
A
+ V
E
. If V
A
and V
E
were not
reported, the standard deviation of raw phenotypic records was used. For some
of the dairy experiments, there was no information on phenotypic standard
deviations for the traits, so literature estimates were used [18].
2.4. Maximum likelihood estimation of distribution of QTL effects
It was assumed that the true underlying QTL effects follow a gamma
distribution, with scaling parameter α and shape parameter β, g(x) =
α
β
x
β−1
e
−αx
/Γ
(
β
)
. The first and second moments of the gamma distribution
are E
(
a
)
= β/α and E
a
2
= β
(
β + 1
)
/
α
2
. The kurtosis
γ
2
of the
distribution was calculated as γ
2
=
(
β + 2
) (
β + 3
)
/
β
(
β + 1
)
. For example,
Distribution of QTL effects 213
β → ∞ is the limiting case for all effects being equal, in which case γ
2
= 1.
Conversely, as β → 0, γ
2
→ ∞, and the distribution becomes increasingly
leptokurtic [12], and skewed to the right with many effects close to zero.
The estimated effect of the QTL, reported in the literature, was assumed to
follow a normal distribution. The mean of the normal distribution was the true
QTL effect, and the standard deviation was the estimation error for the QTL.
Let n
x
i, j
|
x
be the ordinate of the normal distribution for x
i, j
, the jth observed
effect from the ith experiment, given the true QTL effect is x. Then
n
x
i, j
|
x
=
1
√
2πσ
i
e
−
(
x
i, j
−x
)
2
2σ
2
i
where the average standard error for experiment i is σ
i
. All variables are
expressed in units of phenotypic standard deviations.
We define the QTL effect as the effect of substituting the decreasing allele
with the increasing allele, so all substitution effects were positive. It is possible
that the observed QTL effect and true QTL effect have opposite signs (i.e. a
negative QTL effect is observed when the true QTL effect is positive). The
experimenter has no way of knowing that this has occurred. Therefore the value
of the normal distribution when observed effects were given the opposite sign
to the true QTL effect, n
−x
i, j
|
x
was included to complete the distribution.
A density function for x
i, j
can be written as
f
x
i, j
=
∞
0
n
x
i, j
|
x
g(x)dx +
∞
0
n
−x
i, j
|
x
g(x)dx.
We also took into account the fact that QTL are only observed above a trunca-
tion point determined by the significance threshold for each experiment. The
truncation point, c
i
, was taken as the value of the smallest of the significant
observed effects in each experiment. Then the probability that x
i, j
is observed
when the true QTL effect is gamma distributed with parameters α and β is,
P
x
i, j
|
α, β
=
f
x
i, j
∞
c
i
f
ˆx
d ˆx
·
The log likelihood for all x
i, j
in t experiments, with m
i
significant QTL effects
in experiment i, is
t
i=1
m
i
j=1
ln P
x
i, j
|
α, β
.
Numerical integration was used to integrate the distributions where required.
A grid search was used to find the maximum likelihood (ML) estimates of α
and β given the data.
214 B. Hayes, M.E. Goddard
Support limits for parameters α, β, E
(
a
)
and E
a
2
were obtained by linear
interpolation from differences in log likelihood from the maximum over the
profile. The fitted parameter value corresponding to a change in log likelihood
of 2 was taken as the support limit, which is asymptotically equivalent to a 95%
confidence limit [12]. Kurtosis was calculated from the maximum likelihood
estimate of β.
2.5. Number of heterozygous QTL per sire
In this section we attempt to calculate the total number of heterozygous QTL
per sire. Only heterozygous QTL can be detected in mapping experiments. We
assume that the number of observed QTL above the significance threshold is
equal to the number of true QTL above the significance threshold. We realise
this is unlikely to be the case, as some of the observed QTL could be false
positives. The error introduced by this assumption is reduced somewhat by
using only QTL reported as significant at stringent significance thresholds.
The number of QTL per trait per sire observed in an experiment was n
i
for
experiment i. The QTL above size c
i
are a proportion of the total QTL. This
proportion can be calculated as p
i
=
∞
c
i
f
ˆx
d ˆx. Therefore the total number
of heterozygous QTL per trait per sire or F
1
boar is
N
i
=
n
i
p
i
·
The number of heterozygous QTL per trait per sire or F
1
boar was calcu-
lated from each of the pig and dairy experiments. The average number of
heterozygous QTL per sire for each of the species was calculated, as
¯
N =
t
i=1
n
i
t
i=1
p
i
·
The value of n
i
was adjusted before calculating
¯
N for (i) the proportion of the
genome bracketed by markers, and (ii) in dairy data only, for the probability that
a grandsire is heterozygous for a marker bracket surrounding a QTL. Sections
of the genome were assumed to be bracketed by markers if there was less than
50 cM between adjacent markers. Assumptions regarding the number of QTL
per marker bracket depend on the assumptions made by authors of the papers
used in the meta-analysis, but generally a maximum of one QTL per bracket
per experiment was assumed. Pitfalls of this assumption are considered in the
discussion.
Distribution of QTL effects 215
For dairy, we only predicted the number of heterozygous QTL for Georges
et al. [9] and Zhang et al. [29]. Ashwell et al. [4] only used 16 markers in their
study, and the proportion of the genome bracketed by these markers could not
be reliably predicted. Georges et al. [9] estimated their marker map covered
66% of the genome. If n
i
= 0.5 with 66% of the genome bracketed by markers,
n
i
= 0.76 would be expected if 100% of the genome were bracketed. Zhang
et al. [29] used markers which bracketed almost the entire autosomal genome
so no adjustment to n
i
was necessary (their estimate).
In the mapping experiments used to provide data for our meta-analysis, the
heterozygosity of markers was not 100%. Therefore some sires may have
been homozygous for marker brackets containing heterozygous QTL. If a
sire is homozygous for a marker, it is not possible to detect a heterozygous
QTL linked to that marker. As an approximation, we have assumed that the
proportion of sires that are detected as heterozygous at the QTL is proportional
to the average heterozygosity of the markers, and adjusted n
i
accordingly. The
average heterozygosity of markers used in the experiments of Georges et al. [9]
and Zhang et al. [29] were 45.8% and 46.1% respectively. The numbers of
heterozygous QTL/sire/trait detected in these experiments were 0.14 and 0.36
for Georges et al. [9] and Zhang et al. [29] respectively. Given our assumption,
if the markers in each of these experiments were 100% heterozygous, 0.31 and
0.78 QTL/sire/trait would have been detected.
As the pig experiments used an across family analysis, QTL were reported
per trait rather than per trait per sire. Therefore no adjustment to n
i
for the
average heterozygosity of markers in sires was used.
2.6. Within sire segregation variance
The within sire segregation variance explained by the distribution of QTL
effects is derived as follows. For each experiment, the variance caused by the
segregation of N
i
genes within the gametes from one sire is N
i
1
4
E
a
2
.
For dairy experiments, the amount of within sire segregation variance which
the distribution of QTL effects explains can be compared to the within sire
segregation variance. The within sire variance can be calculated from typical
heritability estimates, as 1/4h
2
. In pig experiments, N
i
1
4
E
a
2
is equivalent to
the F
1
segregation variance.
2.7. Total number of QTL segregating in the population
In outbred populations, one individual will only be heterozygous for fraction
(2K) of the total number of genes segregating. Given the number of QTL found
heterozygous in each sire (N
i
), the total number of segregating loci (M) will
be given by M = N/2K. An estimate of M is therefore M =
¯
N/2K. We
can calculate 2K by making some assumptions about the distribution of gene
216 B. Hayes, M.E. Goddard
frequencies. We assume the distribution of gene frequencies is for a population
previously without selection for the quantitative trait, and with all genes neutral
with respect to fitness. We recognise that these assumptions are not correct,
particularly if the population has undergone some artificial selection, in which
case QTL with large effects are likely to be at extreme frequencies. In this
case we are likely to underestimate 2K, the proportion of heterozygous QTL.
However, the assumptions allow us to provide a rough estimate of the number
of genes explaining the variance in quantitative traits. Given our assumptions,
distribution of gene frequencies will reflect the generation of new alleles by
mutation and their loss by drift. The gene frequency probability density from
this assumption is f ( p) = K/
p(1 − p)
, where K is a constant and p is the
frequency of one allele [14]. This calculates the gene frequency distribution
accurately if the product of the mutation rate per locus and effective population
size is small. This is likely to be the case in most livestock populations. The
relevant part of the gene frequency distribution is from π p 1 − π, where
π = 1/(2N
e
). The value of π is the lowest possible gene frequency in a
population of effective size N
e
. We have used effective population size as an
approximation. In fact all parents in the population are targets for mutation.
In modern livestock populations however, mutations may only be exploited if
they occur in elite breeding animals (e.g. AI sires in the dairy industry), as it
is these animals which provide genetic material for the improvement of the
population. The size of the elite population is likely to be nearer the effective
population size than the census population size.
The constant, K, is chosen so that
1−π
π
K/
p(1 − p)
dp = 1.
Integrating this function and solving for K gives the result,
K =
1
2 ln
1 − π
π
·
The mean heterozygosity of QTL is
1−π
π
2p(1 − p)K/
p(1 − p)
dp
which can be approximated as 2K, or
1
ln
1 − π
π
·
Distribution of QTL effects 217
0
2
4
6
8
10
12
14
16
18
0 0.1 0.2 0.3 0.4 0.5 0.6 0.7 0.8 0.9 1 1.1 1.2
Effect (phenotypic standard deviations)
Frequency
Pigs
Dairy
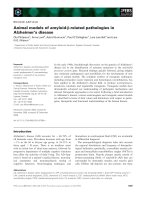
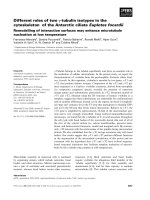
Figure 1. Distribution of additive (QTL) effects from pig experiments, scaled by the
standard deviation of the relevant trait, and distribution of gene substitution (QTL)
effects from dairy experiments scaled by the standard deviation of the relevant trait.
This is the mean heterozygosity among the loci that are segregating and depends
only on the effective population size. The total number of QTL segregating in
the population was calculated with effective population sizes of 50, 500 and
5000 (π = 0.01, π = 0.001 and π = 0.0001 respectively). The number of
QTL was only calculated from the dairy data. The pig resource populations
used in the mapping experiments were not suitable for calculating the total
number of QTL segregating in the population, as the number of segregating
QTL calculated from wide crosses would be unlikely to be representative of
commercial pig populations.
3. RESULTS
3.1. Distribution of QTL effects
The frequency distribution of apparent QTL effects from pig experiments
and dairy distributions accumulated over traits and scaled by the phenotypic
standard deviation of each trait is shown in Figure 1.
The pig distribution indicates a greater number of QTL of moderate size (e.g.
between 0.3σ
p
and 0.5σ
p
) have been detected than large QTL (e.g. > 0.5σ
p
).
The raw average QTL effect was 0.42σ
p
± 0.02σ
p
.
For the dairy frequency distribution, a greater number of QTL of moderate
to small size have been detected than large QTL. The number of relatively
218 B. Hayes, M.E. Goddard
Table I. Maximum likelihood estimates for gamma distributions of QTL effects.
Parameter (Support limits) Pig Dairy
α 11.2 (7.8–15.6) 5.4 (3.6–7.8)
β 1.48 (0.30–3.02) 0.42 (0.18–0.78)
E(a) 0.1321 (0.0736–0.2262) 0.0778 (0.0409–0.1357)
E(a
2
) 0.0293 (0.0105–0.0721) 0.0205 (00787–0.0507)
γ
2
4.25 13.88
small QTL (e.g. < 0.3σ
p
) was larger in the dairy data set than the pig data set.
Dairy experiments generally have more power to detect small QTL than the
pig experiments. The raw average QTL effect for dairy data was lower than
for the pig data, 0.32σ
p
± 0.03σ
p
.
Support limits were large for the ML estimates of parameters of scale (α)
and shape (β) for the gamma distribution for pig and dairy effects, Table I. The
large support limits reflect the small size of pig and dairy data sets.
We used a likelihood ratio test to determine if the pig and dairy distributions
were significantly different. The gamma distribution was fitted to a data set
containing both pig and dairy data. ML parameters for this pooled data set were
scale (α) = 7.1 and shape (β) = 0.59. The likelihood ratio was calculated as
−2
∗
the natural logarithm of the ratio of the sum of the maximum likelihood’s
of the pig and dairy data analysed separately to the maximum likelihood of the
pooled data set. The likelihood ratio was compared to a chi-squared statistic
with one degree of freedom at the 0.05 significance level. The distributions
were not significantly different. However, the small size of the data sets means
that the distributions would have to be very different before the likelihood ratio
test was significant.
The first moment of the distribution is the mean QTL effect. The mean QTL
effect from the pig and dairy gamma distributions were much smaller than the
raw mean of the QTL data.
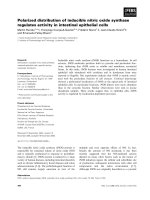
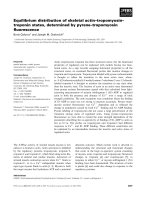
Both distributions were moderately leptokurtic, and implied many QTL of
small effect, and few of large effect, Figure 2.
Figure 2B suggests a greater density of QTL above 1σ
p
for dairy than for
pigs. This is agreement with the frequency distributions for pig and dairy QTL
effects scaled by phenotypic standard deviations (Fig. 1).
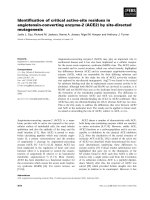
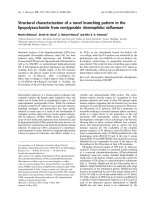
The variance contributed by the QTL of effect greater than a specified
truncation point was determined. To do this we assumed that large QTL
and small QTL will have similar frequency distributions. Figure 3A plots
∞
c
x
2
g(x)dx against c, where c is a specified truncation point. As QTL effects
are observed with error, the apparent variance explained by observed QTL may
be different to actual genetic variance explained by true QTL. The apparent
Distribution of QTL effects 219
0
1
2
3
4
5
6
0.05 0.25 0.4 5 0.6 5 0.8 5 1 .05 1.25 1.45
E ffe ct (p he notyp ic stan da rd d eviatio ns )
Density
P ig s
D a iry
0
0.0 01
0.0 02
0.0 03
0.0 04
0.0 05
1 1 .1 1 .2 1.3 1 .4 1.5
E ffe ct (phe notyp ic sta nd ard d ev ia tions)
Density
P ig s
D a iry
Figure 2. Distributions of QTL effect from pig and dairy experiments (A), and
magnification of distribution from effect = 1 to 1.5σ
p
(B).
variance explained by observed QTL above a truncation point can be determined
by plotting
∞
c
ˆx
2
f ( ˆx)d ˆx against c, Figure 3B.
Figure 3A suggests QTL > 0.1σ
p
contribute approximately 90% of the
variance for both species. The figure also suggests for dairy, the segregation
of large QTL (> 1σ
p
) explains about 5% of the total variance. For pigs, the
proportion of the variance explained by the segregation of large QTL is very
small. This is because our distributions predict the occurrence of large QTL is
very rare for pigs.
220 B. Hayes, M.E. Goddard
0
20
40
60
80
100
120
140
160
0 0.1 0.2 0.3 0.4 0.5 0.6 0.7 0.8 0.9 1
S ize of Q TL (ph enotypic standard deviations)
Proportion of variance explained by
QTL above this size
P ig
D airy
0
20
40
60
80
100
120
140
160
0 0.1 0.2 0.3 0.4 0.5 0.6 0.7 0.8 0.9 1
S iz e of Q T L (p heno typ ic stand ard de viation s)
Proportion of apparent variance
explained by QTL above this size
Pig
D airy
Figure 3. Variance contributed by the QTL above a specified size, (A) estimated
proportion of variance when size of QTL is size of the true QTL effect, and (B) variance
which would be observed when size of QTL effect is size of the observed effect.
Figure 3B indicates the apparent variance explained by observed QTL will
be greater than the true variance explained. The apparent variance explained is
greater than the true variance explained because QTL effects are overestimated
in mapping experiments [9]. For example the true variance explained by QTL
greater than 0.35σ
p
for dairy is 55%, while the apparent variance explained by
QTL greater than 0.35σ
p
is 70%.
Distribution of QTL effects 221
3.2. Number of heterozygous QTL per sire
The estimated number of heterozygous QTL per sire per trait was approx-
imately 10 for both pig and dairy distributions, Table II.
For dairy, the results are consistent between studies. For pigs, the num-
ber of segregating QTL per trait are approximately similar for Roher and
Keele [22,23], Andersson et al. [2] and Knott et al. [15]. The numbers of
segregating QTL predicted from Andersson-Eklund et al. [3] is much lower.
Andersson-Eklund et al. [3] included many more meat quality traits in their
experiment than the other experiments. Meat quality traits typically have a
low heritability [24]. This could indicate a problem with pooling results over
different traits.
The average number of QTL heterozygous in F
1
boars was similar to the
average number of QTL heterozygous in dairy sires. At first sight this is
surprising since the F
1
boar is a wide cross and the dairy sires are largely pure
Holstein. However the pig experiments were analysed assuming that alternate
alleles were fixed in the parent pig breeds so that all F
1
s were heterozygous and
identical. This is probably an unrealistic assumption, with the consequence
that the mapping experiments may fail to detect QTL which are heterozygous
in some F
1
boars but not in others.
3.3. Within sire segregation variance
The within sire segregation variance estimated for dairy cattle was 0.055.
The average number of heterozygous QTL/sire/trait from Table II was used
to make this prediction. Thus the distribution represents a generic trait with
heritability of 0.22. For comparison, if heritabilities from literature are averaged
over the five dairy production traits (using h
2
for percentage traits as 0.5 and
h
2
for yield traits as 0.2) 1/4h
2
is 0.080 [18]. Hence the predicted value of
within sire segregation variance underestimates the average of estimates from
the literature by about 30%.
Using the number of genes in Table II for each pig experiment, the F
1
segregation variances were calculated as 0.056 [22,23], 0.124 [2], 0.108 [15]
and 0.035 [3]. The differences between studies can be explained by the different
traits which were included in the mapping experiments. Both Andersson
et al. [2] and Knott et al. [15] examined growth and carcass traits, which have
moderate to high heritability. Andersson-Eklund et al. [3] examined a large
number of carcass and meat quality traits, with moderate to low heritability. The
F
1
segregation variance for these traits could be expected to be lower than the F
1
segregation variance for the traits examined by Andersson et al. [2] and Knott
et al. [15]. Roher and Keele [22,23] examined fat deposition and muscling and
wholesale product yield traits, which have moderate to high heritability.
222 B. Hayes, M.E. Goddard
Table II. Reported and predicted total heterozygous QTL per sire per trait.
Experiment Reported Predicted
heterozygous heterozygous
QTL/sire/trait QTL/sire/trait
Dairy
Reported Proportion Marker Adjusted
of genome heterozygosity QTL/sire/trait
bracketed by markers %
Georges et al. [9] 0.14 0.66 46 0.47 8.96
Zhang et al. [29] 0.36 1 46 0.77 12.18
Average 0.25 0.62 10.73
Pigs
Reported Proportion Adjusted
of genome QTL/sire/trait
Roher and Keele [22,23] 0.917 1 0.917 7.70
Andersson et al. [2] 0.714 0.75 0.952 16.87
Knott et al. [15] 0.857 1 0.857 14.73
Andersson-Eklund et al. [3] 0.375 1 0.375 4.78
Average 0.716 0.716 9.94
Distribution of QTL effects 223
3.4. Total number of segregating QTL in the population
The number of segregating QTL was predicted to be 49, 74 and 99 for
effective population sizes of 50, 500 and 5000 respectively. It is difficult to say
which estimate is the most likely. The world’s dairy population is increasingly
dominated by the Holstein breed. In addition, widespread use of Artificial
Insemination (A.I.) has reduced the number of bulls used to breed dairy sires
worldwide. As a result, the effective population size of the world’s dairy herd is
relatively low [10], but this is a recent phenomenon and the effective population
size was probably larger in the past.
3.5. Expected true QTL effects given observed effects
The distribution of effects of QTL on quantitative traits can be immediately
applied to correct bias in the QTL effects reported in literature. Bias in reported
effects arises because QTL effects are only reported above a size determined by
the experimental significance level, and effects are observed with experimental
error, and so effects that reach the significance threshold and are reported are
likely to be overestimated [9, 29].
The expected true QTL effect, given an observed QTL effect, is,
E
x|ˆx
=
∞
0
xf
x|ˆx
dx
which can be calculated as,
∞
0
xn
ˆx|x
g(x)dx
∞
0
n
ˆx|x
g(x)dx
·
However, this does not take account of the large number of chromosome
segments with no heterozygous QTL. In a typical mapping experiment, 100
chromosome segments may be tested for the presence of QTL. We have estim-
ated that approximately 10 heterozygous QTL are segregating per sire. Hence
90% of the chromosome segments do not contain QTL, and therefore have
a true effect of zero. An effect can still be observed for these chromosome
segments due to experimental error. The expected true QTL effect, given an
observed QTL effect, is then,
E
x|ˆx
=
0.1
∞
0
xn
ˆx|x
g(x)dx
0.1
∞
0
n
ˆx|x
g(x)dx + 0.9n
ˆx|0
·
224 B. Hayes, M.E. Goddard
0
0.1
0.2
0.3
0.4
0.5
0.6
0.7
0.8
0.9
1
1.1
1.2
1.3
1.4
1.5
0 0.1 0.2 0.3 0.4 0.5 0.6 0.7 0.8 0.9 1 1.1 1.2 1.3 1.4 1.5
Observed effect (phenotypic standard deviations)
Expected true effect given observed
effect (phenotypic standard deviations)
Dairy Std. Error = 0.1
Dairy Std. Error = 0.25
Pigs Std. Error = 0.1
Pigs Std. Error = 0.25
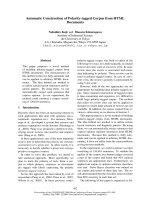
Figure 4. Expected true QTL effect given an observed QTL effect with standard errors
0.1σ
p
and 0.25σ
p
.
Where n
ˆx|0
is the ordinate of the normal distribution at ˆx with mean zero
and standard deviation the standard error of the experiment.
The value of E
x|ˆx
can then be plotted against the observed QTL effects
for the pig and dairy distributions, given specified standard errors (Fig. 4).
Even with an experimental standard error of 0.1σ
p
, the figure indicates
observed QTL of small to moderate effect (e.g. 0.1σ
p
to 0.3σ
p
) will be serious
overestimates of the true QTL effect. Observed QTLs of this size have a high
probability of being chromosome segments which in fact contain no QTL, with
the observed effect purely due to experimental error.
Figure 4 indicates observed QTL of moderate effect (e.g. 0.4σ
p
) will also be
serious overestimates, by 22% and 25% for dairy and pigs respectively, when
the standard error is 0.1σ
p
. Large observed QTL (e.g. 1σ
p
) are overestimates
of the true QTL effect by approximately 5–10%, if the standard error is 0.1σ
p
.
However if the standard error is large (0.25σ
p
), as was the case with most
observed QTL of effect > 1σ
p
, the overestimation of the size of the QTL is
more serious, at 55% for dairy and 70% for pigs.
4. DISCUSSION
The limitations of the data on which this meta-analysis is based must be
acknowledged. The limited number of significant QTL reported in the literature
(32 for pigs and 50 for dairy) meant support limits for parameters of distribu-
tions of QTL effects were large. Data quality was compromised by failure of
Distribution of QTL effects 225
some studies to report phenotypic variances and other necessary information
for the resource population. In these cases the phenotypic standard deviation
was taken from other sources, and were therefore only approximations. Despite
this, internal consistency of the data was high. The magnitude of QTL effects
scaled by phenotypic standard deviations generally in good agreement for traits
across studies.
Since the data for the analysis included no QTL of small effect, the ability
to estimate the number of QTL of small effect must inevitably be weak. The
within sire segregation variance explained by the distribution estimated for
dairy traits appears to under estimate the true within-sire segregation variance.
It may be that there are more QTL of small effect than predicted by our gamma
distributions. In addition, the numbers of QTL segregating are predicted from
our distribution with low accuracy, given the large support limits for parameters
of the distributions. An example illustrates how the number of genes changes
from the support limits to the ML estimates for the distribution. Assume 0.62
QTL/sire/trait are detected in an experiment with a truncation point of 0.35σ
p
,
with an average standard error of 0.11σ
p
(similar to the average values for
the dairy experiments). Then using the ML estimates for α and β from the
dairy distribution, 11.8 heterozygous QTL per sire are predicted. Using the
distributions at either extreme of the joint (for α and β) 95% confidence interval
from the ML surface gives an interval of 21 heterozygous QTL per sire to 6
heterozygous QTL per sire.
For pigs, the F
1
segregation variance estimated from the gamma distribution
of gene effects appears to be less than half the heritability that might be expected
in an F
2
. This may be for the reasons discussed in the previous paragraph, but
could also be because only QTL with alternative alleles fixed in the parent
breeds are being detected.
The difference in the shape of the distributions estimated from the pig and
dairy data could be due to sampling errors. However differences could also be
due to the designs of the experiments. The pig experiments sought QTL which
had different alleles fixed in each parent breed. If the differences between
breeds were partly due to selection, then one would expect fixation of alleles
to occur more often for alleles of medium to large effect than small effects.
The QTL effects reported in the literature are actually for chromosome
segments, rather than individual genes. Our distributions could therefore
be more correctly termed distributions of effects of chromosome segments
in livestock species, rather than distributions of the effects of genes. Our
predictions of the number of segregating QTL are actually predictions of the
number of segregating chromosome segments with an effect on the quantitative
trait in a population. If there are two or more segregating genes within a
chromosome segment bracketed by markers, our methods will underestimate
the number of QTL segregating.
226 B. Hayes, M.E. Goddard
While distributions for QTL effects in livestock species have not previously
been reported, it is useful to compare our results to those from laboratory
species and from theoretical models of variation in quantitative traits. There is
increasing evidence in laboratory species for leptokurtic distributions of gene
effects. Shrimpton and Robertson [25] isolated chromosome segments, or
polygenic factors, which controlled bristle score in Drosophila melanogaster.
Although their experiment could not ascertain factors less than 0.6 phenotypic
standard deviations in size, they concluded their observations supported the
hypothesis that quantitative characters are controlled by a few major effects
supported by a host of smaller effects of diminishing influence on the character.
This agrees with the shape of our distributions. The shape of our distributions is
also similar to, but somewhat less leptokurtic than, those observed for mutation
effects in laboratory species [12, 19,20].
There are no estimates in the literature of the number of heterozygous
loci affecting a quantitative trait segregating in pig and dairy populations to
compare to our results. We can however, compare our values to literature
estimates for the number of genes controlling quantitative characters in other
species. Lande [16] used the Wright index [6] to estimate the minimum
number of loci controlling fruit weight in tomato, percent oil in maize kernels,
fish eye diameter, and date of anthesis in Goldenrod. The average number of
effective loci over all traits and species was approximately 10, with a range of
5 to 22. However, Wright’s estimate assumes all allelic effects are equal. This
is unlikely given the shape of our distributions for genes affecting quantitative
traits. We can adjust Wrights Index to accommodate unequal allelic effects that
follow the distributions predicted in this study. After making this adjustment,
the average number of loci over all traits and species in Lande [16] would
be 30. This value is less than, but close to, the number of QTL we predict are
segregating in dairy populations (if the effective population size is small). It
is important to note that we have not predicted the total number of genes in
the genome with an effect on a quantitative trait, but only the number of genes
which are segregating in the population. The total number of genes which
affect a trait will be many times larger.
Our distributions of effects of QTL on quantitative traits can be compared
to distributions which have emerged from theoretical models of variation in
quantitative traits. Wahlroos et al. [26] simulated populations with finite
numbers of loci over many generations of mutation – natural selection –
drift followed by a few generations of artificial selection. The variance in
these populations after artificial selection was largely generated by a small
proportion of QTL of intermediate effect (0.2σ
p
< a < 0.6σ
p
). This agrees
with our results, e.g. Figure 3.
The distribution of effects of QTL on a quantitative trait has utility for plan-
ning QTL mapping experiments. The aim of mapping experiments is to detect
Distribution of QTL effects 227
QTL which contribute to genetic variance. Most QTL detection experiments
performed to date have had a significance threshold of approximately 0.35σ
p
or greater (e.g. [9,15, 29]). Even if QTL of this size could be observed without
error in a mapping experiment, Figure 3A indicates all the QTL detected would
only explain 58% of the variance for dairy, and 20% of the variance for pigs.
To detect enough QTL to explain 90% of the variance, experiments would need
to detect QTL as small as 0.1σ
p
. Weller et al. [28] estimate to detect QTL with
effects of this size with a power of 0.73 would require a grandsire design with
20 grandsires, 200 sons per grandsire and 100 granddaughters per son. This
is a considerably larger experiment than the mapping experiments which have
been performed to date [4,9, 29].
Recently, a number of researchers have used finite locus models to estimate
additive variance and breeding values [7,11, 13,21]. The models assume a prior
distribution of gene effects from which effects at individual loci are sampled.
Uniform distributions [7], Normal distributions [7,11, 21], exponential distri-
butions [21] and gamma distributions [13] have been assumed. In all cases,
the parameters of the distributions were chosen arbitrarily. The distribution of
QTL effects proposed here would be a natural candidate for the distribution of
gene effects used in such models.
Quantitative trait loci mapping experiments are at an early stage, and few
significant results have been reported to date. Results from many QTL mapping
experiments will be published in the next few years. We recommend results
from these experiments be included in data sets for the different species, and
distributions of effects of QTL on quantitative traits be periodically re-estimated
as more information becomes available.
A current trend in the human genetic literature is to use meta-analysis of
linkage data across a number of studies (e.g. Allison and Heo [1]). A single such
meta-analysis has been carried out in pigs to estimate the effect and location of
a QTL affecting backfat on chromosome four [27]. Such approaches increase
the power to discriminate between false positive and true QTL. Estimates of
QTL effects from meta-analysis would be valuable data for estimating the
distribution of QTL effects, as estimation errors of the QTL effects should be
lower relative to data from single studies.
ACKNOWLEDGEMENTS
The author’s are grateful for funding from a grant from the Pig Research
and Development Corporation (PRDC), grant number US43, “MARKER
ASSISTED SELECTION FOR PROFITABLE PIGS”, to complete this
research. Two anonymous reviewers are thanked for valuable comments on an
earlier version of the manuscript.
228 B. Hayes, M.E. Goddard
REFERENCES
[1] Allison D.B., Heo M., Meta-analysis of linkage data under worst case conditions:
a demonstration using the human OB region, Genetics 148 (1998) 859–865.
[2] Andersson L., Haley C.S., Ellegren H., Knott S.A., Johansson M. Andersson K.,
Andersson-Eklund L., Edfors-Lilja I., Fredholm M., Hansson I., Hakansson J.,
Lundstron K., Genetic mapping of quantitative trait loci for growth and fatness
in pigs, Science 263 (1994) 1771–1774.
[3] Andersson-Eklund L., Marklund L., Lundstrom K., Haley C.S., Andersson K.,
Hansson I., Moller M., Andersson L., Mapping quantitative loci for carcass and
meat quality traits in a wild boar × large white intercross, J. Anim. Sci. 76 (1998)
694–700.
[4] Ashwell M.S., Rexroad C.E. Jr., Miller R.H., VanRaden P.M., Da Y., Detection
of quantitative trait loci affecting milk production and health traits in an elite
US Holstein population using microsatellite markers, Anim. Genet. 28 (1997)
216–222.
[5] Bulmer M.G., The effect of selection on genetic variability, Am. Nat. 105 (1971)
201–211.
[6] Castle W.E., An improved method of estimating the number of genetic factors
concerned in cases of blended inheritance, Science 54 (1921) 223.
[7] Du F.X., Hoeschele I., Estimation of additive, dominance and epistatic variance
components using finite locus models implemented with a single site Gibbs and
a descent graph sampler, Genet. Res. 76 (2000) 187–198.
[8] Falconer D.S., Introduction to quantitative genetics, 3rd edn., Longman, UK,
1989.
[9] Georges M., Nielson D., Mackinnon M., Mishra A., Okimoto R., Pasquino A.T.,
Sargeant L.S., Sorenson A., Steele M.R., Zhao X., Womack J.E., Hoeschele I.,
Mapping quantitative trait loci controlling milk production in dairy cattle by
exploiting progeny testing, Genetics 139 (1995) 907–920.
[10] Goddard M.E., Optimal effective population size for the global population of
black and white dairy cattle, J. Dairy Sci. 75 (1992) 2902–2911.
[11] Goddard M.E., Gene based models for genetic evaluation – an alternative to
BLUP?, in: Proceedings of the 6th World Congress on Genetics Applied to
Livestock Production, 1998, Vol. 26, Armidale, University of New England,
pp. 33–36.
[12] Keightley P.D., The distribution of mutation effects on viability in Drosophila
melanogaster, Genetics 138 (1994) 1315–1322.
[13] Kerr R.J., Henshall J.M., Tier B., Use of a finite locus model to estimate genetic
parameters is unselected populations, in: Proceedings of the 13th Conf. Assoc.
Advanc. Anim. Br. Genet., 1999, Mandurah, pp. 404–407.
[14] Kimura M., Crow J.F., The number of alleles that can be maintained in a finite
population, Genetics 49 (1964) 725–738.
[15] Knott S.A., Marklund L., Haley C.S., Andersson K., Davies W., Ellegren H.,
Fredholm M., Hansson I., Hoyheim B., Lundstrom K., Moller M., Andersson L.,
Multiple marker mapping of quantitative trait loci in a cross between outbred
wild boar and large white pigs, Genetics 149 (1998) 1069–1080.
Distribution of QTL effects 229
[16] Lande R., The minimum number of genes contributing to quantitative variation
between and within populations, Genetics 99 (1981) 541–553.
[17] Lundstrom K., Karlsson A., Hakansson J., Johansson M., Andersson L.,
Andersson K., Production, carcass and meat quality traits of F
2
-crosses between
European Wild Pigs and domestic pigs including halothane gene carriers, Anim.
Sci. 61 (1995) 325–331.
[18] Misztal I., Lawlor T.J., Short T.H., Van Raden P.M., Multiple-trait estimation of
variance components of yield and type traits using an animal model, J. Dairy Sci.
75 (1992) 544–551.
[19] Mukai T., Chigusa S.I, Mettler L.E., Crow J.F., Mutation rate and dominance
genes affecting viability in Drosophila melanogaster, Genetics 72 (1972) 333–
355.
[20] Oshni O., Spontaneous and ethyl methanesulfante induced mutations controlling
viability in Drosophila melanogaster. Ph. D. Thesis, University of Wisconsin,
1974.
[21] Pong-Wong R., Haley C.S., Woolliams J.A., Behaviour of the additive finite
locus model, Genet. Sel. Evol. 31 (1999) 193–211.
[22] Roher G.A., Keele J.W., Identification of quantitative trait loci affecting carcass
composition in swine. I. Fat deposition traits, J. Anim. Sci. 76 (1998) 2247–2254.
[23] Roher G.A., Keele J.W., Identification of quantitative trait loci affecting carcass
composition in swine. II. Muscling and wholesale product yield traits, J. Anim.
Sci. 76 (1998) 2255–2262.
[24] Rothschild M.F., Ruvinsky A., The genetics of the pig, CAB International,
Wallingford, 1998.
[25] Shrimpton A.E., Robertson A., The isolation of polygenic factors controlling
bristle score in Drosophila melanogaster. II. Distribution of third chromosome
bristle effects within chromosome sections, Genetics 118 (1988) 445–459.
[26] Wahlroos H., Caballero A., Maki-Tanila A., Distribution of QTL in selected
populations under a non-additive pleiotropic model, in: 49th Annual Meeting of
the European Association for Animal Production, 23–27 August 1998, Warsaw,
Poland.
[27] Walling G.A., Visscher P.M., Andersson L., Rothschild M.F., Wang L., Moser G.,
Groenen M.A.M., Bidanel J., Cepica S., Archibald A.L., Geldermann H., de
Koning D.J., Milan D., Haley C.S., Combined analyses of data from quantitative
trait loci mapping studies: chromosome 4 effects on porcine growth and fatness,
Genetics 155 (2000) 1369–1378.
[28] Weller J.L., Kashi Y., Soller M., Power of granddaughter designs for determining
linkage between marker loci and quantitative trait loci in dairy cattle, J. Dairy
Sci. 73 (1990) 2525–2537.
[29] Zhang Q., Boichard D., Hoeschele I., Ernst C., Eggen A., Murkve B., Pfister-
Genskow M., Witte L.A., Grignola F.E., Uimari P., Thaller G., Bishop M.D.,
Mapping quantitative trait loci for milk production and health of dairy cattle in a
large outbred pedigree, Genetics 149 (1998) 1959–1973.