Báo cáo khoa hoc:" Comparison between estimation of breeding values and fixed effects using Bayesian and empirical BLUP estimation under selection on parents and missing " doc
Bạn đang xem bản rút gọn của tài liệu. Xem và tải ngay bản đầy đủ của tài liệu tại đây (413.22 KB, 19 trang )
Genet. Sel. Evol. 34 (2002) 41–59 41
© INRA, EDP Sciences, 2002
DOI: 10.1051/gse:2001003
Original article
Comparison between estimation
of breeding values and fixed effects using
Bayesian and empirical BLUP estimation
under selection on parents and missing
pedigree information
Flávio S. S
CHENKEL
∗
, Lawrence R. S
CHAEFFER
,
Paul J. B
OETTCHER
Centre for Genetic Improvement of Livestock,
Animal and Poultry Science Department, University of Guelph,
Guelph, Ontario, N1G 2W1 Canada
(Received 11 December 2000; accepted 2 July 2001)
Abstract – Bayesian (via Gibbs sampling) and empirical BLUP (EBLUP) estimation of fixed
effects and breeding values were compared by simulation. Combinations of two simulation
models (with or without effect of contemporary group (CG)), three selection schemes (random,
phenotypic and BLUP selection), two levels of heritability (0.20 and 0.50) and two levels of
pedigree information (0% and 15% randomly missing) were considered. Populations consisted
of 450 animals spread over six discrete generations. An infinitesimal additive genetic animal
model was assumed while simulating data. EBLUP and Bayesian estimates of CG effects and
breeding values were, in all situations, essentially the same with respect to Spearman’s rank
correlation between true and estimated values. Bias and mean square error (MSE) of EBLUP
and Bayesian estimates of CG effects and breeding values showed the same pattern over the
range of simulated scenarios. Methods were not biased by phenotypic and BLUP selection
when pedigree information was complete, albeit MSE of estimated breeding values increased
for situations where CG effects were present. Estimation of breeding values by Bayesian and
EBLUP was similarly affected by joint effect of phenotypic or BLUP selection and randomly
missing pedigree information. For both methods, bias and MSE of estimated breeding values
and CG effects substantially increased across generations.
breeding value / selection / Bayesian estimation / empirical BLUP / Gibbs sampling
∗
Correspondence and reprints
E-mail:
42 F.S. Schenkel et al.
1. INTRODUCTION
Wang et al. [22] stated that one deficiency in the practical application of best
linear unbiased estimation (BLUE) and best linear unbiased prediction (BLUP)
is that errors of estimation of dispersion parameters are not taken into account
when predicting breeding values. A two-stage estimation procedure (empirical
BLUE/BLUP [5, 8] (EBLUP)) is usually applied by first estimating variance
components and then obtaining BLUE and BLUP of fixed and random effects,
respectively, by replacing the parametric values of variance components by,
usually, their restricted maximum likelihood (REML) estimates into the Mixed
Model Equations (MME) [6]. Under random selection or absence of selection
this EBLUP procedure converges in probability to BLUE and BLUP as the
information in the data about variance components increases [22] and the
distributions of variance components are symmetric and peaked [2,8]. The
frequentist proprieties of EBLUP procedure under nonrandom selection are
unknown [22].
The mean of the posterior distribution of breeding values can be viewed
as a weighted average of BLUP predictions where the weighting function is
the marginal posterior density of the heritability [5,15,16]. Estimation of
breeding values by giving all weight to a REML estimate of heritability has
been given theoretical justification [3]. When the information in the data about
heritability is large enough, the marginal posterior distribution of this parameter
should be symmetric and peaked. The modal value of the marginal posterior
distribution should be a close approximation of its expected value. In this
case, the posterior distribution of the breeding values can be approximated
by replacing the unknown heritability by its REML estimate and an EBLUP
procedure should yield a good approximation of the expected value of the
marginal distribution of the breeding values.
Selection may increase the mean square error of the estimates of variance
components [12] amplifying the uncertainty about genetic parameters. Gianola
and Fernando [2], Wang et al. [21] and Sorensen et al. [15,16] advocated that
Bayesian methods can fully take into account the uncertainty about dispersion
parameters by considering the marginal posterior density of those parameters.
Although the Bayesian methods provide an attractive theoretical framework
for this problem, the practical benefits in prediction accuracy and precision
are not clear. A comparison between sampling properties of EBLUP and
Bayesian procedures under different scenarios including random and selected
populations would be of interest.
The objectives of this study were to examine the effects of non-random
selection on the parents (using phenotypic records or BLUP of breeding values)
on the sampling properties of EBLUP and Bayesian estimates of breeding
values assuming models with or without effects of contemporary groups, and
Bayesian versus empirical BLUP estimation 43
to examine the impact of missing pedigree information on these two alternative
methods.
2. MATERIALS AND METHODS
2.1. Data simulation
Data were generated using a stochastic procedure similar to that described
in [10,14,19,20]. This simulation procedure was simple and fully discussed
in the literature. The genetic model assumed a large number of unlinked loci
contributing to the genetic variance of a single hypothetical metric trait. The
base population consisted of 10 males and 40 females which were assumed to
be unrelated, unselected, and randomly sampled from a conceptually infinite
population. The base animals were mated at random (four females per male)
to produce 40 males and 40 females of generation 1. Ten males were selected
as parents for the next generation following one of three schemes, i.e., random
selection, selection on the basis of highest phenotypes, and selection on the
basis of highest estimated breeding values. The last two gave different degrees
of selection for true merit.
Therefore, selection was only on males and generations were discrete. Six
generations were simulated, including the base population. No attempt was
made to control inbreeding.
The model for simulation of data was Y
ij
= b
i
+ a
ij
+ e
ij
, where
Y
ij
is the phenotypic observation of animal j in contemporary group (CG) i,
b
i
is the effect of CG i,
a
ij
is the additive genetic value of animal j in CG i, and
e
ij
is the random residual term.
Values for e
ij
were independently drawn from a normal distribution with mean
zero and variance σ
2
e
.
The additive genetic variance for the base population, before selection,
was σ
2
a
. Genetic values of base animals were independently drawn from a
N(0, σ
2
a
). Genetic values of animals in later generations were simulated as
a
ij
=
1
2
(a
sj
+ a
dj
) + m
ij
, where a
sj
and a
dj
are genetic values of the sire and dam
of individual j, and m
ij
is the Mendelian sampling effect of individual j assumed
to be independent of the genetic values of the sire and dam. The inbreeding
coefficient (F) of the parents was taken into account, so that m
ij
was drawn
from a N
0,
1
2
−
1
4
(F
sj
+ F
dj
)
σ
2
a
.
Two models were used. The first model did not include CG effects, in which
case b
i
was equal to 0 for every i. This model was denoted as RM for random
simulation model. The second model, called mixed simulation model (MM),
included CG effects that were simulated in the first replicate and kept constant
44 F.S. Schenkel et al.
for all replicates. Eight CG’s were assigned per generation, four for males and
four for females. Their effects (b
i
) were drawn from a uniform distribution
ranging from −5.5 to +5.5. Animals were assigned randomly to CG’s within
generation and sex in each replicate. Connectedness of CG’s was guaranteed
by requiring two sires to have progeny in all eight CG’s within a generation,
and guaranteed a minimum of two animals per CG.
Pedigree information was either complete or had 15% randomly chosen non-
base animals with both sire and dam declared missing. Low (0.2) and high (0.5)
heritability values were used in the simulations. The sum of the genetic and
residual variances was kept at 20.0. The genetic variance was either 4.0 or 10.0,
and the residual variance was either 16.0 or 10.0, respectively. One hundred
replicates were simulated for each combination of model, selection scheme,
heritability level, and pedigree information, and each replicate included 400
animals with phenotypic records plus 50 base population animals without
records.
2.2. Analyses
The operational model was defined to be the same as the true model used
for simulation of a data set. An overall mean (µ) was included in the model
for RM data sets because the phenotypic mean was unlikely to be zero in the
selected populations. The univariate linear mixed model used to analyze the
simulated data was:
y = 1µ + Xb + Za + e.
The distributional assumptions were: a ∼ N(0, Aσ
2
a
) and e ∼ N(0, Iσ
2
e
),
where a is the vector of additive genetic effects and e is the vector of random
residual effects, and A was the numerator relationship matrix that included
base population animals and accounted for inbreeding.
REML estimates of variance components were obtained from the multiple
trait derivative free programs of Boldman et al. [1]. The starting values of the
variances were the true simulation values.
2.2.1. Bayesian analyses
Bayesian estimates were obtained via Gibbs sampling following Wang
et al. [22] and Van Tassel et al. [20]. In addition to the previously mentioned
assumptions about distributions, prior densities (PD) were assigned for all
variance components and the location parameters µ and b. Two different
priors were assumed for b: a flat improper prior, where p(b) ∝ constant (p()
denotes a density function), indicating no prior knowledge about their effects
(fixed b in a frequentist setting), or a proper prior, where b ∼ N(0, Iσ
2
b
).
The overall mean µ was always assumed fixed, that is p(µ) ∝ constant. For
Bayesian versus empirical BLUP estimation 45
the variance components independent scaled inverted chi-square distributions
(χ
−2
i
) were assumed:
p
σ
2
i
|ν
i
, s
2
i
∝
σ
2
i
−(ν
i
+2)/2
exp
−
1
2
ν
i
s
2
i
/σ
2
i
, i = b, a, e, (1)
where ν
i
is a degree of belief parameter and s
2
i
can be thought of as a prior
value for the variance.
The joint posterior density of all unknowns (Θ, v) was
p(Θ, v, y) ∝
σ
2
e
−(n+ν
e
+2)/2
× exp
−
1
2σ
2
e
(y − 1µ−Xb − Za)
(y − 1µ−Xb − Za) + ν
e
s
2
e
× (σ
2
b
)
−(k+ν
b
+2)/2
exp
−
1
2σ
2
b
(b
b + ν
b
s
2
b
× (σ
2
a
)
−(r+ν
a
+2)/2
exp
−
1
2σ
2
a
(a
A
−1
a + ν
a
s
2
a
(2)
where Θ
= (µ, b
, a
) are the location parameters, v
= (σ
2
b
, σ
2
a
, σ
2
e
) are the
variances, and ν
= (ν
b
, ν
a
, ν
e
), and s
= (s
2
b
, s
2
a
, s
2
e
) are parameters describing
the prior degrees of belief and prior variances, respectively. When a flat
improper prior was assumed for b, (1) did not apply for σ
2
b
and (2) did not
involve the term related with σ
2
b
.
For ν
i
a prior value of 5 was used for all variances. This value was
chosen so that the variance of the prior scaled inverted chi-square distribution
(V[p(σ
2
i
|ν
i
, s
2
i
)] = 2ν
2
i
s
4
i
/[(ν
i
− 2)
2
(ν
i
− 4)]) was large but finite. Given the
value for ν
i
, the prior values for s
2
i
were specified such that expected values of the
prior scaled inverted chi-square distribution (E[p(σ
2
i
|ν
i
, s
2
i
)] = [ν
i
/(ν
i
− 2)]s
2
i
)
were equal to the true values. These prior values used for ν
i
and s
2
i
yielded
prior coefficients of variation equal to 141.4% for any i and heritability level.
Gibbs sampling
The fully conditional posterior distributions for the location parameters were
normal. Let Θ
−i
be Θ without its i-th element and v
−i
to be v without its i-th
element, then
Θ
i
|y, Θ
−i
, v, s, ν ∼ N(
ˆ
Θ
i
, ˜ν
i
) for i = 1 to (1 + k + r) (3)
where
ˆ
Θ
i
= (h
i
−
1+k+r
j=1, j=i
w
ij
ˆ
Θ
j
)/w
ii
and ˜ν
i
= σ
2
e
/w
ii
, where w
ij
is the element ij
of the coefficient matrix and h
i
is the element i of the right-hand side of the
MME.
46 F.S. Schenkel et al.
The fully conditional posterior distribution of variance components were in
the scaled inverted chi-square form. For σ
2
e
it was
σ
2
e
|y, Θ, v
−e
, s, ν ∼ ˜ν
e
˜s
2
e
χ
−2
˜ν
e
, (4)
with parameters
˜ν
e
= n + ν
e
and
˜s
2
e
= [(y − 1µ − Xb − Zµ)
(y − 1µ − Xb − Zµ) + ν
e
s
2
e
]/ ˜ν
e
.
For the other variance components (σ
2
i
) it was
σ
2
i
|y, Θ, v
−i
, s, ν ∼ ˜ν
i
˜s
2
i
χ
−2
˜ν
i
, i = b, a, (5)
with parameters ˜ν
i
= q
i
+ν
i
, ˜s
2
b
= [b
b+ν
b
s
2
b
]/ ˜ν
b
and ˜s
2
a
= [a
A
−1
a+ν
a
s
2
a
]/ ˜ν
a
,
where q
i
= k or r, respectively.
The previous fully conditional posterior distributions from (3) to (5) were
used in the Gibbs sampling scheme. The starting values of the variances to
obtain the first solution from MME were the true simulated values.
The Gibbs sampling loop was repeated 10 000 times. A burn-in period of
1 000 rounds was used and was based on previous analyses where the plots of
all samples were subjectively evaluated for trend and variability.
Posterior parameter estimates
All samples after the burn-in period were used to estimate the posterior mean
of the distribution of the location parameters. Therefore, breeding values and
CG effects were evaluated at their posterior mean value.
2.2.2. Empirical BLUE/BLUP analyses
The MME were used to predict breeding values and to estimate CG effects.
The true variances were replaced by the REML estimates. The models were
the same as used for the Bayesian analyses.
2.3. Criteria for comparing methods
Methods were compared based on their biases, mean square errors (MSE),
and Spearman’s rank correlations of predicted breeding values and estimated
CG effects with respect to their true values. The rank correlation was used as
an attempt to measure the ability of each method in properly ranking animals
and environmental effects.
Bayesian versus empirical BLUP estimation 47
Bias and MSE were defined, respectively, as the average deviation and the
average squared deviation of predicted breeding values from their correspond-
ing true values or of estimated contrasts of CG effects from their corresponding
true values:
Bias
ω
=
q
i=1
1
q
( ˆω
i
− ω
i
)
MSE
ω
=
q
i=1
1
q
( ˆω
i
− ω
i
)
2
, for ω = a or b.
Where q is the number of animals or the number of CG’s, and ˆ refers to the
predicted or estimated value of the parameter ω.
Because an overall mean was included in all analyses, the effects of CG
were not estimable when they were treated as fixed effects. Thus, the estimable
contrasts between each level of CG effect and the first level were used to
calculate the rank correlation, bias, and MSE for all analyses.
The differences in biases, MSE and rank correlations between methods were
tested by a paired t-test [9,13] at the 5% significance level. For bias, the paired
t-test was not performed when the biases of both methods were not significantly
different from zero by a t-test.
3. RESULTS AND DISCUSSION
3.1. Spearman’s rank correlations
The results presented in Table I and Table II (for low and high heritabil-
ity, respectively) showed that there was no difference between Bayesian and
EBLUP estimation regarding the overall rank correlation of breeding values and
of estimable contrasts of CG effects with their true values for any combination
of simulation model, selection scheme, true heritability (h
2
), and level of
pedigree information (PI). Rank correlations were also calculated within each
generation (data not shown) and there were no differences between the two
procedures across all simulated scenarios.
Bayesian and EBLUP estimation yielded rank correlations between true and
predicted breeding values that were equally decreased by randomly missing PI
and by both phenotypic and BLUP selection. The joint effect of selection and
missing PI produced the smallest rank correlations for both RM and MM data
sets.
For all analyses, regardless of the true heritability, the rank correlations
between Bayesian and EBLUP estimates of breeding values and of contrasts
of CG effects were higher than 0.998 (data not shown).
48 F.S. Schenkel et al.
Table I. Empirical mean over 100 replicates of bias, mean square error (MSE), and Spearman’s rank correlation with the true values (ρ)
of predicted breeding values (BV) and estimated contrasts of contemporary group effects (CG), resulting from Bayesian analysis via
Gibbs sampling evaluated at the mean, and from empirical BLUP for combinations of MO, SM, PI and PD for h
2
= 0.20.
Bayesian Empirical BLUP
Analyses Bias MSE ρ Bias MSE ρ
# SM
§
SS PI PD BV CG BV CG BV CG BV CG BV CG BV CG
1 R R F F 0.07 2.68* 0.57 0.04 2.73 0.57
2 R R M F 0.07 2.89* 0.55 0.06 2.96 0.54
3 R P F F 0.03 2.73* 0.55 0.03 2.77 0.55
4 R B F F 0.03 2.72* 0.54 0.03 2.74 0.54
5 R P M F −0.45 3.18* 0.50 −0.45 3.27 0.50
6 R B M F −0.58 3.36* 0.49 −0.58 3.40 0.49
7 M R F F 0.09 0.10 2.79* 4.29 0.56 0.92 0.05 0.14 2.85 4.31 0.56 0.92
8 M R M F 0.08 0.08 3.02* 4.37 0.53 0.92 0.08 0.11 3.09 4.39 0.53 0.92
9 M P F F 0.00 0.16 2.93* 4.38* 0.54 0.92 0.01 0.17 3.16 4.57 0.54 0.92
10 M B F F 0.07 0.10 3.00* 4.51* 0.54 0.92 0.09 0.07 3.29 4.64 0.54 0.92
11 M P M F −0.48* 0.52* 3.41* 4.71* 0.49 0.92 −0.50 0.61 3.55 4.86 0.49 0.92
12 M B M F −0.67* 0.71* 3.71* 4.97* 0.48 0.92 −0.70 0.75 3.97 5.05 0.48 0.92
13 M R F N 0.18* 0.36* 2.80* 3.54* 0.56 0.92 0.11 0.38 2.85 3.60 0.56 0.92
14 M R M N 0.11 0.38* 3.01* 3.61* 0.53 0.92 0.10 0.39 3.05 3.66 0.53 0.92
15 M P F N 0.20 0.33* 2.92* 3.50* 0.54 0.92 0.22 0.29 3.07 3.58 0.54 0.92
16 M B F N 0.26* 0.29* 2.98* 3.58* 0.54 0.92 0.30 0.24 3.15 3.73 0.54 0.92
17 M P M N −0.40* 0.69* 3.27* 3.93* 0.50 0.92 −0.52 0.76 3.45 4.09 0.50 0.92
18 M B M N −0.59* 0.84* 3.52* 4.18* 0.48 0.92 −0.73 0.97 3.82 4.52 0.48 0.92
§
SM = simulation model: R = random model; M = mixed model.
SS = selection scheme: R = random selection; P = phenotypic selection; B = BLUP selection.
PI = pedigree information: F = full; M = 15% randomly missing.
PD = prior density for b: F = flat improper prior; N = proper prior (normal density) or, for empirical BLUP analyses,
b treated as F = fixed; N = random.
* Significant difference (p < 0.05) between Bayesian and empirical BLUP analyses.
# Analysis number.
Bayesian versus empirical BLUP estimation 49
Table II. Empirical mean over 100 replicates of bias, mean square error (MSE), and Spearman’s rank correlation with the true values
(ρ) of predicted breeding values (BV) and estimated contrasts of contemporary group effects (CG), resulting from Bayesian analysis via
Gibbs sampling evaluated at the mean and from empirical BLUP for combinations of MO, SM, PI and PD for h
2
= 0.50.
Bayesian Empirical BLUP
Analyses Bias MSE ρ Bias MSE ρ
# SM
§
SS PI PD BV CG BV CG BV CG BV CG BV CG BV CG
1 R R F F 0.12 4.18 0.76 0.05 4.18 0.76
2 R R M F 0.11 4.60* 0.75 0.08 4.61 0.75
3 R P F F 0.10 4.19 0.74 0.05 4.18 0.74
4 R B F F 0.09 4.21 0.73 0.04 4.21 0.73
5 R P M F −1.44∗ 6.79* 0.72 −1.46 6.85 0.72
6 R B M F −1.59∗ 7.29* 0.71 −1.61 7.37 0.71
7 M R F F 0.16* 0.02 4.58 3.75 0.74 0.93 0.08 0.08 4.58 3.76 0.74 0.93
8 M R M F 0.12 0.01 5.05* 3.88 0.73 0.93 0.10 0.04 5.07 3.89 0.73 0.93
9 M P F F −0.02 0.16 4.94* 3.71* 0.72 0.93 −0.09 0.21 5.06 3.80 0.72 0.93
10 M B F F 0.07 0.13 5.02* 3.98 0.72 0.93 0.01 0.17 5.10 4.04 0.72 0.93
11 M P M F −1.53∗ 1.14* 8.36* 5.99* 0.69 0.93 −1.56 1.22 8.66 6.27 0.69 0.93
12 M B M F −1.82∗ 1.55* 9.78* 7.45* 0.67 0.92 −1.86 1.65 10.28 7.96 0.67 0.92
13 M R F N 0.32* 0.22* 4.60 3.13* 0.74 0.93 0.15 0.27 4.61 3.19 0.74 0.93
14 M R M N 0.17* 0.26* 4.99 3.22* 0.73 0.93 0.13 0.28 4.96 3.26 0.73 0.93
15 M P F N 0.35* 0.19 4.84 2.93 0.72 0.93 0.29 0.22 4.88 3.10 0.72 0.93
16 M B F N 0.37* 0.20 4.88 3.13* 0.72 0.93 0.31 0.21 4.88 3.17 0.72 0.93
17 M P M N −1.39∗ 1.07* 7.44* 4.54* 0.69 0.93 −1.43 1.11 7.66 4.70 0.69 0.93
18 M B M N −1.68∗ 1.38* 8.59* 5.52* 0.68 0.93 −1.71 1.44 8.88 5.83 0.68 0.93
§
SM = simulation model: R = random model; M = mixed model.
SS = selection scheme: R = random selection; P = phenotypic selection; B = BLUP selection.
PI = pedigree information: F = full; M = 15% randomly missing.
PD = prior density for b: F = flat improper prior; N = proper prior (normal density) or, for empirical BLUP analyses,
b treated as F = fixed; N = random.
* Significant difference (p < 0.05) between Bayesian and empirical BLUP analyses.
# Analysis number.
50 F.S. Schenkel et al.
Selection and missing PI did not affect rank correlations between true
and estimated contrasts of CG effects. The insensitivity of rank correlations
between true and estimated contrasts of fixed CG effects to missing PI [4,7] and
to phenotypic selection, which was characteristically not translation invariant
to the fixed effects [7], was not expected. The simulation procedure may have
facilitated the estimation of CG effects for several reasons. First, animals
were assigned randomly to CG in each generation. Thus, great differences
in genetic mean among CG’s from the same generation were not expected.
Larger differences may be found with real data. Second, sires were selected
across CG’s, but within each discrete generation. Finally, the average number
of animals within CG levels (10) was large enough to allow estimation of their
effects with reasonable accuracy [18]. With real data, some CG’s are often
smaller and especially the variability of CG size is usually much larger.
Use of proper informative priors for CG effects and their variance or consid-
ering CG effects as random in EBLUP analyses had negligible effect on rank
correlations of breeding values.
3.2. Biases
Table III presents the empirical mean over 100 replicates of the biases in each
generation and over generations for high h
2
. Bayesian and EBLUP estimation
showed the same pattern regarding the biases of both predicted breeding values
and estimated contrasts of CG effects. The small differences between biases
of the two methods were (Tab. II), however, often significant (p < 0.05). For
low h
2
, similar results were found.
Phenotypic and BLUP selection did not cause bias on predicted breeding
values from Bayesian and EBLUP analyses when pedigree information was
complete (Tabs. I and II).
Nonrandom selection in conjunction with 15% randomly missing PI had
large impact on biases of estimates from both procedures for RM and MM data
sets (Tab. III, analyses 5 and 6, and 11 and 12, respectively). In these cases,
biases in breeding values increased negatively and consistently as generation
number increased. For both, phenotypic and BLUP selected populations, the
bias in the last generation was around 29% and 34% of the true additive
genetic mean of the population at this generation for RM and MM data sets,
respectively. For the case of full PI, the same figures were 2% and 1%. For
low h
2
, the biases were 23% and 28%, and 1% and 2% for the cases of missing
and full PI, respectively.
In the MM data sets, the increase of bias in the estimated contrasts of CG
effects was in the opposite direction (positive) to that of the breeding values.
When changes in the expectations of genetic values are not modeled through a
complete additive relationship matrix in an animal model or the use of a genetic
Bayesian versus empirical BLUP estimation 51
Table III. Bias
#
of predicted breeding values and estimated contrasts of contemporary group effects in each generation (Gen) for
Bayesian and empirical BLUP estimation for h
2
= 0.50. (continued on the next page)
Anal.
§
: 1 2 3 4 5 6 7 8 9 10 11 12 13 14 15 16 17 18
Gen Bias of breeding values
Bayesian
0 0.08 0.09 0.08 0.09 −0.54 −0.61 0.08 0.08 0.08 0.08 −0.13 −0.16 0.08 0.05 0.08 0.08 −0.25 −0.29
1 0.09 0.08 0.09 0.10 −1.12 −1.24 0.09 0.08 0.08 0.09 −0.33 −0.38 0.09 0.00 0.09 0.10 −0.55 −0.63
2 0.09 0.09 0.11 0.09 −1.32 −1.48 0.11 0.09 0.03 0.08 −0.91 −1.09 0.21 0.09 0.26 0.26 −0.96 −1.16
3 0.13 0.13 0.12 0.13 −1.45 −1.59 0.17 0.14 0.00 0.12 −1.53 −1.80 0.39 0.24 0.43 0.48 −1.35 −1.63
4 0.11 0.10 0.07 0.06 −1.61 −1.78 0.19 0.13 −0.13 0.03 −2.18 −2.58 0.42 0.23 0.44 0.46 −1.86 −2.25
5 0.15 0.14 0.12 0.10 −1.70 −1.87 0.25 0.18 −0.13 0.04 −2.71 −3.22 0.48 0.27 0.52 0.54 −2.27 −2.74
x
∗
0.12 0.11 0.10 0.09 −1.44 −1.59 0.16 0.12 −0.02 0.07 −1.53 −1.82 0.32 0.17 0.35 0.37 −1.39 −1.68
Empirical BLUP
0 0.05 0.08 0.05 0.06 −0.56 −0.63 0.05 0.08 0.05 0.06 −0.12 −0.14 0.02 0.03 0.06 0.06 −0.24 −0.28
1 0.04 0.06 0.04 0.04 −1.16 −1.28 0.04 0.06 0.04 0.05 −0.31 −0.33 −0.01 −0.01 0.04 0.04 −0.53 −0.61
2 0.03 0.06 0.05 0.03 −1.34 −1.51 0.04 0.07 −0.01 0.03 −0.92 −1.10 0.06 0.06 0.20 0.19 −0.97 −1.16
3 0.06 0.10 0.07 0.08 −1.47 −1.61 0.09 0.11 −0.07 0.06 −1.56 −1.85 0.21 0.20 0.37 0.41 −1.39 −1.66
4 0.05 0.08 0.02 0.01 −1.62 −1.79 0.10 0.11 −0.20 −0.03 −2.23 −2.66 0.23 0.18 0.38 0.40 −1.91 −2.30
5 0.08 0.11 0.08 0.06 −1.70 −1.87 0.15 0.14 −0.22 −0.02 −2.79 −3.35 0.28 0.22 0.45 0.49 −2.35 −2.83
x 0.05 0.08 0.05 0.04 −1.46 −1.61 0.08 0.10 −0.09 0.01 −1.56 −1.86 0.15 0.13 0.29 0.31 −1.43 −1.71
52 F.S. Schenkel et al.
Table III. Continued.
Anal.
§
: 1 2 3 4 5 6 7 8 9 10 11 12 13 14 15 16 17 18
Gen Bias of estimable contrasts of CG effects
Bayesian
1 0.11 0.06 0.06 0.13 −0.06 0.11 0.59 0.56 0.59 0.61 0.44 0.59
2 0.04 0.00 0.06 0.08 0.50 0.79 0.32 0.33 0.27 0.30 0.67 0.91
3 0.05 0.03 0.17 0.12 1.17 1.57 0.07 0.10 0.03 0.01 0.94 1.24
4 −0.01 −0.01 0.25 0.16 1.78 2.30 0.09 0.15 0.07 0.08 1.45 1.86
5 −0.05 −0.03 0.28 0.16 2.33 2.95 0.05 0.14 0.01 0.02 1.84 2.32
x 0.02 0.01 0.16 0.13 1.14 1.55 0.22 0.26 0.19 0.20 1.07 1.38
Empirical BLUP
1 0.14 0.10 0.08 0.16 −0.02 0.15 0.59 0.57 0.60 0.61 0.43 0.58
2 0.09 0.04 0.10 0.12 0.55 0.87 0.36 0.34 0.29 0.31 0.70 0.94
3 0.11 0.07 0.21 0.16 1.25 1.67 0.13 0.13 0.05 0.03 1.00 1.31
4 0.04 0.01 0.30 0.20 1.88 2.44 0.15 0.17 0.09 0.08 1.52 1.94
5 0.02 0.00 0.35 0.21 2.46 3.15 0.13 0.17 0.04 0.03 1.95 2.45
x 0.08 0.04 0.21 0.17 1.22 1.65 0.27 0.28 0.22 0.21 1.12 1.44
#
Average over 100 replicates.
∗
Bias over all generations excluding base generation (0).
§
Anal.: 1 2 3 4 5 6 7 8 9 10 11 12 13 14 15 16 17 18
SM R R R R R R M M M M M M M M M M M M
SS R R P B P B R R P B P B R R P B P B
PI F M F F M M F M F F M M F M F F M M
PD F F F F F F F F F F F F N N N N N N
SM = simulation model: R = random model; M = mixed model.
SS = selection scheme: R = random selection; P = phenotypic selection; B = BLUP selection.
PI = pedigree information: F = full; M = 15% randomly missing.
PD = prior density for b: F = flat improper prior; N = proper prior (normal density) or, for empirical BLUP analyses,
b treated as F = fixed; N = random.
Bayesian versus empirical BLUP estimation 53
grouping strategy [24], solutions for the genetic effects might be confounded
by fixed effects, generating bias and increased MSE. The use of Bayesian
procedure did not lessen the effects of not accounting for missing PI when
non random selection was applied. These results reinforce the importance
and need for properly account for missing PI regardless of the procedure used
for estimation. Rodriguez et al. [11] gave one example of an application of
Bayesian analyses with genetic groups in the model.
3.3. Mean square errors
Table IV presents the empirical mean over 100 replicates of the MSE in each
generation and over generations for high h
2
. The mean MSE over generations
of predicted breeding values and estimated contrasts of CG effects were usually
smaller (p < 0.05) for Bayesian than for EBLUP analyses (Tab. II) although the
differences were small. Selection associated with missing PI greatly increased
the MSE of predicted breeding values and estimated contrasts of CG effects
from both Bayesian and EBLUP analyses. Similar results were found for
low h
2
.
As shown in Tables I and II, phenotypic and BLUP selection did not cause
bias on predicted breeding values from Bayesian and EBLUP analyses when
pedigree information was complete, but increased MSE, when MM data sets
were analyzed (analyses 7 vs. 9 and 10).
Weigel et al. [23] investigated the improvement of fixed effect estimates in a
mixed linear model and concluded that it was possible to improve upon unbiased
estimators in a mean squared error sense by allowing bias. In agreement with
Weigel et al. [23], treating CG’s as random (Tabs. III and IV), shrunk their
solutions towards zero, created some bias on CG estimates, but reduced the
MSE of CG and, in less extent, of breeding value estimates in nonrandomly
selected populations with full PI (analyses 9 and 10 vs. 15 and 16). With
missing PI (analyses 11 and 12 vs. 17 and 18), the reduction in the MSE of
breeding value estimates was more accentuate. With full PI, treating CG’s as
random introduced a small bias in the breeding values estimates (Analyses 7,
9, and 10 vs. 13, 15, and 16).
3.4. General discussion
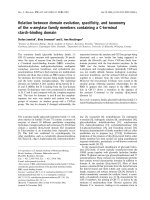
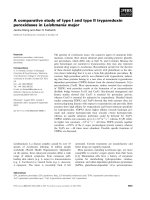
The asymmetry of the marginal posterior distribution of σ
2
a
, when there
was random selection and full pedigree information, as illustrated in Figure 1
(analysis 7) for low and high h
2
, suggests that the simulated data sets did
not have a high degree of resolution concerning inferences about genetic
parameters. Sorensen et al. [16] argued that this fact is taken into account
when computing the marginal posterior distribution of breeding values. This
is in marked contrast with the estimation of breeding values that is obtained
54 F.S. Schenkel et al.
Table IV. Mean square error (MSE)
#
of predicted breeding values and estimated contrasts of contemporary group effects in each
generation (Gen) for Bayesian and empirical BLUP estimation for h
2
= 0.50. (continued on the next page)
Anal.
§
: 1 2 3 4 5 6 7 8 9 10 11 12 13 14 15 16 17 18
Gen MSE of breeding values
Bayesian
0 7.27 7.73 7.31 7.27 8.30 8.41 7.43 7.85 7.42 7.46 7.95 8.08 7.42 7.84 7.40 7.44 7.96 8.07
1 4.34 4.68 4.32 4.33 5.97 6.28 4.68 5.01 4.74 4.73 5.35 5.58 4.63 4.94 4.67 4.67 5.35 5.53
2 4.05 4.47 4.08 4.11 6.20 6.73 4.39 4.81 4.62 4.58 5.81 6.27 4.37 4.76 4.59 4.54 5.71 6.17
3 4.02 4.40 4.07 4.09 6.59 7.03 4.43 4.84 4.84 4.86 7.52 8.59 4.48 4.80 4.79 4.80 6.82 7.72
4 4.01 4.47 4.00 4.08 7.17 7.82 4.43 5.01 4.87 5.09 9.97 12.10 4.49 4.96 4.74 4.88 8.49 10.27
5 4.47 4.96 4.48 4.46 8.00 8.62 4.97 5.57 5.64 5.84 13.16 16.35 5.04 5.50 5.43 5.51 10.81 13.23
x
∗
4.18 4.60 4.19 4.21 6.79 7.29 4.58 5.05 4.94 5.02 8.36 9.78 4.60 4.99 4.84 4.88 7.44 8.59
Empirical BLUP
0 7.27 7.74 7.30 7.27 8.34 8.46 7.43 7.86 7.43 7.47 8.01 8.17 7.44 7.83 7.40 7.45 8.00 8.11
1 4.34 4.70 4.31 4.33 6.08 6.41 4.69 5.03 4.78 4.76 5.49 5.79 4.69 4.94 4.70 4.69 5.43 5.63
2 4.05 4.49 4.07 4.11 6.28 6.83 4.39 4.83 4.67 4.62 5.94 6.47 4.40 4.74 4.60 4.54 5.80 6.27
3 4.02 4.41 4.06 4.08 6.66 7.12 4.43 4.85 4.93 4.91 7.73 8.94 4.43 4.75 4.82 4.76 7.00 7.94
4 4.01 4.49 4.00 4.07 7.20 7.86 4.43 5.03 5.02 5.21 10.31 12.72 4.49 4.92 4.79 4.87 8.78 10.64
5 4.47 4.97 4.47 4.45 8.01 8.63 4.95 5.58 5.88 6.02 13.80 17.45 5.03 5.46 5.48 5.52 11.30 13.92
x 4.18 4.61 4.18 4.21 6.85 7.37 4.58 5.07 5.06 5.10 8.66 10.28 4.61 4.96 4.88 4.88 7.66 8.88
Bayesian versus empirical BLUP estimation 55
Table IV. Continued.
Anal.
§
: 1 2 3 4 5 6 7 8 9 10 11 12 13 14 15 16 17 18
Gen MSE of estimable contrasts of CG effects
Bayesian
1 3.78 3.85 3.45 3.66 3.81 3.82 3.35 3.35 3.07 3.26 3.20 3.36
2 3.68 3.80 3.38 3.60 3.81 4.30 3.06 3.14 2.77 2.96 3.30 3.79
3 3.67 3.73 3.52 3.78 5.05 6.29 3.00 3.04 2.77 2.96 3.82 4.64
4 3.78 3.97 3.90 4.29 7.34 9.71 3.10 3.26 2.94 3.20 5.40 6.97
5 3.83 4.02 4.26 4.59 9.67 13.13 3.13 3.28 3.09 3.27 6.78 8.87
x 3.75 3.87 3.70 3.98 5.93 7.45 3.13 3.21 2.93 3.13 4.50 5.52
Empirical BLUP
1 3.79 3.86 3.47 3.66 3.82 3.82 3.39 3.40 3.23 3.30 3.26 3.41
2 3.69 3.81 3.41 3.62 3.88 4.44 3.13 3.19 2.92 3.01 3.39 3.90
3 3.69 3.74 3.59 3.82 5.24 6.68 3.04 3.07 2.91 2.99 3.97 4.88
4 3.79 3.98 4.02 4.37 7.71 10.44 3.17 3.30 3.15 3.24 5.67 7.37
5 3.83 4.02 4.45 4.75 10.36 14.42 3.19 3.31 3.31 3.34 7.23 9.57
x 3.76 3.88 3.79 4.04 6.20 7.96 3.19 3.25 3.10 3.18 4.70 5.83
#
Average over 100 replicates.
∗
MSE over all generations excluding base generation (0).
§
Anal.: 1 2 3 4 5 6 7 8 9 10 11 12 13 14 15 16 17 18
SM R R R R R R M M M M M M M M M M M M
SS R R P B P B R R P B P B R R P B P B
PI F M F F M M F M F F M M F M F F M M
PD F F F F F F F F F F F F N N N N N N
SM = simulation model: R = random model; M = mixed model.
SS = selection scheme: R = random selection; P = phenotypic selection; B = BLUP selection.
PI = pedigree information: F = full; M = 15% randomly missing.
PD = prior density for b: F = flat improper prior; N = proper prior (normal density) or, for empirical BLUP analyses,
b treated as F = fixed; N = random.
56 F.S. Schenkel et al.
using EBLUP, which assumes the h
2
known and gives 100% weight to an
estimate of this h
2
. In this study, however, Bayesian estimation did not differ
from EBLUP estimation regarding rank correlations with true values for both
estimated contrasts of CG effects and predicted breeding values. With respect
to bias and MSE, EBLUP and Bayesian estimation showed the same pattern
over the range of simulated scenarios and exhibited only small differences in
their values.
The small differences in biases and MSE of the estimates from the two
methods could be speculated to be due to the influence of the vague prior
densities on variance components used in the Bayesian analyses. If this is the
case, those small differences should disappear when larger, more informative
data files were analyzed, because the likelihood function of the data would
dominate the prior information.
Markov Chain Monte Carlo (MCMC) error of Bayesian estimates was indir-
ectly assessed for the variance components on the basis of effective chain sizes,
which ranged from 145 to 385 for all variances. The effective chain sizes were
reasonably large to yield acceptable MCMC errors on the posterior means.
The great appeal of the Bayesian analyses via Gibbs sampling is that it yields
Monte Carlo estimates of the full marginal posterior distribution of all paramet-
ers of interest, for instance breeding values, from which the probabilities that
the parameter lies between specified values can be computed [17,20]. This is
particularly interesting when asymptotic normality of the posterior distributions
is difficult to justify, which can be the case with selected populations [16] when
the variance components are not known. In this case, the uncertainty about the
variance components is accounted for in the Bayesian probability intervals of
predicted breeding values [22].
There are also situations where the infinitesimal model is not a sound
approximation and, therefore, normality does not hold after cycles of selection.
Bayesian analyses could be more flexible to incorporate more appropriate or
robust distributions.
Bayesian analyses via Gibbs sampling are becoming more and more feasible
as computer power increases and as better algorithms are developed. The
applicability of Bayesian methods for genetic evaluation is already possible
routinely for moderately sized problems.
4. CONCLUSIONS
Bayesian and EBLUP estimation did not differ over the range of simulated
situations in this study with respect to Spearman’s rank correlations between
true and predicted breeding values and between true and estimated contrasts of
CG effects. Hence, the two methods showed the same ability to rank animals
and environmental CG effects.
Bayesian versus empirical BLUP estimation 57
Figure 1. Examples of average marginal posterior density functions (pdf) of genetic
and residual variances for analysis 7 with their corresponding mean, mode and variance
for true h
2
equal to 0.20 and 0.50. REML is the average restricted maximum likelihood
estimate.
The sample properties, Bias and MSE, of Bayesian and of EBLUP estimates
showed the same pattern over the range of simulated scenarios. The bias and
MSE of Bayesian estimates were often less than of EBLUP estimates, but the
differences were small and likely due to the vague prior information on variance
components used in the Bayesian analyses.
58 F.S. Schenkel et al.
Phenotypic and BLUP selection did not cause bias in predicted breeding
values by Bayesian or EBLUP when pedigree information was complete, but
caused small increases in MSE, when MM data sets were analyzed.
Bayesian and EBLUP prediction of breeding values were similarly affected
by the joint effect of phenotypic or BLUP selection and randomly missing
pedigree information. For both methods, bias and MSE of predicted breeding
values and estimated contrasts of CG’s substantially increased across gen-
erations, because the change in the expectation of breeding values was not
accounted for in the model.
ACKNOWLEDGEMENTS
CAPES – Fundação Coordenação de Aperfeiçoamento de Pessoal de Nível
Superior – is gratefully acknowledged for granting a fellowship to the first
author. The authors would like to thank Ontario Ministry of Agriculture, Food
and Rural Affairs for financial support.
REFERENCES
[1] Boldman K.G., Kriese L.A., van Vleck L.D., van Tassell C.P., Kachman S.D., A
manual for use of MTDFREML. U.S. Depart. Agriculture, Agricultural Research
Service, 1995.
[2] Gianola D., Fernando R.L., Bayesian methods in animal breeding theory, J.
Anim. Sci. 63 (1986) 217–244.
[3] Gianola D., Foulley J.L., Fernando R.L., Prediction of breeding values when
variances are not known, Génét. Sél. Évol. 18 (1986) 485–498.
[4] Gianola D., Im S., Fernando R.L., Prediction of breeding values under Hender-
son’s selection model: A Revisitation, J. Dairy Sci. 71 (1988) 2790–2798.
[5] Harville D.A., Discussion of the paper by Robinson G.K.: That BLUP is a good
thing: The estimation of random effects, Statistical Sci. 6 (1991) 15–51.
[6] Henderson C.R., Kempthorne O., Searle S.R., von Krosigk C.M., The estimation
of environmental and genetic trends from records subject to culling, Biometrics
15 (1959) 192–218.
[7] Henderson C.R., Best linear unbiased estimation and prediction under a selection
model, Biometrics 31 (1975) 423–447.
[8] Kackar R.N., Harville D.A., Unbiasedness of two-stage estimation and prediction
procedures for mixed linear models, Communications for Statistics. A. Theory
and Methods 10 (1981) 1249–1261.
[9] Oikawa T., Sato K., Treating small herds as fixed or random in an animal model,
J. Anim. Breed. Genet. 114 (1996) 177–183.
[10] Pieramati C., van Vleck L.D., Effects of genetic groups on estimates of additive
genetic variance, J. Anim. Sci. 71(1993) 66–70.
Bayesian versus empirical BLUP estimation 59
[11] Rodriguez M.C., Toro M., Silió L., Selection on lean growth in a nucleous
of Landrace pigs: An Analysis using Gibbs sampling, Anim. Sci., 63 (1996)
243–253.
[12] Schenkel F.S., Schaeffer L.R., Effects nonrandom parental selection on estima-
tion of variance components. J. Anim. Breed. Genet. 117 (2000) 225–239.
[13] Snedecor G., Cochran W.G., Statistical methods, The Iowa College Press, Ames,
Iowa, 1980.
[14] Sorensen D.A., Kennedy B.W., Estimation of genetic variances from unselected
and selected populations, J. Anim. Sci. 59 (1984) 1213–1223.
[15] Sorensen D.A., Anderson S., Jensen J., Wang C.S., Gianola D., Inferences about
genetic parameters using the Gibbs sampler, in: Proceedings of the 5th World
Congress on Genetics Applied to Livestock Production, 7–12 August 1994,
Vol. 18, University of Guelph, Guelph, pp. 321–328.
[16] Sorensen D.A., Wang C.S., Jensen J., Gianola D., Bayesian analysis of genetic
change due to selection using Gibbs sampling, Genet. Sel. Evol. 26 (1994)
333–360.
[17] Sorensen D., Gibbs sampling in quantitative genetics. Internal report No. 82,
Danish Institute of Animal Science, Tjele, 1996.
[18] Tosh J.J., Wilton J.W., Effects of data structure on variance of prediction error
and accuracy of genetic evaluation, J. Anim. Sci. 72 (1994) 2568–2577.
[19] van der Werf J.H.J., De Boer I.J.M., Estimation of additive genetic variance when
base populations are selected, J. Anim. Sci. 68 (1990) 3124–3132.
[20] van Tassell C.P., Casela G., Pollak E.J., Effects of selection on estimates of
variance components using Gibbs sampling and restricted maximum likelihood,
J. Dairy Sci. 78 (1995) 678–692.
[21] Wang C.S., Rutledge J.J., Gianola D., Marginal inferences about variance com-
ponents in a mixed linear model using Gibbs sampling, Genet. Sel. Evol. 25
(1993) 41–62.
[22] Wang C.S., Rutledge J.J., Gianola D., Bayesian analysis of mixed linear models
via Gibbs sampling with an application to litter size in Iberian pigs, Genet. Sel.
Evol. 26 (1994) 91–115.
[23] Weigel K.A., Gianola D., Templeman R.J., Matos C.A., Chen I.H.C., Wang T.,
Bunge R., Lo L.L., Improving estimates of fixed effects in a mixed linear model,
J. Dairy Sci. 74 (1991) 3174–3182.
[24] Westell R.A., Quaas R.L., van Vleck L.D., Genetic groups in an animal model,
J. Dairy Sci. 71 (1988) 1310.
To access this journal online:
www.edpsciences.org