Báo cáo khoa hoc:"Food resource allocation patterns in lactating females in a long-term selection experiment for litter size in mice" pot
Bạn đang xem bản rút gọn của tài liệu. Xem và tải ngay bản đầy đủ của tài liệu tại đây (370.37 KB, 22 trang )
Genet. Sel. Evol. 34 (2002) 83–104 83
© INRA, EDP Sciences, 2002
DOI: 10.1051/gse:2001005
Original article
Food resource allocation patterns
in lactating females in a long-term
selection experiment for litter size in mice
Wendy M. R
AUW
a, ∗
, Pieter W. K
NAP
b
,
Martinus W.A. V
ERSTEGEN
c
, Petronella L
UITING
b
a
Area de Producció Animal, Centre UdL-IRTA, Alcalde Rovira Roure, 177,
25198 Lleida, Spain
b
PIC Deutschland GmbH, P.O. Box 1630, D-24826 Schleswig, Germany
c
Animal Nutrition Group, Wageningen Institute of Animal Science, P.O. Box 338,
6700 AH Wageningen, The Netherlands
(Received 14 June 2000; accepted 25 July 2001)
Abstract – Resource allocation patterns, as quantified by residual food intake (RFI), and the
consequences for offspring development were investigated during lactation in 96 females of a
mouse line selected for 104 generations for high litter size at birth (S-line) and in 87 females
of a non-selected control line (C-line). Litters of 45 C-line dams (Cs) and 48 S-line dams (Ss)
were standardised (s) at birth; other dams (ns) supported total number of pups born (Cns and
Sns, respectively). RFI during lactation was significantly lower in Sns-dams than in C-line
dams and Sns-dams. After weaning Sns-dams seemed to be able to restore the negative resource
situation. Sns-pups were about 25% less mature than Cns-pups at all times. Maturity was similar
for Cs- and Ss-pups from 2 d in lactation on, and about 18% and 53% higher than Cns- and
Sns-pups. The pre-weaning mortality rate was significantly higher in Sns-litters (35.6 ± 2.76)
than in Cns-litters (4.95 ± 2.23). The results suggest that S-line dams allocated considerably
more resources to maintenance of offspring than C-line dams. This was insufficient to provide
the offspring with an adequate amount of resources, resulting in reduced pup development and
increased pre-weaning mortality rates.
mice / litter size / lactation / resource allocation / residual food intake
1. INTRODUCTION
Residual food intake is defined as the part of food intake that is unaccounted
for by food requirements for maintenance and production, or in other words,
as the difference between the food that is consumed by an animal and its con-
sumption as predicted from a model involving its maintenance requirements, its
∗
Correspondence and reprints
E-mail:
84 W.M. Rauw et al.
growth and production traits such as milk or egg production; for pigs, growth in
itself is a production trait. Variation in RFI can be caused by variation in partial
efficiencies for maintenance and growth and by variation in metabolic food
demanding processes not included in the model, such as behavioural activities,
responses to pathogens and responses to stress. Since growth is virtually
absent at maturity, the differences in RFI are mainly explained by differences
in maintenance requirements [10]. Estimation of RFI is proposed as a tool to
quantify resource allocation patterns and is suggested to be an estimate of the
total amount of “buffer” resources that are available for, e.g., physical activity
and the ability to cope with unexpected stresses and challenges [11,21].
Rauw et al. [22] showed that mature non-reproductive individuals (6 to
10 wk of age) from a mouse line selected for more than 90 generations for high
litter size at birth (S-line), and in particular females, have a significantly higher
residual food intake (RFI) than mice of a non-selected control line (C-line).
This suggests that S-line females have more “buffer” resources left in the adult
state than C-line females. It is interesting that particularly females of the
selection line have a very high RFI, since these animals can express the trait
their genotype has been selected for: a high litter size at farrowing. This higher
RFI in non-reproductive females may anticipate the highly increased resource
demand during pregnancy and especially lactation. Indeed, an increased energy
for maintenance with selection for heat loss in mice allowed for a greater litter
size as a correlated effect in the study of Nielsen et al. [14]. However, since
lactation is the period of peak energy demand [15] and S-line dams have to
support a litter that has practically been doubled in size by selection, lactation
may considerably change the resource allocation patterns. The question is
whether this can be supported by an increase in food intake during these periods,
or whether the RFI will drop considerably when reproductive performance is
included in its calculation.
In the present study we investigated food resource allocation patterns as
quantified by residual food intake, and offspring development from birth to
weaning in a long-term selection experiment for litter size in mice. To
manipulate experimentally the energy burden of lactation, in each line, half
of the females supported litters that were standardised at birth and half of the
females supported all pups born. The aim was to study the food resource
allocation patterns in these animals in relation with offspring development.
2. MATERIALS AND METHODS
Two mouse lines of the Norwegian mouse selection experiment (e.g., [32])
were used: a line selected for 104 generations for high litter size at birth (S-line)
and a non-selected control line (C-line). The average total number of pups born
in the 104th generation was 10 in the C-line and 21 in the S-line.
Food resource allocation in lactating mice 85
Per line, 98 females were randomly chosen at 3 wk of age (i.e., at weaning)
and housed individually. The mice originated from litters standardised at birth,
when larger than 8 pups, to 8 pups per litter. At 10 wk of age all females were
mated and stayed with the male for 2 wk. Gestation length was on the average
19 d. Among 87 C-line females and 96 S-line females that became pregnant,
the litters of 45 C-line dams (Cs) and 48 S-line dams (Ss) were standardised at
birth, when larger than 8 pups, to 8 pups per litter; the litters of 42 C-line dams
(Cns) and 48 S-line dams (Sns) were not standardised. During the period from
farrowing to weaning, all pups of 2 Cns-, 6 Cs-, 1 Sns- and 1 Ss-, and 1 Cs-line
dam died.
At 13 and 15 d of lactation, 20 Cns-, 20 Cs-, 20 Sns- and 20 Ss-dams were
subjected to an open-field test and a runway test (test duration of 60 s), as
described by Rauw et al. [21]. Since RFI measurements did not differ signi-
ficantly between tested and non-tested animals, these animals were included in
the analysis of the present study.
The mice were housed in 30 × 12.5 × 12.5 cm
3
cages bedded with sawdust
and had free access to pellet concentrate and water. The energy content of the
food was 12.6 kJ ME per gram and contained 21% crude protein, as given by
the producer. Light was left on for 24 h per day.
2.1. Non-reproductive females
2.1.1. Body weight, food intake and residual food intake
From 21 to 69 d of age, individual body weight (g) and food intake (g/3d)
were measured every 3 d. Individual body weight gain (g/3d) and cumulative
food intake (g) were calculated from these data.
According to Rauw et al. [22], residual food intake (g/3d) was estimated
from multiple linear regression of food intake (g/3d) on metabolic body weight
(kg
0.75
) and body weight gain (g/3d). Residual food intake is defined as the
difference between the food that is consumed by an animal and its consumption
as predicted from requirements for growth and maintenance per metabolic kg
of the C-line female population [22]. Residual food intake was estimated for a
“growing period”, i.e., from 21 to 42 d of age, and an “adult period”, i.e., from
42 to 69 d of age, from accumulated data on growth and food intake per animal
over these periods [22].
2.1.2. Asymptotic mature body weight and mature food intake
Following Archer and Pitchford [1], modified Parks’ [16] curves were fitted
to individual data on body weight (g) against cumulative food intake (g) from
21 to 69 d of age, yielding, among other parameters, individual estimates of
asymptotic mature (virgin) body weight (A in g). A linear function by Parks
([16], p. 31) was fitted to relate individual data on cumulative food intake (g)
86 W.M. Rauw et al.
to age (d), yielding individual estimates of mature (virgin) daily food intake
(MFI in g/d). The methods for the estimation of A and MFI are extensively
described by Rauw et al. [22].
2.2. Lactating females
2.2.1. Body weight, food intake and litter traits
From farrowing to weaning (i.e., 3 wk in lactation), maternal body weight (g),
litter weight (g), litter size and food intake (g/d) per family (i.e., dam + litter)
were measured daily. From these data, for each family, pup weight (i.e., litter
weight divided by litter size) (g), maternal body weight gain (g/d), pup body
weight gain (g/d) and cumulative food intake (g) were calculated. In addition,
for each family, the day that the pups opened their eyes was recorded.
The pre-weaning mortality rate in families with non-standardised litters
was calculated as the “total number of pups that died from birth to weaning”
expressed as a percentage of the “total number of pups born”. The pre-weaning
mortality rate in families with standardised litters was calculated as the “total
number of pups that died from birth to weaning after standardisation”expressed
as a percentage of the “number of pups after standardisation”.
For each individual family,the maternal body weight during lactation relative
to mature virgin body weight was calculated as the maternal body weight (g)
divided by the individual estimate of asymptotic mature virgin body weight
(A in g) multiplied by 100%. Litter weight during lactation relative to mature
virgin maternal body weight was calculated as litter weight (g) divided by the
individual estimate of A (g) of the dam multiplied by 100%. The degree of
maturity of the pups was calculated, according to Taylor and Murray [30], as
the pup body weight (g) divided by the individual estimate of A (g) of the
dam multiplied by 100% (the degree of maturity is calculated as the body
weight divided by the mature body weight of the animal but since no data
were available to estimate individual mature body weight of the offspring, the
estimate of the asymptotic mature virgin body weight of the dam was used
as a scaling factor instead). Food intake during lactation relative to mature
virgin maternal food intake was calculated as food intake (g/d) divided by the
individual estimate of the mature virgin food intake (MFI in g/d) multiplied
by 100%.
2.2.2. Residual food intake
The equation used to estimate RFI (g/d) for each Cns-family was based on the
following multiple linear regression of food intake (g/d) on maternal metabolic
body weight (kg
0.75
), maternal body weight gain (g/d), pup metabolic body
Food resource allocation in lactating mice 87
weight (g), pup body weight gain (g/d) and litter size in control-line families
with non-standardised litters (Cns):
FC
i(Cns)
= b
0(Cns)
+
b
1(Cns)
× DBW
0.75
i(Cns)
+
b
2(Cns)
× DBWG
i(Cns)
+
b
3(Cns)
× PBW
i(Cns)
+
b
4(Cns)
× PBWG
i(Cns)
+
b
5(Cns)
× LS
i(Cns)
+ e
i(Cns)
, (1)
where:
FC
i(Cns)
= food consumption of the Cns-family i (g/d); DBW
0.75
i(Cns)
= metabolic
body weight of the dam of the Cns-family i (kg
0.75
); DBWG
i(Cns)
= body weight
gain of the dam of the Cns-family i (g/d); PBW
i(Cns)
= average metabolic body
weight of a pup of the Cns-family i (g); PBWG
i(Cns)
= average body weight
gain of a pup of the Cns-family i (g/d); LS
i(Cns)
= litter size of the Cns-
family i; b
0(Cns)
= Cns-line population intercept; b
1(Cns)
, b
2(Cns)
, b
3(Cns)
, b
4(Cns)
,
b
5(Cns)
, = Cns-line population partial regression coefficients and e
i(Cns)
, = the
error term, representing RFI of the Cns-family i (g/d). The partial regression
coefficients b
1(Cns)
and b
3(Cns)
represent the maintenance requirements per
metabolic body weight of the dam and of an average pup, respectively; b
2(Cns)
and b
4(Cns)
represent the requirements for growth of the dam and an average
pup, respectively; b
5(Cns)
extrapolates food requirements per average pup to
food requirements per litter. Equation (1) was fitted per day from farrowing to
3 wk in lactation.
Subsequently, RFI of C-line families with standardised litters (Cs) and all
S-line families (Sns and Ss) was estimated as:
RFI
i(Cs,Sns,Ss)
= FC
i(Cs,Sns,Ss)
−
ˆ
b
0(Cns)
+
ˆ
b
1(Cns)
× DBW
0.75
i(Cs,Sns,Ss)
+
ˆ
b
2(Cns)
× DBWG
i(Cs,Sns,Ss)
+
ˆ
b
3(Cns)
× PBW
i(Cs,Sns,Ss)
+
ˆ
b
4(Cns)
× PBWG
i(Cs,Sns,Ss)
+
ˆ
b
5(Cns)
× LS
i(Cs,Sns,Ss)
,
(2)
where RFI
i(Cs,Sns,Ss)
= residual food intake of the Cs-, Sns- and Ss-family i
(g/d); FC
i(Cs,Sns,Ss)
= food consumption of the Cs-, Sns- and Ss-family i (g/d);
DBW
0.75
i(Cs,Sns,Ss)
= metabolic body weight of the dam of the Cs-, Sns- and Ss-
family i (kg
0.75
); DBWG
i(Cs,Sns,Ss)
= body weight gain of the dam of the Cs-,
Sns- and Ss-family i (g/d); PBW
i(Cs,Sns,Ss)
= average metabolic body weight of
a pup of the Cs-, Sns- and Ss-family i (g); PBWG
i(Cs,Sns,Ss)
= average body
weight gain of a pup of the Cs-, Sns- and Ss-family i (g/d); LS
i(Cs,Sns,Ss)
= litter
size of the Cs-, Sns- and Ss-family i;
ˆ
b
0(Cns)
to
ˆ
b
5(Cns)
are the estimates of
b
0(Cns)
to b
5(Cns)
described in (1). This was done using the daily estimates of
measurements from farrowing to 3 wk in lactation.
88 W.M. Rauw et al.
The respiration rate (RES) as a function of body mass (BW) can usually be
expressed by means of the equation RES = aBW
b
. Riisgård [23] concluded that
young and fast growing stages usually show higher weight specific respiration
rates (b ∼ 1) than older and adult stages (b ∼
3
4
; [23]). In the present study,
the average metabolic body weight of a pup is estimated as PBW
1
, whereas the
metabolic body weight of individuals of 3 wk and older is estimated as BW
0.75
.
The experimental period was subsequently divided into a period from farrow-
ing to peak lactation (i.e., from 0 to 2 wk in lactation; F-PL), and a period from
peak lactation to weaning (i.e., from 2 to 3 wk in lactation; PL-W). Hammond
and Diamond [6] and Millican et al. [12] define peak lactation as the 15th
day after parturition. Hanrahan and Eisen [7] and Jara-Almonte and White [8]
observed that milk yield in mice peaked at about 13 d in lactation. In the present
study we chose a lactation peak of arbitrarily 14 days. Equation (1) was fitted
for the F-PL period and PL-W period from accumulated data on growth and
food intake per family over these periods. Maternal and pup metabolic body
weights of the F-PL and the PL-W periods were estimated as the average of
the daily metabolic body weights over these periods.
2.3. After weaning
2.3.1. Body weight, food intake and residual food intake
For each dam, from weaning of the offspring to 25 d after weaning, indi-
vidual body weight (g) and food consumption (g/5d) were measured every
5 d. Individual body weight gain (g/5d) and cumulative food intake (g) were
calculated from these data.
Residual food intake (g/5d) was estimated as in Section 2.1. Residual food
intake was estimated for each 5-d period from weaning to 25 d after weaning
and was subsequently expressed on a daily basis (g/d). Residual food intake
was subsequently estimated for the total “after weaning period” from weaning
to 25 d after weaning from accumulated data on growth and food intake over
this period. Metabolic body weight of the female was estimated as the average
of metabolic body weights for all 5-d periods from weaning to 25 d after
weaning.
2.4. Data analysis
The SAS
R
program was used for the statistical analysis of all traits [28].
The line differences for the individual traits were tested with the model:
Y
ij
= µ + L
i
+ e
ij
,
where µ = overall mean, L
i
= effect of line i (control, selection) and e
ij
= error
term of animal j of line i, e
ij
NID(0, σ
2
e
). Y
ij
denotes all the traits tested with this
Food resource allocation in lactating mice 89
model, all as measured on animal j of line i: RFI in the “growing period”, RFI in
the “adult period”, A and MFI in non-reproductive females; number of liveborn
pups, number of stillborn pups and pre-weaning mortality rate in lactating
females; RFI for each 5-d period from weaning to 25 d after weaning and RFI
in the “after weaning period”in dams after weaning. The pre-weaning mortality
rate was tested with this model for the line effect within each standardisation
level.
Differences between lines and levels of standardisation for the individual
traits were tested with the model:
Y
ijk
= µ + L
i
+ S
j
+ (LS)
ij
+ e
ijk
,
where µ = overall mean, L
i
= effect of line i (control, selection), S
j
= effect of
standardisation j (non-standardised, standardised), (LS)
ij
= interaction effect
of line i with standardisation j, and e
ijk
= error term of animal k of line i and
standardisation j, e
ijk
NID(0, σ
2
e
). Y
ijk
denotes all traits tested with this model,
all as measured on animal k of line i and standardisation j: daily maternal body
weight, litter weight, pup weight, food intake, maternal body weight relative
to A, litter weight relative to A, pup weight relative to A, food intake relative to
MFI, litter size at weaning, and the day that the pups open their eyes in lactating
females, and body weight and food intake for each 5-d period from weaning to
25 d after weaning in dams after weaning the offspring. Because of too many
repetitive measurements on the same animals, the level of significance has been
arbitrarily increased to 0.01 for the traits “daily maternal body weight”, “litter
weight”, “pup weight”, “food intake”, “maternal body weight relative to A”,
“litter weight relative to A”, “pup weight relative to A”and “food intake relative
to MFI”.
3. RESULTS
3.1. Non-reproductive females
3.1.1. Body weight, food intake and residual food intake
Average body weight and food intake in non-reproductive males and females
from 3 to 10 wk of age in the 92nd and 95th generations of the C- and S-line
have been extensively described by [22]. The present study (females only)
gave similar results.
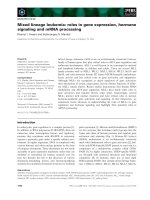
Average RFI per line in the “growing period” and the “adult period” are
presented in Figure 1. R
2
values and regression coefficients of the multiple
regressions per period are given in Table I. Residual food intake during the
“growing period”was not significantly different between the lines; in the “adult
period”, S-line females had a significantly higher RFI than C-line females
(P < 0.001).
90 W.M. Rauw et al.
-2,0
-1,5
-1,0
-0,5
0,0
0,5
1,0
1,5
C S C S Cns Cs Sns Ss Cns Cs Sns Ss C S
Residual food intake (g/d)
Growing
period
Adult
period
F-PL
PL-W After
weanin
g
40
Figure 1 - Rauw et al. (GSE00-33)
Figure 1. Average residual food intake (g/d) during the “growing period”, the “adult
period”, from farrowing to peak lactation (F-PL), from peak lactation to weaning
(PL-W) and during the “after weaning period”. C = control line; S = selection line;
ns = with non-standardised litters; s = with standardised litters.
Table I. Regression coefficients and coefficients of determination (R
2
) of multiple
regressions for estimating RFI during the “growing period”(GP) and the “adult period”
(AP), from farrowing to peak laction (F-PL) and from peak lactation to weaning (PL-W)
and during the “after weaning period” (AW).
Intercept DBW
0.75
DBWG PW PWG LS R
2
(%)
GP 12.441
∗
1 436.2
∗∗∗
0.65192
∗∗
74
AP 55.289
∗∗∗
1 030.1
∗∗∗
0.67850 29
F-PL −118.19
∗∗
889.17
∗
1.2092
∗
4.2461 13.169
∗∗∗
16.196
∗∗∗
91
PL-W −69.208
∗
319.26 0.29333 4.8216
∗∗
10.615
∗∗∗
11.032
∗∗∗
88
AW 10.768 1 574.6
∗∗∗
0.48483 45
∗
P < 0.05;
∗∗
P < 0.01;
∗∗∗
P < 0.001.
3.1.2. Asymptotic mature body weight and mature food intake
The R
2
values of the Parks’ [16] growth curves, relating body weight to
cumulative food intake, were in the range of 80% to nearly 100%; the R
2
values of individual linear regressions, relating cumulative food intake to age,
were all nearly 100%. Estimates (± standard error) of mature body weight (A
in g) were 28.8 ± 0.249 for C-line females and 38.7 ± 0.367 for S-line females.
Food resource allocation in lactating mice 91
A was significantly higher in the S-line than in the C-line (P < 0.001).
Estimates of mature food intake (MFI in g/d) were 4.66 ± 0.0306 for C-line
females and 6.14 ± 0.0480 for S-line females. MFI was significantly higher in
the S-line than in the C-line (P < 0.01).
3.2. Lactating females
3.2.1. Body weight, food intake and litter traits
Table II presents, per line, the average number of liveborn pups and the
average number of stillborn pups. Table II shows furthermore for each stand-
ardisation level in each line the average litter size at weaning, the average
pre-weaning mortality rate and the average day that the pups opened their eyes.
The number of liveborn pups was about twice as high in the S-line as in
the C-line. The number of stillborn pups was significantly higher in the S-line
than in the C-line. The pre-weaning mortality rate in non-standardised litters
was significantly higher in the S-line than in the C-line; in standardised litters
this was significantly higher in the C-line than in the S-line. The C-line pups
opened their eyes earlier than the S-line pups and the pups from the standardised
litters opened their eyes earlier than the pups from the non-standardised litters
(Tab. II).
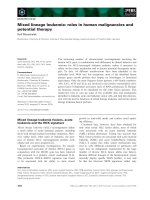
Figures 2a to 2d present for each standardisation level in each line average
maternal body weight (Fig. 2a), average litter weight (Fig. 2b), average pup
body weight (Fig. 2c) and average food intake (Fig. 2d) from farrowing to
weaning.
From farrowing to weaning, S-line dams were significantly heavier than C-
line dams (P < 0.001). Dams with non-standardised litters were heavier than
dams with standardised litters, but this was significant at 18 to 21 d in lactation
only (P < 0.01) (Fig. 2a).
From birth to weaning, S-line litters were heavier than C-line litters (P <
0.001). Non-standardised litters were heavier than standardised litters, but in
the C-line this was significant from birth to 1 d in lactation only (P < 0.01)
(Fig. 2b).
At birth, the average pup weight was similar for each line and each stand-
ardisation level. From 1 to 21 d in lactation, the pups of the Ss-families were
heavier than the pups of the Sns-, Cns- and Cs-families (P < 0.001). From 2
to 21 d in lactation, the pups of the Cs-families were heavier than the pups of
the Cns-families (P < 0.01) and from 4 to 20 d in lactation, the pups of the
Cs-families were heavier than the pups of the Sns-families (P < 0.01). The
pups of Sns-families were heavier than the pups of the Cns-families at 21 d in
lactation only (P < 0.01) (Fig. 2c).
Food intake was considerably increased during lactation. From farrowing to
weaning, S-line families ate more than C-line families (P < 0.001). Families
92 W.M. Rauw et al.
Table II. Means and standard errors of the number of liveborn pups and number of stillborn pups, per line, and litter size at weaning,
pre-weaning mortality rate, and the day that the pups open their eyes, for each standardisation level in each line.
C-line S-line
Cns Cs Sns Ss
Number liveborn pups 10.3 ± 0.262 20.2
∗∗∗
± 0.327
Number stillborn pups 0.287 ± 0.0748 0.667
∗
± 0.135
Litter size at weaning 8.52
a
± 0.475 6.00
b
± 0.377 13.5
c
± 0.484 7.60
a
± 0.178
Pre-weaning mortality (%) 18.1 ± 3.94 21.3 ± 4.83 35.6 ± 2.76
∗∗∗1
4.95 ± 2.23
∗∗2
Eyes open (d in lact) 13.2
a
± 0.0940 12.8
b
± 0.0961 13.9
c
± 0.0782 13.2
a
± 0.0784
Within a row, means with distinct superscript letters differ (P < 0.05).
1
Sns compared with Cns;
2
Ss compared with Cs;
∗
P < 0.05;
∗∗
P < 0.01;
∗∗∗
P < 0.001;
C = control line;
S = selection line;
ns = with non-standardised litters;
s = with standardised litters.
Food resource allocation in lactating mice 93
30
35
40
45
50
55
60
65
0 3 6 9 12 15 18 21
Body weight (g)
121
126
131
136
141
146
151
156
161
0 3 6 9 12 15 18 21
(Body weight/ A ) x 1 0 0 %
0
25
50
75
100
125
150
175
0 3 6 9 12 15 18 21
L itter weight (g)
20
60
100
140
180
220
260
300
340
380
420
0 3 6 9 12 15 18 21
(L itter weight/ A ) x 1 0 0 %
0
2
4
6
8
10
12
14
16
18
0 3 6 9 12 15 18 21
P u p weight (g)
0
10
20
30
40
50
0 3 6 9 12 15 18 21
(P u p weight/ A ) x 1 0 0 %
0
5
10
15
20
25
30
35
40
0 3 6 9 12 15 18 21
Days in lactation
F ood in ta k e (g)
100
200
300
400
500
600
700
0 3 6 9 12 15 18 21
Days in lactation
(F ood in ta k e/ M F I ) x 1 0 0 %
0
200
400
600
800
0 3 6 9 12 15 18 21
Cns Cs Sns Ss
a
e
b
f
c g
d
h
41
Figure 2 - Rauw et al. (GSE00-33)
Figure 2. Average maternal body weight (3a), average litter weight (3b), average pup
body weight (3c), average food intake (3d), average maternal body weight relative to A
(3e), average litter weight relative to A (3f), average pup body weight relative to A
(3g) and average food intake relative to MFI (3h) for each standardisation level in each
line from farrowing/birth to weaning. A = asymptotic mature virgin body weight (g);
MFI = mature virgin food intake (g); C = control line; S = selection line; ns = with
non-standardised litters; s = with standardised litters.
94 W.M. Rauw et al.
with non-standardised litters ate more than families with standardised litters; in
the C-line this was significant at 19 to 20 d in lactation only (P < 0.01) and in
the S-line this was significant at 3 to 10 and 19 to 21 d in lactation (P < 0.01)
(Fig. 2d).
Figures 2e to 2h present for each standardisation level in each line, from
farrowing to weaning, average maternal body weight relative to asymptotic
mature virgin body weight (A) (Fig. 2e), average litter weight relative to A
(Fig. 2f), average pup body weight relative to A (Fig. 2g), and average food
intake relative to mature virgin food intake (MFI; Fig. 2h).
From 7 d in lactation to weaning, S-line dams were significantly heavier
relative to A than C-line dams (P < 0.05). From 20 to 21 d in lactation (P <
0.05) dams with non-standardised litters were significantly heavier relative to A
than dams with standardised litters (Fig. 2e).
From birth to weaning, the litters of the S-line were heavier relative to A
than litters of the C-line (P < 0.001) and non-standardised litters were heavier
relative to A than standardised litters (P < 0.001) (Fig. 2f).
From 2 d in lactation to weaning, pups of standardised litters had a higher
degree of maturity than pups of non-standardised litters (P < 0.001). From
farrowing to weaning, pups of the Cns-families had a higher degree of maturity
than pups of the Sns-families (P < 0.001). From birth to 1 d in lactation,
the degree of maturity of pups of the Cs-families was higher than the degree
of maturity of pups of the Ss-families (P < 0.01); afterwards the degree of
maturity was similar (Fig. 2g).
From farrowing to weaning, the S-line families had a higher food intake
relative to MFI than the C-line families; this was significant at 1, 5, and 8 to
21 d in lactation (P < 0.01). Families with non-standardised litters generally
had a higher food intake relative to MFI than families with standardised litters
but this was significant for 3, 4, 7 to 9, and 19 to 21 d in lactation only
(P < 0.01) (Fig. 2h).
Table III presentsphenotypic correlations between several litter traits. Larger
litters had more stillborn pups and the pups were less mature at birth. The degree
of maturity at birth was negatively correlated with the number of stillborn pups
and pre-weaning mortality rate. The day that the pups opened their eyes was
later in animals that were less mature at peak lactation (Tab. III).
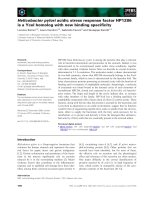
3.2.2. Residual food intake
Figure 3 shows the average daily RFI for each standardisation level in each
line from farrowing to weaning. The R
2
values of the multiple regressions
according to equation (3) per day were in the range of 58% to 91%. Since
the equation used to estimate RFI was based on all Cns-families, RFI from
farrowing to weaning in Cns-families was 0. In addition, Figure 3 shows that
there was not an explicit trend present for RFI during lactation, as seen for
Food resource allocation in lactating mice 95
Table III. Phenotypic correlations between number of stillborn pups and total number
of pups born, and between degree of maturity and total number of pups born, number of
stillborn pups, pre-weaning mortality rate and the day that the pups opened their eyes.
Total number Number Pre-weaning Eyes open
pups born stillborn pups mortality rate (d)
Number stillborn pups 0.36
d∗∗∗
Degree of maturity −0.56
ad∗∗∗
−0.23
ad∗∗
−0.35
acd∗∗∗
−0.30
be∗∗∗
a
degree of maturity at birth;
b
degree of maturity at peak lactation;
c
non-
standardised litters only;
d
adjusted for line;
e
adjusted for line and standardisation;
∗∗
P < 0.01;
∗∗∗
P < 0.001.
-6
-4
-2
0
2
4
6
1 2 3 4 5 6 7 8 9 10 11 12 13 14 15 16 17 18 19 20 21 5 10 15 20 25
Residual food intake (g/d)
Cns Cs Sns Ss C S
F-PL PL-W After weaning
d in lactation d after weaning
Figure 3. Average daily residual food intake (g/d) from farrowing to peak lactation
(F-PL), from peak lactation to weaning (PL-W) and during the “after weaning period”.
C = control line; S = selection line; ns = with non-standardised litters; s = with
standardised litters.
RFI in non-reproductive females. Generally, RFI was around and above 0 for
Cs-families, both above and below 0 for Sns-families, and around and above 0
for Ss-families.
96 W.M. Rauw et al.
The average RFI for each standardisation level in each line in the F-PL
period and the PL-W period are presented in Figure 1. R
2
values and regression
coefficients of the multiple regressions according to equation (3) per period are
given in Table I. During the F-PL period, Sns-families had lower RFI than
C-line and Ss-families (P < 0.001). During the PL-W period, Sns-families
had lower RFI than Cs- (P < 0.05) and Ss-families (P < 0.001).
3.3. After weaning
3.3.1. Body weight and food intake
From weaning to 25 d after weaning, within each group, body weights and
food intakes were very similar for all 5-d periods. Average body weights were
37.4 ± 0.431 for Cns-females, 37.0 ± 0.398 for Cs-females, 50.4 ± 0.521 for
Sns-females and 48.7±0.400 for Ss-females. S-line females were significantly
heavier than C-line females. Sns-females were heavier than Ss-females (P <
0.01).
Average food intakes (± standard error) were 29.0 ± 0.361 for Cns-females,
28.4±0.289 for Cs-females, 38.9±0.427 for Sns-females and 37.5±0.624 for
Ss-females. S-line females had a significantly higher food intake than C-line
females. Sns-females had higher food intake than Ss-females (P < 0.05).
After weaning there was a decreasing trend in food intake, but not in body
weight.
3.3.2. Residual food intake
Figure 2 shows for each line the average RFI for each 5-d period from
weaning to 25 d after weaning (g/d). R
2
values of the multiple regressions per
day were in the range of 25% to 61%. Residual food intake was higher in
S-line females than in C-line females (P < 0.01). Since the equation used to
estimate RFI was based on all C-line females, the average RFI in the C-line
female population was 0.
Average RFI per line for the “after weaning period”is presented in Figure 1.
The R
2
value and regression coefficients for the “after weaning period” are
given in Table I. Residual food intake during the “after weaning period” was
significantly higher in S-line females than in C-line females (P < 0.001).
3.4. Correlation between residual food intake measurements
in different periods
Table IV presents phenotypic correlations between RFI in the “growing
period”, the “adult period”, the F-PL period, the PL-W period and the “after
weaning period”. Residual food intake in the “growing period” was highly
correlated with RFI in the “adult period”. Residual food intake from farrowing
Food resource allocation in lactating mice 97
Table IV. Phenotypic correlations between residual food intake in the “growing
period”, the “adult period”, the period from farrowing to peak lactation (F-PL), the
period from peak lactation to weaning (PL-W) and the “after weaning period”.
Growing period
a
Adult period
a
F-PL
b
PL-W
b
Adult period
a
0.63
∗∗∗
F-PL
b
0.09 0.12
PL-W
b
0.13 0.10 0.51
∗∗∗
After weaning
a
0.38
∗∗∗
0.58
∗∗∗
0.32
∗∗∗
0.22
∗∗
∗∗
P < 0.01;
∗∗∗
P < 0.001.
a
adjusted for line;
b
adjusted for line and
standardisation.
to peak lactation was highly correlated with RFI from peak lactation to weaning.
Residual food intake in the non-reproductive period (i.e., the growing and the
adult period) was not correlated with RFI during lactation (i.e., the F-PL and
the PL-W period). Residual food intake after weaning was correlated both with
RFI in the non-reproductive period and with RFI during lactation (Tab. IV).
4. DISCUSSION
Estimates of RFI during growth and at maturity support earlier observations
presented by Rauw et al. [22]: RFI in adult non-reproductive S-line females is
significantly higher than RFI in C-line females. These buffer resources may be
intended for the highly increased resource demanding processes of pregnancy
and lactation.
Energy intake increases greatly during lactation to acquire sufficient energy
for maternal maintenance and milk production. Food intake in mice has been
shown to rise to 3.4 [6] and 4 [12] times the virgin value by peak lactation. In
the present study, dams of both lines reached an intake level of around 4 times
their virgin mature food intake (MFI). Although Sns-dams supported at peak
lactation litters which were about 58% larger and, relative to A, 13% heavier
than Cns-litters, food intake relative to MFI was only 10% higher than in Cns-
dams. Around peak lactation, the pups open their eyes, and the further increase
in food intake can be attributed to both the dam and the offspring. Food intake
relative to MFI decreased after weaning and the difference between the Sns-
and Cns-dams disappeared.
Food intake varied significantly with litter size in the study of Hammond
and Diamond [6]: Intake of dams with 14 pups (achieved by cross-fostering)
was 25% higher than that of dams with five pups (natural size or achieved by
culling). The mean rate of food intake was slightly but significantly higher
in cotton rats with 6-pup litters (natural size) compared with dams with 3-pup
98 W.M. Rauw et al.
litters (achieved by culling) in the study of Rogowitz and McClure [25]. In
the present study, Cns-dams and Cs-dams had similar food intakes up to peak
lactation, while Sns-dams ate significantly more than Ss-dams during half of
this period. Since the difference in litter size between standardised and non-
standardised litters was about four times larger in the S-line than in the C-line,
this may have been due to the larger effect of standardisation on litter size in
the S-line. After weaning, Sns-dams still ate more than Ss-dams.
At peak lactation, extensive losses of body fat and protein reserves may
occur [26]. Also lactating sows and dairy cows lose body weight during the
lactation period, even under ad libitum feeding conditions [13,29]. In the
study of Hammond and Diamond [6], body mass in lactating mice increased by
40% from the virgin state through peak lactation and then did not change after
weaning. Body weights in lactating females of the present study increased up to
peak lactation and subsequently decreased up to weaning. From peak lactation
on, the pups start to eat solid food in addition to milk, which will progressively
replace the contribution of milk to offspring growth. In spite of the larger litter
size and higher relative litter mass, average body weight of Sns-dams increased
to a similar level at peak lactation compared to Cns-dams, i.e., over 150% of
their asymptotic mature estimates (A); values decreased from peak lactation to
weaning to 138% in Cns-dams and 145% in Sns-dams. Within the first 5 d
after weaning, body weights relative to A decreased further to about 127% in
both lines and thereafter did not change.
Body mass and the rate of body weight loss did not vary with litter size in
the study of Rogowitz and McClure [25]. In the present study, body weight
increased significantly more in dams with non-standardised litters than in dams
with standardised litters. After weaning, Sns-dams were still heavier than
Ss-dams, but Cns- and Cs-dams had similar body weights.
Since benefits to offspring have an associated maternal cost, trade-offs and
conflicts may occur during lactation when a limit to food assimilation and
sustained metabolic rate can be assumed to exist [24,33]. If the dam allocates
too much of her resources to her offspring, she may lose weight excessively,
increase her risk of mortality and compromise future reproductive potential;
an insufficient rate of energy export to young may decrease postnatal growth
or cause offspring mortality [24]. The observed negative relationship between
litter size and pup weight and increase in pre-weaning mortality rates with
larger litters ([6,25] and the present study) indicates that a dam is to some
extent able to protect her own stores at the expense of the growing young. A
higher investment of resources in lactation and the processes that support this
will result in a lower RFI as defined in this study.
Whereas daily RFI in the non-reproductive period follows a clear trend [22],
the course of RFI during lactation was rather capricious. A likely explanation
may be that it took considerably more time to weigh all dams and litters during
Food resource allocation in lactating mice 99
lactation than to weigh the females in the non-reproductive state; the whole
process took many hours. The dams and litters were weighed in the same
systematic order, but the older the pups became, the more time it took to weigh
them all (they behaved like popcorn when the cage was opened); the daily
scheme was therefore quite irregular. Hammond and Diamond [6] showed
that food intake in lactating mice close to peak lactation rose in the afternoon,
declined after midnight and was minimal at midday. Also, feeding times of the
offspring may differ. When litter size exceeds the number of teats (about 9 in
the C-line and 10 in the S-line), dams have been shown to solve this discrepancy
by dividing the pups into two piles and nursing the piles alternately ([6] and the
present study, data not presented). Therefore, during lactation, RFI estimated
from accumulated data may be a better representation of the resource situation.
From farrowing to peak lactation, RFI can be attributed to the dam only,
while from peak lactation to weaning, RFI can be attributed to both the dam
and the pups. Residual food intake from farrowing to peak lactation and from
peak lactation to weaning was lower in Sns-families than in Cns-families. This
suggests that S-line dams supporting litters of the size attained by selection
allocate more resources to the processes that support milk production and have
consequently fewer resources left to respond to other demands. After weaning,
RFI is significantly higher in S-line females than in C-line females, suggesting
that, after weaning, the dams are able to restore the negative resource situation.
From birth to peak lactation and from peak lactation to weaning, RFI was
lower in dams with non-standardised litters than in dams with standardised
litters, though this was significant only in the S-line. Although litters of Ss-
line dams were standardised to relatively smaller litters than litters of Cs-line
dams, RFI was not significantly different between Ss- and Cs-dams, as might
have been expected; from peak lactation to weaning, RFI in Ss-families was
higher than RFI in Cs-families, but this was not significant. After weaning,
no differences were found between dams with formerly standardised and non-
standardised litters, nor when the equation used to estimate RFI for the “after
weaning period” was based on the Cns-population (results not presented).
Archer et al. [2] found a moderate genetic correlation between post-weaning
and mature RFI in non-reproductive mice and suggested that animals possess
an “intrinsic efficiency” that operates across different degrees of maturity and
physiological states: the positive correlation results from basic physiological
processes that are common to both the growing animal and the mature animal,
such as the absorption of nutrients. Lactation activates processes that are
specific to the physiological state and the (genetic) variation in these processes
is unlikely to influence the efficiency of a non-reproductive animal [2]. The
results of the present study show that the phenotypic correlations between RFI
in the non-reproductive period (i.e., the growing and the adult period) and
RFI during lactation (i.e., the F-PL and the PL-W period) are very close to
100 W.M. Rauw et al.
zero. This suggests that, during lactation, the variation in milk production and
the processes that support this dilute the importance of the processes that are
common to non-reproductive and lactating animals as a source of variation in
RFI. Indeed, the maternal body has to adapt greatly to the process of lactation.
Apart from an increase in mammary size, lactating mice and rats experience
an increase in liver, heart, lung and gut size to accommodate the large increase
in food demands [6,12,17,27,35]. In dairy cows it was observed that cattle
with higher milk production had higher maintenance requirements independent
of body mass; a large proportion of this variation was explained by critical
organ mass, especially the liver [5]. Phenotypic correlations between RFI
after weaning and RFI in the non-reproductive period are positive and highly
significant, suggesting that common processes are again an important source
of variation in RFI. Also phenotypic correlations between RFI after weaning
and RFI during lactation are positive and highly significant, indicating that
processes that operate during lactation are still influencing the resource balance
after weaning. This is plausible, since given the aforementioned adaptations
of the body to the process of lactation, it will take time to return to the non-
reproductive state.
Since tissues with high protein or high lipid levels have different mainten-
ance requirements, line and standardisation differences in body composition
may a explain part of the variation in RFI [20]. Protein turnover requires a
high amount of resources while body lipid is relatively metabolically inactive.
Therefore, animals with relatively high lipid content will have lower RFI than
animals with relatively high protein content. Differences in body composition
may influence RFI during lactation when, e.g., the extent to which body reserves
are mobilised is different between the lines and standardisation levels, and
furthermore largely independent of the traits which are included as covariates
in the equation that estimates RFI. Furthermore, milk composition differs
between different stages of lactation [9] and may depend on litter size [25].
Since Sns-dams have to support a genetically highly increased litter size, these
animals may mobilise more body reserves and their milk may be of a different
composition than milk produced by Cns-dams, and the same may be true
for different levels of standardisation. However, the degree of body tissue
mobilisation may be positively correlated with litter size, which is included
as a covariate in the equation. Forthcoming research will investigate body
composition in lactating females of the C- and S-lines.
Rogowitz [24] observed that individual pups in large litters of field-caught
cotton rats (6 pups) grew at 71.2% the rate of pups in small litters (3 pups). In
the present study, pup development in Sns-pups was about 25% lower than in
Cns-pups at all times. Interestingly, the degree of maturity of Cs-pups and Ss-
pups was similar from 2 d in lactation on, which may indicate that the maximum
relative growth rate is similar in both lines and about 18% and 53% higher than
Food resource allocation in lactating mice 101
Cns- and Sns-pups, respectively. This is supported by the observation that both
food intake and maternal body weight up to peak lactation are lower in dams
with standardised litters than in dams with non-standardised litters: a further
increase is physically possible, but not used. Degree of maturity is related to
the day that the pups open their eyes, which is later in relatively smaller pups.
In the study of Rogowitz [24] small litters were obtained by culling while
large litters were of natural size. In the present study as well, small litters in
the C-line were usually obtained by culling. This also implies that pups born in
litters of a “natural size” (i.e., non-standardised and non-selected) were under
the influence of “maternal effects”, i.e., limited by the maternal energy export
in milk [4]. A good example of such effects can be found in pigs: piglet growth
rates during lactation remain, at best, half of which can be achieved under
artificial rearing [18,34]. Although litter size in pigs has been increased by
selection, this effect seems to result mainly from the relatively high fat content
and low protein content in sow milk. Piglets are born with a relatively low
body lipid content and under natural conditions, priority is given to restore
their condition over improving their growth rate [18]. From birth to 2 wk of
age, protein content of piglets increased from 12% to 15%, while fat content
increased from 1.3% to 13% [13]. Litter size may increase to the level where
dams can provide energy to offspring that allows for “sufficient” offspring
development. The present study shows that litter size in the S-line has been
increased beyond this point: although S-line females with non-standardised
litters allocate a particularly high amount of resources towards the processes
of lactation, this was insufficient to provide offspring with an adequate amount
of resources, resulting in reduced pup development and increased pre-weaning
mortality rates.
To ensure that lactation proceeds successfully there are co-ordinated adapt-
ations in the metabolism (homeorhesis) that reallocate available nutrients
towards the mammary gland away from tissues that are not essential to lacta-
tion [3]. It is generally observed that during lactation, self-maintenance of the
dam takes precedence over the maintenance of individual offspring, resulting
in the death of offspring under stressful conditions whereas the dam usually
survives and subsequently reproduces [24]. However, single trait selection
for high litter size may result in the situation where dams “disproportionally”
allocate many resources to this trait that is selected for, leaving less resources
to respond to other demands. In that situation, it is most likely that resources
will be reallocated firstly from traits that are not defined in the breeding goal,
because they are given no importance [19].
The results of the present study suggest that dams selected for high litter size
indeed allocated considerably more resources to the maintenance of offspring
than non-selected dams. However, Sns-dams seemed to be able to restore
the negative resource situation after weaning. Because of increased food
102 W.M. Rauw et al.
demands to support genetically increased litter sizes and reduced appetites and
lower body fat reserves at parturition due to genetically increased leanness,
the negative resource situation during lactation is generally more severe in
commercial sows, than in the mice of the present study. When a higher
proportion of resources isallocated to lactation, less resources are left torespond
adequately to other demands, putting the animal more at risk to behavioural,
physiological and immunological problems [3,19]. Indeed, commercial sows
have frequent reproduction problems associated with excessive mobilisation
of body reserves, such as prolonged weaning to oestrus intervals [31]. Future
research may investigate whether lactating S-line females are indeed more
susceptible to stress and diseases and how the negative energy and nutrient
balance during lactation will affect lifetime reproduction potential. Mouse
models, such as those described in the present experiment, can be used to
anticipate and prevent undesirable side effects of selection in the long term.
ACKNOWLEDGEMENTS
This study was supported by a grant from the Norwegian Research Council,
project number 114258/111. Kari Kjus is gratefully acknowledged for carrying
out the Norwegian mouse selection experiment and her help in providing and
maintaining the mice of this project. We thank January Weiner, Hans Ulrik
Riisgård and Christofer Knight for sending us their papers on request. This
manuscript was written at the Instituto Nacional de Investigación y Tecnología
Agraria y Alimentaria (INIA) in Madrid, Spain, which is thanked for providing
the resources.
REFERENCES
[1] Archer J.A., Pitchford W.S., Phenotypic variation in residual food intake of mice
at different ages and its relationship with efficiency of growth, maintenance and
body composition, Anim. Sci. 63 (1996) 149–157.
[2] Archer J.A., Pitchford W.S., Hughes T.E., Parnell P.F., Genetic and phenotypic
relationships between food intake, growth, efficiency and body composition of
mice post weaning and at maturity, Anim. Sci. 67 (1998) 171–182.
[3] Bauman D.E., Currie W.B., Partitioning of nutrients during pregnancy and lacta-
tion: a review of mechanisms involving homeostasis and homeorhesis, J. Dairy
Sci. 63 (1980) 1514–1529.
[4] Falconer D.S., Mackay T.F.C., Introduction to quantitative genetics, 4th edn.,
Longman Group Ltd, Essex, 1996.
[5] Ferrell C.L., Jenkins T.G., Cow type and the nutritional environment: nutritional
aspects, J. Anim. Sci. 61 (1985) 725.
[6] Hammond K.A., Diamond J.D., An experimental test for a ceiling on sustained
metabolic rate in lactating mice, Phys. Zool. 65 (1992) 952–977.
Food resource allocation in lactating mice 103
[7] Hanrahan J.P., Eisen E.J., A lactation curve for mice, Lab. Anim. Care 20 (1970)
101–104.
[8] Jara-Almonte M., White J.M., Milk production in laboratory mice, J. Dairy Sci.
55 (1972) 1502–1505.
[9] Knight C.H., Maltz E., Docherty A.H., Milk yield and composition in mice:
effects of litter size and lactation number, Comp. Biochem. Physiol. 84A (1986)
127–133.
[10] Luiting P., Genetic variation of energy partitioning in laying hens: causes of
variation in residual feed consumption, World’s Poultry Sci. J. 46 (1990) 133–
152.
[11] Luiting P., Vangen O., Rauw W.M., Knap P.W., Beilharz R.G., Physiological
consequences of selection for growth. 48th Annual Meeting of the EAAP, Vienna,
1997.
[12] Millican P.E., Vernon R.G., Pain V.M., Protein metabolism in the mouse during
pregnancy and lactation, Biochem. J. 248 (1987) 251–257.
[13] Mullan B.P., Close W.H., Cole D.J.A., Predicting nutrient responses of the
lactating sow, in: Cole D.J.A., Haresign W., Garnsworthy P.C., (Eds.), Recent
developments in pig nutrition 2, Nottingham University Press, 1993, pp. 323–346.
[14] Nielsen M.K., Freking B.A., Jones L.D., Nelson S.M., Vorderstrasse T.L., Hussey
B.A., Divergent selection for heat loss in mice: II. Correlated responses in
food intake, body mass, body composition, and number born through fifteen
generations, J. Anim. Sci. 75 (1997) 1469–1476.
[15] Oftedal O., 1984, Milk composition, milk yield and energy output at peak
lactation: a comparative review, in: Peaker M., Vernon R.G., Knight C.H.,
(Eds.), Physiological strategies in lactation, Symp. Zool. Soc. Lond. 51 (1984)
33–85.
[16] Parks J.R., A theory of feeding and growth of animals, Springer-Verlag, Berlin,
1982.
[17] Pine A.P., Jessop N.S., Oldham J.D., Maternal protein reserves and their influence
on lactational performance in rats, Br. J. Nutr. 71 (1994) 13–27.
[18] Pluske J.R., Dong G.Z., Factors influencing the utilisation of colostrum and milk,
in: Verstegen M.W.A., Moughan P.J., Schrama J.W., (Eds.), The lactating sow,
Wageningen Pers, 1998, pp. 45–70.
[19] Rauw W.M., Kanis E., Noordhuizen-Stassen E.N., Grommers F.J., Undesirable
side-effects of selection for high production efficiency in farm animals: a review,
Livest. Prod. Sci. 56 (1998) 15–33.
[20] Rauw W.M., Knap P.W., Verstegen M.W.A., Luiting P., Body composition in
non-reproductive adult males and females in a long-term selection experiment
for litter size in mice, J. Anim. Breed. Genet., in press.
[21] Rauw W.M., Luiting P., Bakken M., Schuurman T., de Veer C.J.M., Vangen
O., Behavioural differences in non-reproductive adult females in a long-term
selection experiment for litter size in mice, Appl. Anim. Beh. Sci. 66 (2000)
249–262.
[22] Rauw W.M., Luiting P., Verstegen M.W.A., Vangen O., Knap P.W., Differences
in food resource allocation in a long-term selection experiment for litter size in
mice, 2. Developmental trends in body weight against food intake, Anim. Sci. 71
(2000) 39–47.
104 W.M. Rauw et al.
[23] Riisgård H.U., No foundation of a “3/4 power scaling law” for respiration in
biology, Ecol. Lett. 1 (1998) 71–73.
[24] Rogowitz G.L., Trade-offs in energy allocation during lactation, Amer. Zool. 36
(1996) 197–204.
[25] Rogowitz G.L., McClure P.A., Energy export and offspring growth during lacta-
tion in Cotton Rats (Sigmodon hispidus), Funct. Ecol. 9 (1995) 143–150.
[26] Sainz R.D., Calvert C.C., Baldwin R.L., Relationships among dietary protein,
food intake and changes in body and tissue composition of lactating rats, J. Nutr.
116 (1986) 1529–1539.
[27] Speakman J.R., McQueenie J., Limits to sustained metabolic rate: the link
between food intake, basal metabolic rate, and morphology in reproducing mice,
Mus Musculus, Phys. Zool. 69 (1996) 746–769.
[28] Statistical Analysis Systems Institute, SAS
R
user’s guide: statistics, version 5,
Statistical Analysis Systems Institute Inc., Cary, NC, 1985.
[29] Tamminga S., Luteijn P.A., Meijer R.G.M., Changes in composition and energy
content of liveweight loss in dairy cows with time after parturition, Livest. Prod.
Sci. 52 (1997) 31–38.
[30] Taylor St C.S., Murray J.I., Genetic aspects of mammalian growth and survival
in relation to body size, Academic Press, London, 1987.
[31] Ten Napel J., Genetic aspects of intervals from weaning to estrus in swine. Ph.D.
Thesis Wageningen Agricultural University, Wageningen, 1996.
[32] Vangen O., Results from 40 generations of divergent selection for litter size in
mice, Livest. Prod. Sci. 37 (1993) 197–211.
[33] Weiner J., Physiological limits to sustainable energy budgets in birds and mam-
mals: ecological implications, Tree 7 (1992) 384–388.
[34] Whittemore C.T., Elements of pig science, Longman Group, Essex, 1980.
[35] Williamson D.H., Integration of metabolism in tissues of the lactating rat, FEBS
Lett. 117 (1980) 93–105.
To access this journal online:
www.edpsciences.org