Báo cáo sinh học: " Genetic structure of the Marseilles cat population: is there really a strong founder effect ?" potx
Bạn đang xem bản rút gọn của tài liệu. Xem và tải ngay bản đầy đủ của tài liệu tại đây (821.5 KB, 15 trang )
Original
article
Genetic
structure
of
the
Marseilles
cat
population:
is
there
really
a
strong
founder
effect ?
M
Ruiz-Garcia
1
1
Instituto
de
genetica,
Ureiversidad
de
Los
Andes,
calle
18
Carrera
1E,
Bogota
DC,
Colombia;
C
igeem
avd
virgen
Montserrat,
207,
se!to
primera,
Barcelona,
080!6,
Spain
(Received
4
February
1992;
accepted
21
December
1993)
Summary -
In
a
previous
study
on
the
Marseilles
cat
population
it
was
concluded
that
the
small
cat
colonies
were
subject
to
a
strong
founder
effect.
A
more
detailed
study
with
the
Gg
T
and
Fg
T
(genetic
diversity)
statistics
and
with
a
spatial
autocorrelation
analysis
shows
that,
for
the
a
(non-agouti)
and
tb
(blotched)
genes,
there
is
neither
significant
heterogeneity
nor
spatial
autocorrelation.
This
is
probably
due
to
an
appreciable
gene
flow
throughout
Marseilles
(although
a
uniform
selection
pressure
in
favour
of
these
alleles
cannot
be
totally
ruled
out).
The
0
(orange)
allele
does
not
show
spatial
autocorrelation
either,
but
it
does
show
significant
heterogeneity,
which
could
have
been
caused
by
the
late
introduction
of
this
allele
into
the
population,
coming
from
populations
with
low
0
frequencies
in
a
sporadic
and
irregular
way
(although
the
influence
of diversifying
selection
cannot
be
completely
ruled
out).
Only
this
allele
0
might
be
influenced
by
a
strong
founder
effect
as
stated
previously.
However,
the
a
and
tb
data
do
not
support
the
hypothesis
of
a
strong
founder
effect
in
these
cat
colonies.
cat
/
genetic
structure
/
founder
effect
/
gene
flow
/
spatial
autocorrelation
Résumé -
Structure
génétique
de
la
population
des
chats
marseillais :
y
a-t-il
réellement
un
fort
effet
fondateur ?
Dans
une
étude
précédente
sur
la
population
des
chats
marseillais,
il
avait
été
conclu
que
les
petites
colonies
de
chats
étaient
soumises
à
un
fort
effet
fondateur.
Une
étude
plus
détaillée,
à
l’aide
des
statistiques
G
ST
et
F
ST
(diversité
génétique)
et
d’une
analyse
d’autocorrélation
spatiale,
a
montré
que,
pour
les
allèles
a
(non
agouti)
et
tb
(tigré),
il
n’existe
ni
hétérogénéité
significative
ni
autocorrélation
spatiale.
Ceci
est
probablement
dû
au
flux
important
de
gènes
dans
toute
l’étendue
de
Marseille
(bien
qu’on
ne
puisse
pas
totalement
écarter
une
pression
uniforme
de
sélection
en faveur
de
ces
allèles).
L’allèle
0
(orange)
ne
montre
pas
non
plus
d’autocorrélation
spatiale,
mais
il
présente
une
hétérogénéité
significative,
qui
pourrait
bien
avoir
été
produite
par
l’arrivée
*
Correspondence
and
reprints.
tardive
de
cet
allèle
dans
la
population,
provenant
de
manière
sporadique
et
irrégulière
de
populations
à
faibles
fréquences
de
0
(quoique
l’influence
d’une
sélection
diversifccatrice
ne
puisse
pas
être
complètement
exclue).
Seul
ce
gène
0
pourrait
être
soumis
à
une
forte
in
ft
uence
de
l’effet
fondateur.
Cependant
les
données
relatives
aux
allèles
a
et
tb
b
ne
confirment
pas
l’influence
d’un
important
effet
fondateur
dans
ces
colonies
de
chats
marseillais.
chat
/
structure
génétique
/
effet
fondateur
/
flux
génique
/
autocorrélation
spatiale
INTRODUCTION
Dreux
(1975)
analysed
the
genetic
composition
of
the
Marseilles
cat
population.
Having
studied
the
distribution
of
the
allele
frequencies
for
3
coat
colour
genes
(0
(orange),
a
(non-agouti), t
b
(blotched))
among
a
series
of
small
cat
colonies
throughout
this
French
town,
he
concluded
with
the
following
statements:
&dquo;
A
certain
number
of
small
semi-wild
cat
colonies
have
been
observed
and
it
is
found
that
they
are
relatively
isolated
from
one
another;
the
great
differences
between
the
gene
frequencies
among
the
colonies
are
attributed
to
the
influence
of
a
strong
founder
effect &dquo;;
&dquo;
The
gene
frequencies
are
very
variable
and
certainly
show
an
important
influence
of
founder
effect
at
the
moment
of
constitution
of
these
isolated
colonies &dquo;.
However,
a
more
detailed
study
of
the
distribution of
these
gene
frequencies
among
Marseilles
cat
colonies,
through
some
genetic
differentiation
statistics
and
by
means
of
a
spatial
autocorrelation
analysis
applied
to
these
3
genes
and
to
the
expected
heterozygosity,
seems
to
show
that
the
Dreux
(1975)
conclusion
is
not
entirely
justified.
Moreover,
this
study
gives
us
an
interesting
opportunity
to
study
the
genetic
structure
of
the
cat
colonies
within
a
town
at
a
microgeographical
level,
which
will
no
doubt
reflect
the
interaction
of
the
size
of
the
population,
the
gene
flow,
the
reproductive
systems
and
the
human
interferences
in
this
species
(Eanes
and
Koehn,
1978;
Gaines
and
Whittam,
1980;
Patton
and
Feder,
1981;
Chesser,
1983;
Gyllensten,
1985;
Kennedy
et
al,
1987).
MATERIALS
AND
METHODS
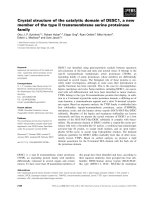
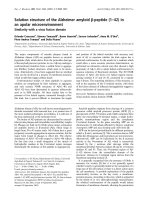
Dreux
(1975)
showed
a
map
of
Marseilles
(fig
1),
where
he
situated
9
cat
colonies
studied
from
a
genetic
viewpoint.
The
sizes
of
these
small
colonies
range
from
8
to
72
cats
with
a
mean
of
19.88
cats.
Together
with
this
map,
the
gene
frequencies
for
0,
a
and t
b
alleles
in
these
cat
colonies
are
summarized.
Genic
diversity
analysis
A
genic
diversity
analysis
(Nei,
1973,
1975)
has
been
applied
to
the
3
alleles
above
to
observe
whether
the
contribution
to
the
genic
diversity
for
each
of
these
alleles
is
the
same,
or
whether
they
show
a
differential
genic
diversity.
For
this,
the
following
statistics
were
calculated:
G
ST
(gene
differentiation
between
populations
relative
the
gene
diversity
in
the
total
population),
R
ST
(interpopulation
gene
diversity
relative
to
the
intrapopulation
gene
diversity),
Dm
(absolute
interpopulational
gene
diversity).
The
Wright’s
F
ST
(1951,
1965)
has
also
been
calculated.
If
there
are
only
2
alleles
at
a
locus,
G
ST
is
identical
to
F
ST
(Nei,
1973)
as
is
the
case
in
this
study.
I
have
calculated
FS
T
=
Fs
T
-
(1/2N
t)
(Workman
and
Niswander,
1970),
which
is
the
estimate
of
genetic
heterogeneity
between
populations
corrected
for
sampling
error,
where
Nt
is
the
total
sample
size.
Fh
is
directly
related
to
the
chi-squared
statistic
X2=
2N
t
FS
T
(K -
1)
with
(l! -
1)(s -
1)
degrees
of
freedom,
where
s
is
the
number
of
populations
studied
and
k
is
the
number
of
alleles
for
the
locus.
Moreover,
if
sample
sizes
are
of
different
magnitudes,
the
following
expression
may
be
used:
x2
=
[E2N
i
p2 - pE2Ni ! pi!/p(1- p)
(Snedecor
and
Irwin,
1933),
where
Ni
and
pi
are
the
sample
size
and
the
gene
frequency
in
population
i,
and
p
is
the
mean
gene
frequency
over
all
colonies.
To
determine
the
possible
differences
introduced
by
the
genetic
heterogeneity
between
the
3
loci
studied,
a
Fisher-Snedecor F
test
(Workman
and
Niswander,
1970)
was
carried
out.
Theoretical
gene
flow
The
gene
flow
(Nm,
the
average
number
of
immigrants
entering
an
average
deme
in
one
generation)
was
calculated
following
the
expression:
Nm
=
[(1/ F!T) -
1]/4
(Wright,
1943,
1965)
This
equality
is
an
estimate
based
on an
infinite
island
model,
where
the
effects
of
migration
and
genetic
drift
are
balanced
in
a
subdivided
population.
These
results
are
similar
to
those
produced
by
a
2-dimensional
stepping-stone
model
(Crow
and
Aoki,
1984)
although they
underestimate
Nm
for
a
one-dimensional
stepping-stone
model
(Slatkin,
1985a;
Trexler,
1988).
I
have
also
obtained
estimates
of
gene
flow
for
an
n-dimensional
island
model
(Nm a
=
[(11G
ST
) - 1]14oz,
where
a
=
[n/{n -1}j
2
and
n
is
the
number
of
populations
analyzed
(Slatkin,
1985b)).
Study
of
the
expected
heterozygosity
An
important
concept
to
determine
the
possible
existence
of
founder
effect
is
the
study
of
the
mean
expected
heterozygosity
of
the
3
loci
throughout
the
diverse
cat
colonies
(Nei,
1978).
To
determine
the
possible
differences
between
the
mean
values
of
heterozygosity
among
all
compared
pairs
of
colonies,
the
Student’s
t-
test
was
used.
To
determine
if
there
are
significant
differences
among
all
expected
heterozygosity
means
as
a
single
set,
2
statistical
methods
have
been
applied:
an
Anova
and
a
Kruskal-Wallis
H
test
with
corrections
(non-parametric
variance
analysis) .
Phenetic
analyses
To
study
the
genetic
relationships
between
these
cat
colonies,
2
genetic
distances
were
employed
with
clearly
differentiated
properties
(Prevosti
(1974)
distance
and
Cavalli-Sforza
and
Edwards
(1967)
distance
(Chord
distance)).
With
the
genetic
distance
matrices
obtained
using
these
2
methods,
I
have
obtained
dendrograms
with
the
UPGMA
algorithm
(Sneath
and
Sokal,
1973).
From
the
dendrogram
it
can
be
seen,
as
a
preliminary
step,
whether
the
neighbouring
colonies
are
clustered
randomly.
Principal
coordinates
analysis
To
know
the
possible
genetic
relationships
among
these
cat
colonies
in
the
space,
a
principal
coordinates
analysis
(PCA)
(Gower,
1966)
was
carried
out
with
the
Prevosti
genetic
distance
matrix.
A
minimum
length
spanning
tree
(MST)
was
superimposed
to
detect
local
distortions
between
pairs
of
populations
(Rohlf,
1970).
Mantel
test
An
analysis
of
correlation
matrices
(with
linear,
power,
exponential
and
logarithmic
curves)
between
geographic
distances
(in
metres)
and
genetic
distances
between
the
cat
colonies
was
computed
with
the
normalized
Mantel
test
(Mantel,
1967).
A
Monte-Carlo
simulation,
with
2
000
random
permutations
of
these
matrices
was
applied
to
determine
the
significance
of
these
results.
Spatial
autocorrelation
analysis
A
technique
that
offers
more
potential
to
understand
the
possible
spatial
relation-
ships
among
these
cat
colonies
is
spatial
autocorrelation
analysis
(SAA).
An
SAA
tests
whether
the
observed
value
of
a
gene
frequency
at
one
locality
is
dependent
on
values
of
the
same
variable
at
neighbouring
localities
(Sokal
and
Oden,
1978a).
Positive
results
of
SAA
indicate
that
gene
frequencies
at
neighbouring
colonies
are
similar,
while
negative
SAA
results
show
marked
differences
between
adjacent
pairs
when
we
study
the
meaning
of
SAA
at
the
first
distance
class
(Sokal
and
Menozzi,
1982).
In
the
present
work,
the
Moran’s
1 index
(Moran,
1950)
was
used.
To
carry
out
this
spatial
analysis
2
different
distance
classes
(DCs)
were
used.
In
the
first
analysis,
I
defined
3
DCs,
where
each
particular
DC
was
chosen
in
order
to
allocate
an
equal
number
of
colony
pairs
to
each
DC.
In
the
second
analysis,
I
defined
5
DC
with
a
constant
size.
Both
analyses
indicate
whether
a
change
in
some
spatial
parameter
can
affect
the
results.
These
indices
were
plotted
against
the
geographic
distances
to
produce
correlograms.
For
these
spatial
analyses,
the
0,
a,
tb
alleles
and
the
expected
heterozygosity
were
used.
A
matrix
of
binary
connection
was
used
in
the
way
described
by
Sokal
and
Oden
(1978b)
(with
human
blood
groups
in
Eire)
and
Trexler
(1988).
This
was
due
to
the
fact
that
we
do
not
know
the
history
of
migrations
among
these
cat
colonies
and
because
we
consider
that
the
gene
flow
be-
tween
the
colonies
(caused
by
the
relationship
between
man
and
cat)
could
happen
in
any
direction
and
possibly
not
depending
on
the
proximity
of
the
colonies.
For
a
single
autocorrelation
coefficient
for
all
the
colonies
studied
simultaneously,
point
pairs
were
weighted
as
the
inverse
square
of
their
separation
distance.
To
determine
statistical
significance
for
autocorrelation
coefficients,
the
Bonferroni
procedure
was
used
(Oden,
1984).
The
application
of G
ST
and
F
sT
statistics
needs
the
designation
of
populations,
subpopulation
or
colony,
which
is
often
arbitrary
(Ennos,
1985;
Bos
et
al,
1986).
In
addition,
the
border
between
these
units
or
the
size
of
the
units
often
makes
the
correct
application
of
the
cited
statistics
difficult.
In
contrast,
SAA
does
not
need
a
definition
of
subpopulation
or
colony,
and
is
independent
of
the
spatial
scale
level
of
the
structure
we
want
to
analyse.
RESULTS
Genetic
difFerentiation
and
gene
flow
The
genetic
differentiation
and
gene
flow
statistics
for
the
three
0,
a,
t6
alleles
are
summarized
in
table
I.
As
we
can
see,
the
intercolony
gene
differentiation
exhibited
by
a
(FS
T
=
0.0183)
and t
b
(FS’
T
=
0.048)
is
small.
In
other
words,
one
colony
has
on
average
98.2
and
95.2%
of
the
total
genic
diversity
found
in
the
total
cat
population
of
Marseilles
for
the
a
and t
b
alleles,
respectively.
The
a
and t
b
allele
frequencies
do
not
show
significant
heterogeneity
between
the
Marseilles
cat
colonies.
In
contrast,
0
shows
a
more
important
gene
frequency
differentiation
than
the
a
and t
b
alleles
(Fh
=
0.2015).
Moreover,
this
0
gene
frequency
differentiation
is
significant
(X2
=
72.14,
8
df,
P
<
0.001).
As
the
F-tests
demonstrate, t
b
does
not
exhibit
significantly
more
genetic
heterogeneity
than
a
(F[6
,
S]
=
1.27
NS),
but
O
does
exhibit
significantly
more
heterogeneity
than
a
and t
b
(F!g,B!
=
11.93,
P
<
0.001
and
F
[8
,
6]
=
9.34,
P
<
0.01,
respectively).
The
mean
value
obtained
for
the
3
alleles
shows
a
significant
FS
T
value
(see
table
I),
but
if
the
0
allele
is
excluded,
the
mean
value
for
the
a
and t
b
alleles
(FS
T
=
0.033)
is
clearly
not
significant.
For
the
estimations
of
the
gene
flow,
I
found
a
similar
situation.
I
obtained
high
theoretical
estimates
of
Nm
for
the
a
and
tl’
alleles
(Nm’
=
13.4
and
4.9,
respectively),
but
the
Nm
value
for
0
(A!m’
=
0.99)
was
very
small.
So,
as
a
first
step,
we
can
observe
how
the
0
gene
might
seem
strongly
affected
by
an
important
founder
effect,
but
the
homogeneity
of
the
a
and t
6
genes
does
not
support
this
hypothesis
at
all.
Expected
heterozygosity
Table
II
shows
the
expected
heterozygosity
for
the
9
colonies
analyzed.
The
comparisons
of
the
expected
mean
heterozygosity
between
all
pairs
of
colonies
using
the
Student’s
t-test
are
summarized
in
table
III.
Only
one
comparison
out
of
the
36
possible
combinations
reached
significance.
The
Anova
applied
to
the
expected
mean
heterozygosity
set
did
not
show
significant
heterogeneity
(table
IV),
as
confirmed
by
the
Kruskal-Wallis
H-test
(H’
=
4.82,
8
df,
0.70
<
P
<
0.80).
Thus,
the
founder
effect
does
not
seem
to
strongly
influence
the
present
results
for
heterozygosity.
All
the
colonies
show
similar
levels
of
heterozygosity,
even
those
with
very
small
samples
(n
=
19.88
cats
for
the
9
colonies
and n
=
13.77
cats,
excluding
the E
colony
(n
=
72
cats)).
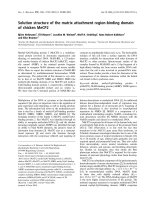
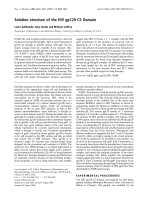
Phenetic
and
principal
coordinates
analyses
A
first
graphic
approximation
on
the
spatial
genetic
relationships
between
the
Marseilles
cat
colonies
using
a
UPGMA
phenetic
analysis
and
with
2
different
genetic
distances
does
not
exhibit
any
special
trend
to
cluster
the
neighbouring
colonies
(fig
2).
Nevertheless,
the
UPGMA
phenetic
analyses
with
the
Prevosti
and
the
Cavalli-Sforza
and
Edwards
distances
show
certain
different
relationships
between
the
colonies.
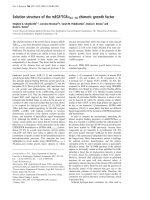
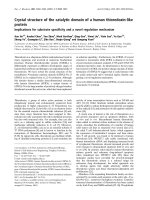
The
PCA
with
the
graphic
matrix
MST
superimposed
also
shows
the
same
tendency
(fig
3).
This
means
that
there
seems
to
exist
a
stronger
tendency
for
neighbouring
colonies
to
group
together.
This
occurs
for
both
genetic
distances
used.
Mantel
test
Other
approaches
to
understand
the
spatial
relationships
among
these
colonies
were
the
correlations
obtained
between
geographic
and
genetic
distance
matrices
using
the
Mantel
test.
There
are
no
significant
associations
between
both
types
of
matrices
in
either
case.
In
the
case
of
the
Prevosti
distance,
all
correlations
are
negative.
For
this
distance,
the
geographic
separation
negatively
explains
between
4.38
and
8.23%
of the
genetic
heterogeneity
found
(according
to
the
different
mathematical
models).
For
the
Cavalli-Sforza
and
Edwards
distance,
the
correlations
are
positive,
but
not
significant
(between
3.35
and
9.12%
of
the
genetic
heterogeneity).
Spatial
autocorrelation
analysis
The
most
powerful
methodological
technique
used
to
explain
the
spatial
relation-
ships
between
these
colonies
is
the
spatial
autocorrelation.
The
application
of
the
Moran’s
index
as
a
single
coefficient
for
all
colonies
simultaneously
for
the
3
alleles
studied
did
not
show
any
si!nificant
spatial
structure
(0,
1 =
-0.114,
P
=
0.486;
a,
I =
-0.150,
P
=
0.466
;
t ,
I =
-0.071,
P
=
0.448).
Using
3
distance
classes
as
defined
in
table
V,
neither
the
allele
nor
the
expected
heterozygosity
showed
sig-
nificant
individual
spatial
autocorrelation
coefficients.
The
4
overall
correlograms
for
0,
a
and t
b
alleles
and
for
the
expected
heterozygosity
were
also
non-significant.
The
average
correlogram
for
the
3
genes
studied
did
not
show
any
spatial
trend
(—0.259,
-0.008,
-0.125).
With
5
distance
classes,
only
one
coefficient
out
of
the
20
1
values
was
significant.
The
4
overall
correlograms
for
0,
a,
tb
and
expected
heterozygosity
were
not
significant.
The
average
correlogram
for
the
3
alleles
did
not
show
any
spatial
trend
(-0.208,
-0.293,
0.222,
-0.233,
-0.012).
Globally,
spatial
autocorrelation
does
not
seem
to
exist
for
any
of
these
3
alleles
or
for
the
expected
heterozygosity.
In
a
large
number
of
correlograms
there
seems
to
exist
a
disposi-
tion
to
’crazy
quilt’
resembling
that
generated
by
Royaltey
et
al
(1975).
Most
of
the
correlograms
show
random
fluctuations
between
positive
and
negative
values
without
a
clear
tendency
to
offer
significantly
more
positive
I
values
at
a
short
dis-
tance
compared
with
those
observed
at
longer
distance.
This
poor
autocorrelation
suggests
that
there
is
a
poor
genetic
substructuring
of
the
Marseilles
cat
colonies
for
the
3
gene
frequencies
studied
and
for
the
expected
heterozygosity.
DISCUSSION
Possible
causes
of
genetic
heterogeneity
and
spatial
patterns
Sokal
and
Oden
(1978b)
showed
that
2
different
concepts
must
be
distinguished
to
explain
the
differentiation
of
a
genetic
variable
distributed
over
a
geographic
area:
statistical
heterogeneity
and
geographic
patterns.
Statistical
heterogeneity
can
be
studied
by
different
mathematical
techniques
(Anova,
homogeneity
x-square
test,
etc)
while
the
geographic
patterns
can
be
analyzed
using
a
spatial
autocorrelation
analysis.
Statistical
heterogeneity
and
patterns
are
mutually
independent
of
each
other.
For
this
reason,
we
can
analyze
the
3
possible
and
logical
combinations
(Sokal
and
Oden,
1978b):
A
Significant
heterogeneity
and
significant
spatial
patterns:
1)
migration
between
neighbouring
populations;
2)
founder
effects
with
the
establishment
of
new
demes
by
relatively
close
founders;
3)
selective
agents
in
response
to
environmental
gradients
or
patterned
patches;
and
4)
systematic
migration.
B
Significant
heterogeneity
and
absence
of
spatial
patterns:
1)
genetic
drift;
2)
founder
effects
with
the
founders
coming
with
near
equiprobability
from
entire
array
of
colonies
over
the
range
of
the
population;
and
3)
selective
agents
and/or
unpatterned
patches.
C
Homogeneity
of means
and
absence
of pattern
(population’s
poor
genetic
sub-
structuring):
1)
high
gene
flow
at
random
within
the
entire
study
area;
2)
uniform
selective
pressures
within
entire
study
area
(Ayala
et
al,
1971;
Hebert,
1974).
With
these
premises
and
taking
into
account
the
global
results
for
the
3
genes
studied,
we
would
find
ourselves
in
case
B.
Therefore,
we
would
have
3
possible
causes
to
explain
the
gene
distribution
we
have
observed.
The
second
cause
would
be
in
accordance
with
Dreux’s
(1975)
statements,
ie
frequent
founder
effects
with
the
same
probability
over
the
range
of
the
population.
In
other
studies,
this
explanation
has
also
been
useful
to
explain
the
genetic
structure
of
other
organisms
(Sokal
and
Oden,
1978b;
Waser,
1987;
Lopez-Alonso
and
Pascual-Requera,
1989).
However,
if
we
analyze
each
of
these
genes
separately
and
the
expected
average
heterozygosity,
we
observe
that
the
situation
changes.
The
a
and t
b
genes
show
neither
significant
statistical
heterogeneity
nor
spatial
autocorrelation.
The
same
happens
with
the
expected
mean
heterozygosity.
In
contrast,
the
0
gene
shows
significant
statistical
heterogeneity,
but
no
spatial
autocorrelation.
Thus,
the
individualized
analysis
seems
to
dismiss
this
second
cause
as
the
global
explaining
factor
of
the
allele
distributions
observed.
The
genetic
drift
and
the
founder
effects
with
the
same
demographic
parameters
affect
the
3
genes
studied
in
the
same
way
and
should
have
the
same
effect
on
the
whole
genome.
At
least
for
the
a
and t
b
alleles
and
for
expected
mean
heterozygosity,
case
C
above
seems
to
be
more
acceptable.
So,
the
2
foreground
agents
would
be:
a)
intense
gene
flow
without
following
fixed
routes;
and
b)
uniform
selective
pressure.
It
is
difficult
to
distinguish
which
of
the
2
hypotheses
is
more
likely.
Moreover,
the
2
hypotheses
are
not
mutually
exclusive
and
could
be
acting
simultaneously.
An
attempt
to
explain
these
observations
from
a
selective
point
of
view
could
be
as
follows.
It
has
previously
been
postulated
that
the
a
and t
b
genes
benefit
from
the
urban
effect
(Todd,
1969, 1977, 1978;
Clark,
1975,
1976).
This
selective
cause
could
have
induced
the
homogeneity
of
means
found
and
the
absence
of
autocorrelation
for
those
2
alleles
in
the
cat
colonies
of
Marseilles.
On
a
small
scale,
the
heterotic
effect
(Bulmer,
1973;
Bush
et
al,
1987)
for
these
genes
should
promote
spatial
homogeneity.
However,
there
are
examples
of
other
towns
where
the
urban
selective
effect
might
be
at
least
as
intense
as
in
Marseilles
(eg,
Barcelona,
Palma
in
Majorca,
Murcia
in
Spain,
Rimini
in
Italy,
Buenos
Aires
in
Argentina,
and
Jerusalem
and
Tel-Aviv
in
Israel;
Ruiz-Garcia,
1991,
1993ab)
and
where
the
a
and,
especially,
the t
b
alleles
show
a
strong
significant
statistical
heterogeneity.
These
examples
make
us
doubt
the
existence
of
a
uniform
selective
pressure
within
the
urban
environment
or
of
a
heterotic
effect
(or,
at
least,
other
evolutionary
agents
are
superimposed
on
them).
It
would
be
strange
if
this
happened
in
the
city
of
Marseilles
and
not
in
other
intensely
urban
towns.
From
a
selective
point
of
view,
the
0
gene
could
be
submitted
to
some
diversifying
selective
agent
over
heterogeneous
patches
unpatterned
in
the
space.
Nevertheless,
there
does
not
seem
to
be
sufficient
microenvironmental
differences
(at
least
they
are
very
difficult
to
imagine
in
this
case)
between
these
different
areas
of
Marseilles,
which
may
have
some
selective
influence
on
this
gene.
All
this
taken
into
account,
a
neutral
point
of
view
could
be
taken
to
explain
the
different
genetic
heterogeneity
shown
for
each
gene.
It
is
possible
that
each
gene
studied
in
this
work
was
introduced
into
Marseilles
at
different
historical
moments
and
with
different
ecological
and
demographic
parameters
(effective
population
sizes
(Ne),
migration
rates
per
generation
(m),
number
of
colonists
(K),
and
extinction
rates
per
generation
(eo)).
Moreover,
these
different
migrant
genes
could
have
been
introduced
following
different
models.
For
instance,
Slatkin
(1977)
defined
4
population
structures
in
terms
of
the
source
of
the
migrant
individuals
and
in
terms
of
the
way
in
which
new
colonies
were
established.
The
2
models
of
the
source
of
migrant
individuals
are:
a)
Model
I.
Migrants
move
from
an
external
source
with
a
constant
gene
frequency
to
an
infinite
number
of
local
colonies;
b)
Model
II.
Migrants
are
drawn
at
random
from
within
a
finite
array
of
subdivided
populations.
For
these
2
models,
there
are
2
different
ways
in
which
colonists
might
be
chosen
to
found
new
colonies:
a)
migrant
pool,
where
new
colonists
(K)
are
a
random
sample
from
the
entire
population;
and,
b)
propagule
pool,
where
the
new
colonies
are
founded
by
choosing
colonists
at
random
from
a
single
randomly
chosen
colony.
If
the
3
genes
studied
were
introduced
at
different
historical
moments
with
different
demographic
parameters,
different
sources
of
migrants
and
different
ways
in
which
colonists
were
chosen,
we
should
expect
different
F
ST
values
for
each
gene
studied
(Wade,
and
McCauley,
1988).
With
all
this
in
mind,
0
is
the
unique
allele
that
could
be
influenced
by
a
strong
founder
effect
in
the
Marseilles
cat
population.
Nevertheless,
the
a
and
tb
data
do
not
support
this
strong
influence.
Only
in
the
case
that
the
0
allele
is
neutral
and
that
the
a
and t
b
alleles
are
under
uniform
selective
pressure,
should
the
Dreux
(1975)
conclusion
(importance
of
the
founder
effect)
be
certain.
Gene
flow
and
heterozygosity
Trexler
(1988)
showed
that
if
Nm
>
1
(in
an
infinite
island
model)
or
Nm
>
4
(in
a
stepping-stone
model),
the
gene
flow
is
enough
to
attenuate
the
genetic
dif-
ferentiation
between
populations
balanced
for
migration
and
gene
drift.
According
to
the
infinite
island
model,
if
1
<
Nm
<
0.5,
the
genetic
differentiation
between
populations.
is
smaLL
but
important
in
a
stepping-stone. model: 4f::-Nm
< 4.5,
the
populations
are
largely
unconnected
under
any
model
of
gene
flow.
The
Nm
values
for
a
and t
b
(Nm’
=
13.4
and
4.9,
respectively)
are
higher
than
1
(and
even
4).
On
the
contrary,
for
the
0
gene
(Nm’
=
0.99)
the
gene
flow
would
be
considerably
smaller.
As
we
can
observe
from
the
absence
of
spatial
autocorrelation
and
from
the
absence
of
significant
correlation
between
genetic
and
geographic
distances
with
the
Mantel
test,
we
find
a
situation
very
similar
to
an
island
model
where
the
effect
of
geographical
distance
seems
non-significant
(Cavalli-Sforza
and
Bodmer,
1981).
The
analysis
of
the
expected
mean
heterozygosity
seems
to
confirm
this
model.
The
absence
of
autocorrelation
and
the
homogeneity
of
the
means
confirm
that
stochastic
processes
are
not
extraordinarily
important
as
evolutionary
agents
among
the
cat
colonies
studied
in
Marseilles
(even
though
the
average
size
of
the
samples
is
only
19
individuals).
The
same
has
been
observed
for
other
animals
(Grant,
1980;
Kennedy
et
al,
1987)
but
they
differ
from
what
has
been
observed
in
other
mammals
(Patton,
1972;
Penney
and
Zimmerman,
1976).
As
can
be
observed,
the
average
levels
of
heterozygosity
of
these
3
genes
are
high,
and
as
has
been
proved
by
other
studies,
high
gene
flow
maintains
high
levels
of
heterozygosity
(Wheeler
and
Guries,
1982;
Waples,
1987;
Ruiz-Garcia,
1991)
confirming
the
probable
great
importance
of
gene
flow
in
this
model.
Even
though
the
sizes
of
the
colonies
could
be
small,
the
fact
that
cat
litters
are
strongly
dispersed,
spreading
out
from
their
original
colony
(either
as
a
consequence
of
the
intrinsic
characteristics
of
their
reproductive
behaviour,
or
direct
human
action)
and
the
subsequent
integration
into
other
reproduction
units
favours
the
maintenance
of
high
mean
heterozygosity
values.
The
same
was
determined
for
Thomomys
bottae
(Patton
and
Feder,
1981).
Nevertheless,
we
do
not
know
whether
the
gene
flow
occurs
at
the
time
of
colony
formation
or
between
colonies
that
have
been
present
for
a
long
time.
ACKNOWLEDGMENTS
For
different
reasons,
my
infinite
thanks
to
P
Dreux
(Paris,
France),
A
Sanjuan
(Vigo,
Spain),
AT
Lloyd
(Dublin,
Ireland),
KK
Klein
(Minnesota,
USA),
R
Robinson
(London,
UK)
and
A
Prevosti
(Barcelona,
Spain).
My
thanks
also
to
BH
Zimmermann
(Michigan,
USA)
for
help
with
the
English
syntax
of
this
manuscript,
and,
especially
to
Diana
Alvarez
(Bogota
DC,
Colombia)
for
her valuable
assistance.
REFERENCES
Ayala
FJ,
Powell
JR,
Dobzhansky
T
(1971)
Polymorphism
in
continental
and
island
populations
of
Drosophila
williston,i.
Proc
Nat
Acad
Sci
USA
68,
2480-2483
Bos
M,
Harmens
H,
Vrieling
K
(1986)
Gene
flow
in
plantago.
I.
Gene
flow
and
neighbor-
hood
size
in
P
lanceolata.
Heredity
56,
43-54
Bulmer
MG
(1973)
Geographical
uniformity
of
protein
polymorphisms.
Nature
(Lond)
241,
199-200
Bush
RM,
Smouse
PE,
Ledig
FT
(1987)
The
fitness
consequences
of
multiple-locus
heterozygosity:
the
relationship
between
heterozygosity
and
growth
rate
in
pitch
pine
(Pinus
rigida
Mill).
Evolution
41, 787-798
Cavalli-Sforza
LL,
Bodmer
WF
(1981)
Gen!tica
de
las
poblaciones
hurrcanas.
942
p
Ediciones
Omega,
Barcelona
Cav!lli-Sforza’LL!
Edwards
AWF’
(1967)
Phylogenetic
analysis:
models
and
estimation
procedures.
Evolution
21,
550-570
Chesser
RK
(1983)
Genetic
variability
within
and
among
populations
of
the
black-tailed
prairie
dog.
Evolution
37,
320-331
Clark
JM
(1975)
The
effects
of
selection
and
human
preference
on
coat
colour
gene
frequencies
in
urban
cats.
Heredity
35,
195-210
Clark
JM
(1976)
Variations
in
coat
colour
gene
frequencies
and
selection
in
cats
of
Scotland.
Genetica
46,
401-412
Crow
JF,
Aoki
K
(1984)
Group
selection
for
a
polygenic
behavioural
trait:
estimating
the
degree
of
population
subdivision.
Proc
Natl
Acad
Sci
USA
81,
6073-6077
Dreux
P
(1975)
G6n6tique
de
population
des
chats
domestiques
de
Marseille
(Bouches-
du-Rh6ne,
France).
Ann
G6n6t
Sel
Anim
7,
23-33
Eanes
WF,
Koehn
RK
(1978)
An
analysis
of
genetic
structure
in
the
monarch
butterfly,
Danaus
plevipus
L.
Evolution
32,
784-797
Ennos
RA
(1985)
The
mating
system
and
genetic
structure
in
a
perennial
grass,
Cynosurus
cristatus
L.
Heredity
55,
121-126
Gaines
MS,
Whittam
TS
(1980)
Genetic
changes
in
fluctuating
vole
populations:
selective
vs
non-selective
forces.
Genetics
96,
767-778
Gower
JC
(1966)
Some
distance
proporties
of
latent
root
and
vector
methods
used
in
multivariate
analysis.
Biometrika
53,
325-338
Grant
V
(1980)
Gene
flow
and
the
homogeneity
of species
populations.
Biol
Zb199,
157-169
Gyllensten
U
(1985)
Temporal
allozyme
frequency
changes
in
density
fluctuating
popula-
tions
of
willow
grouse
(Lagopus
lagopus
L).
Evolution
39,
115-121
Hebert
PDN
(1974)
Enzyme
variability
in
natural
populations
of
Daphnia
magna.
I.
Po-
pulation
structure
in
East
Anglia.
Evolution
28,
546-556
Kennedy
PK,
Kennedy
ML,
Beck
ML
(1987)
Genetic
variability
in
white-tailed
deer
(Odocoileus
virginianus)
and
its
relationship
to
environmental
parameters
and
herd
origin
(Cervidae).
Genetica
74,
189-201
Lopez-Alonso
D,
Pascual-Reguera
L
(1989)
Population
structure
and
pattern
of
geographic
variation
in
Muscari
comosum
along
its
range
of
distribution.
Genetica
78,
39-49
Mantel
NA
(1967)
The
detection
of
disease
clustering
and
a
generalized
regression
approach.
Cancer
Res
27,
209-220
Moran
PAP
(1950)
Notes
on
continuous
stochastic
phenomena.
Biometrika
37,
17-23
Nei
M
(1973)
Analysis
of
gene
diversity
in
subdivided
populations.
Proc
Natl
Acad
Sci
USA
70,
3321-3323
Nei
M
(1975)
Molecular
Population
Genetics
and
Evolution.
North-Holland
Press,
Ams-
terdam
Nei
M
(1978)
Estimation
of
average
heterozygosity
and
genetic
distance
from
a
small
number
of
individuals.
Genetics
89,
583-590
Oden
N
(1984)
Assessing
the
significance
of
a
spatial
correlogram.
Geogr
Anal
16,
1-16
Patton
JL
(1972)
Patterns
of
geographic
variation
in
karyotype
in
the
gophers.
Thomomys
bottae
(Eydoux
and
Gervais).
Evolution
26,
574-586
Patton
JL,
Feder
JH
(1981)
Microspatial
genetic
heterogeneity
in
gophers:
non-
random
breeding
and
drift.
Evolution
35,
912-920
Penney
DF,
Zimmerman
EG
(1976)
Genic
divergence
and
local
population
differentiation
by
random
drift
in
the
gopher
genus
Geomys.
Evolution
30,
473-483
Prevosti
A
(1974)
La
distancia
gen6tica
entre
poblaciones.
Miscellanea
Alcob6.
Publica-
cions
de
l’Universitat
de
Barcelona,
109-118
Rohlf
FJ
(1970)
Adaptive
hierarchical
clustering
schemes.
Systematic
Zool 19,
58-82
Royaltey
HH,
Astrachan
E,
Sokal
RR
(1975)
Tests
for
patterns
in
geographic
variation.
Geogr
Anal
7,
369-395
Ruiz-Garcia
M
(1991)
M6s
sobre
la
Gen6tica
de
poblaciones
de
Felis
catus
en
la
costa
MediterrAnea
Espanola:
Un
analisis
de
la
Estructura
Gen6tica
de
las
poblaciones
naturales
de
gatos.
Evol
Biol
5,
227-283
Ruiz-Garcia
M
(1993a)
Analysis
of
the
evolution
and
genetic
diversity
within
and
between
Balearic
and
Iberian
cat
populations.
J
Hered
84,
173-180
Ruiz-Garcia
M
(1993b)
Genetic
structure
and
Evolution
of
different
cat
populations
(Felis
catus)
in
Spain,
Italy,
Argentina
and
Israel
at
microgeographical
level:
history
and
time
and/or
ecological
and
social
factors
and/or
current
population
size?
Evol
Biol
7
(in
press)
Slatkin
M
(1977)
Gene
flow
and
genetic
drift
in
a
species
subject
to
frequent
local
extinction.
Theor
Popul
Biol
12,
253-262
Slatkin
M
(1985a)
Rare
alleles
as
indicators
of
gene
flow.
Evolution
39,
53-65
Slatkin
M
(1985b)
Gene
flow
in
natural
populations.
Ann
Rev
Ecol
Syst
16,
393-430
Sneath
PH,
Sokal
RR
(1973)
Nvmerical
ta!onomy.
Ed
Freeman,
San
Francisco
Snedecor
G,
Irwin
MR
(1933)
On
the
chi-square
test
for
homogeneity.
lowa
State
J
Science
8,
75-81
Sokal
RR,
Menozzi
P
(1982)
Spatial
autocorrelation
of
HLA
frequencies
in
Europe
support
demic
diffusion
of
early
farmers.
Am
Nat
119, 1-17
Sokal
RR,
Oden
NL
(1978a)
Spatial
autocorrelation
in
biology.
I.
Methodology.
Biol
J
Linn
Soc
10,
199-228
Sokal
RR,
Oden
NL
(1978b)
Spatial
autocorrelation
in
biology.
II.
Some
biological
implications
and
four
applications
of
evolutionary
and
ecological
interest.
Biol
J
Linn
Soc
10,
229-249
Todd
NB
(1969)
Cat
gene
frequencies
in
Chicago
and
other
populations
of
the
United
States.
J
Hered
60,
273-277
Todd
NB
(1977)
Cats
and
Commerce.
Sci
Amer
237,
100-107
Todd
NB
(7978)
An
ecological,
behavioural
genetic
model
for
the
domestication
of
the
cat.
Carnivore
1,
52-60
Trexler
JC
(1988)
Hierarchical
organization
of
genetic
variation
in
the
Sailfin
Molly.
Poecilia
latipinna
(Pisces:
Poeciliidae).
Evolution
42,
1006-1017
Wade
MJ,
McCauley
DE
(1988)
Extinction
and
recolonization:
their
effects
on
the
genetic
differentiation
of
local
populations.
Evolution
42,
995-1005
Waples
RS
(1987)
A
multispecies
approach
to
the
analysis
of
gene
flow
in
marine
shore
fishes.
Evolution
41,
385-400
Waser
NM
(1987)
Spatial
genetic
heterogeneity
in
a
population
of
the
montane
perennial
plant
Delphinium
nelsonii.
Heredity
58,
249-256
Wheeler
NC,
Guries
RP
(1982)
Population
structure,
genic
diversity
and
morphological
differentiation
in
Pinus
contorta
Dougl.
Can
J
For
P
595-606
Workman
PL,
Niswander
JD
(1970)
Population
studies
on
south
western
Indian
tribes.
II.
Local
genetic
differentiation
in
the
Papago.
Amer
J
Hum
Genet
22,
24-49
Wright
S
(1943)
Isolation
by
distance.
Genetics
28,
114-138
Wright
S
(1951)
The
genetical
structure
of
populations.
Ann
Eugen
15,
323-354
Wright
S
(1965)
The
interpretation
of
population
structure
by
F-statistics
with
special
regard
to
systems
of
mating.
Evolution
19,
395-420