Báo cáo sinh học: "Population analysis of a purebred Hereford and a multibreed synthetic beef cattle herd" docx
Bạn đang xem bản rút gọn của tài liệu. Xem và tải ngay bản đầy đủ của tài liệu tại đây (780.83 KB, 14 trang )
Original
article
Population
analysis
of
a
purebred
Hereford
and
a
multibreed
synthetic
beef
cattle
herd
PF
Arthur
M
Makarechian
2
R
Weingardt
RT
Berg
1
NSW
Agriculture,
Agricultural
Research
Centre,
Rangie,
NSW
2823,
Australia;
2
Department
of
Animal
Science,
University
of
Alberta,
Edmonton,
AB,
T6G
2P5,
Canada;
(Received
25
May
1994;
accepted
17
November
1994)
Summary -
Lifetime
records
of
females
born
from
1966 to 1975
were
used
to
estimate
and
compare
population
parameters
of
a
purebred
Hereford
(HE)
and
a
multibreed
synthetic
(SYl)
beef
cattle
herd
raised
under
a
stringent
culling
policy
whereby
heifers
and
cows
failing
to
wean
a
calf
each
year
were
culled.
Population
size
averaged
118
cows,
39
heifers
and
155
cows,
56
heifers
a
year
for
HE
and
SY1,
respectively.
The
SY1
was
a
multibreed
composite
breed
group
with
an
average
breed
composition
of
33%
Charolais,
33%
Angus,
and
20%
Galloway,
and
the
remainder
from
other
beef
breeds.
The
2
herds
were
raised
under
the
same
management.
Nine
life
table
statistics
were
studied:
age-
specific
survivorship,
age-specific
survival
rate,
mortality
rates
(Qx),
expected
herd
life,
age-specific
birth
rate,
reproductive
value,
net
reproductive
rate
(Ro);
instantaneous
rate
of
population
increase
(r)
and
generation
interval
(T).
Differences
were
obtained
between
the
herds
for
the
age-specific
life
table
statistics,
with
SY1
having
higher
values
(except
for
lower
Qx
values)
than
HE.
SY1
had
higher
means
than
HE
for
Ro
(1.57 ±0.11
versus
1.21
t
0.15;
p
<
0.07)
and
r
(0.09 f
0.01
versus
0.03 f
0.02;
p
<
0.04),
indicating
a
faster
rate
of
population
growth
in
SY1.
The
value
of
T
for
SY1
was
higher
(p
<
0.01)
than
that
for
HE
(5.09
f
0.11
versus
4.25
f
0.19
years).
The
results
indicate
that
the
same
management
and
culling
policy
may
result
in
different
life
table
statistics,
which
in
this
study
was
possibly
due
to
the
influence
of
heterosis
for
calf
survival
in
the
multibreed
composite
SY1
herd.
Over
time
the
stringent
culling
policy
had
the
effect
of
reducing
Ro,
r and
T
values
to
the
point
where
herd
size
in
the
HE
herd
could
not
be
maintained
(Ro
<
1
in
the
1972
and
later
cohorts).
beef
cattle
/
demography
/
longevity
/
survival
/
reproduction
Résumé -
Analyse
démographique
d’un
troupeau
de
race
pure
Hereford
et
d’un
troupeau
synthétique
multiracial
de
bovins
à
viande.
Les
enregistrements
des
carrières
des
femelles
nées
de
1966
à
1975
sont
utilisés
pour
estimer
et
comparer
les
paramètres
démographiques
d’un
troupeau
de
race
pure
Hereford
(HE)
et
d’un
troupeau
synthétique
multiracial
(SY1)
de
bovins
à
viande,
soumis
tous
2
à une
politique
de
réforme
rigoureuse
dans
laquelle
toute
génisse
ou
toute
vache
ne
produisant
pas
un
veau
sevré
par
an
était
éliminée.
La
taille
moyenne
instantanée
de
la
population
était
de
118
vaches
et
39
génisses
dans
le
troupeau
HE,
de
155
vaches
et
56
génisses
dans
le
troupeau
SY1.
Le
troupeau
SYI
était
un
ensemble
composite
d’origine
multiraciale
comprenant
33%
de
Charolais,
33%
d’Angus
et
20%
de
Galloway,
le
reste
provenant
d’autres
races
bovines
à
viande.
Les
2
troupeaux
étaient
conduits
de
manière
identique.
Neuf
paramètres
issus
de
l’analyse
des
carrières
des femelles
sont
étudiés :
la probabilité,
à
la
naissance,
de
survivre
jusqu’à
un
âge
donné ;
le
quotient
de
survie
Px
(probabilité,
à
un
âge
donné,
de
survivre
jusqu’à
la
classe
d’âge
suivante);
l’espérance
de
vie
à
un
âge
donné
(nombre
moyen
d’années
restant
à
vivre
à
une
femelle
atteignant
l’âge
x) ;
le
quotient
de
fécondité
(probabilité
pour
une
femelle,
à
un
âge
donné,
de
produire
une
fille) ;
la
contribution
relative
d’une
femelle
d’un
âge
donné
à
la
procréation
des
générations
futures ;
le
taux
net
de
reproduction
Ro
(nombre
moyen
de
filles
de
remplacement
produites
par
une
femelle) ;
le
taux
instantané
d’accroissement
de
la
population
(r)
et
l’intervalle
de
génération
(T).
On
observe
des
différences
entre
les
2 troupeaux
sur
les
paramètres
démographiques
spécifiques
de
l’âge,
le
troupeau
SYI
présentant
des
valeurs
plus
élevées
que
le
troupeau
HE.
Le
troupeau
SY1
présente
des
valeurs
moyennes
plus
élevées
que
le
troupeau
HE
pour
le
taux
net
de
reproduction
Ro
!1, 57 ±
0, 11
contre
1,21
t
0, 15;
p
<
0, 07)
et
pour
le
taux
instantané
d’accroissement
r
(0, 09 !
0, Ol
contre
0, 03 !
0,02;
p
<
0, 04),
ce
qui
indique
un
taux
d’accroissement
de
la
population
plus
élevé
dans
le
troupeau
SYl.
L’intervalle
de
génération
T
est
plus
élevé
(p
<
0, Ol)
dans
le
troupeau
SYI
que
dans
le
troupeau
HE
!5,09 ±0,11
contre
4,25
t
0,19
années).
Ces
résultats
montrent
qu’une
même
conduite
et
qu’une
même
politique
de
réforme
peuvent
se
traduire
par
des
paramètres
démographiques
différents,
phénomène
résultant
sans
doute
dans
cette
étude
d’un
effet
d’hétérosis
sur
la
survie
des
veaux
dans
le
troupeau
synthétique
d’origine
multiraciale
SYl.
Sur
la
durée,
la
politique
rigoureuse
de
réforme
entraîne
une
réduction
des
paramètres
Ro,
r
et
T
jusqu’à
un
point
où
la
taille
du
troupeau
HE
ne
peut
plus
être
maintenue
(Ro
<
1
en
1972
et
dans
les
cohortes
ultérieures).
bovin
à
viande
/
démographie
/
longévité
/
survie
/
reproduction
INTRODUCTION
Demographic
analyses
are
used
extensively
in
humans,
wildlife
and
fisheries
to
characterize
populations.
They
involve
estimation
of
parameters
such
as
reproduc-
tive
and
mortality
rates,
growth
in
numbers
and
biomass,
age
structure
and
other
vital
statistics
of
the
population.
Research
reports
in
domestic
animals
using
simi-
lar
analyses
were
reviewed
by
Vu
Tien
Khang
(1983).
A
comprehensive
population
analysis
of
a
commercial
beef
cattle
herd
was
made
by
Schons
et
al
(1985)
and
some
possible
uses
of
the
various
parameter
estimates
discussed.
In
livestock,
results
of
such
analyses
have
been
used
to
formulate
strategies
for
culling
and
replacement
(Turner
et
al,
1959;
Hickey,
1960;
Basu
and
Ghai,
1980;
Greer
et
al,
1980),
organize
breeding
schemes
(Wiener,
1961;
Lauvergne
et
al,
1973;
Martin,
1975;
Basu
and
Ghai,
1980)
and
as
a
check
on
management
practices
(Nadkarni
et
al,
1983).
A
similar
analysis
was
used
by
Ahmad
et
al
(1992)
to
characterize
a
herd
of
dairy
buffalo.
The
goal
of
faster
genetic
improvement
in
operations
producing
seed
stock
dictates
that
the
generation
interval
should
be
shortened,
and
hence
intense
selection
and/or
stringent
culling
practices
are
usually
employed.
Arthur
et
al
(1992)
reported
the
reasons
for
disposal
of
cows
from
a
purebred
Hereford
and
2
multibreed
synthetic
beef
cattle
herds
managed
at
the
same
location
and
under
a
stringent
culling
policy.
The
longevity
and
lifetime
productivity
of
the
cows
were
reported
by
Arthur
et
al
(1993).
There
is
very
little
information
available
for
beef
cattle
on
the
effect,
over
time,
of
such
a
stringent
culling
policy
on
population
parameters
and
on
the
sustainability
of
herd
numbers.
The
objective
of
this
study
was
to
construct
age-specific
and
overall
life
tables
to
characterize
and
compare
a
purebred
Hereford
and
a
multibreed
synthetic
beef
cattle
herd
under
a
stringent
culling
system.
MATERIALS
AND
METHODS
Herd
management
and
breeding
plan
The
data
used
for
the
study
were
from
the
University
of
Alberta
ranch
at
Kinsella,
located
150
km
south-east
of
Edmonton,
Alberta,
Canada.
Two
main
breeding
populations
were
established
in
1960,
namely
the
purebred
Hereford
(HE)
and
the
Beef
Synthetic.
The
history
of
the
ranch
and
the
formation
of
the
breeding
populations
have
been
reported
in
detail
by
Berg
(1980).
The
Beef
Synthetic
population
was
renamed
Beef
Synthetic
#1
(SY1)
in
1982,
after
another
synthetic
group
composed
of
beef
breeds
was
developed.
To
satisfy
the
criteria
of
relatively
stable
herd
numbers,
consistent
management,
detailed
identification
and
production
records
required
for
such
analyses,
records
on
females
born
at
the
Kinsella
ranch
from
1966
through
to
1975
and
followed
till
disposal
were
used.
The
average
herd
size
and
standard
deviation
of
the
cow
herd
was
155 !
6.7
for
SY1
and
118 !
3.4
for
HE.
The
corresponding
values
for
the
heifers
were
56 ! 3.0
for
SY1
and
39 ±3.5
for
HE.
All
the
females
had
left
the
herd
at
the
time
of
data
analyses.
The
Beef
Synthetic
#1
(SY1)
population
is
a
multibreed
composite
group
with
mainly
Charolais,
Angus
and
Galloway
breeding.
The
average
breed
composition
of
the
SY1
females
is
presented
in
table
I.
The
management
and
breeding
plan
of
the
herds
were
described
in
detail
by
Berg
et
al
(1990).
In
summary,
the
2
herds
were
treated
as
similarly
as
possible.
The
breeding
herds
were
on
the
range
year
round
and
dependent
on
natural
grazing,
except
for
3-4
months
is
winter
when
supplementary
feed
was
provided.
The
level
of
supplementary
feed
depended
on
the
pasture
conditions
and
severity
of
the
winter.
Selection
of
sires
was
within
each
herd
and
was
based
on
pre-
and
postweaning
gain.
On
a
few
occasions,
Hereford
bulls
from
outside
the
HE
herd
were
used
for
breeding.
Sires
were
selected
for
breeding
as
yearlings
and
about
25%
of
these
bulls
were
again
used
in
the
following
year.
All
sound
heifers
were
exposed
to
bulls
as
yearlings
to
calve
as
2
year
olds.
Cows
and
heifers
were
exposed
to
bulls
for
60
d
in
the
breeding
season
which
was
July/August
each
year.
Breeding
occurred
in
single-sire
groups
of
about
25
cows.
To
prevent
reproductive
failure
resulting
from
poor
serving
capacity
of
a
particular
bull,
mating
groups
were
monitored
during
the
first
half
of
the
breeding
season.
Any
bull
found
to
have
poor
serving
capacity
was
replaced
with
a
proven
older
bull
for
the
rest
of
the
breeding
season.
Calving
was
mainly
in
April
and
May
and
2
year
olds
were
calved
separately,
closely
supervised
and
remained
separated
until
breeding
commenced.
Calves
remained
with
their
dams
until
weaning
in
early
October
each
year.
Heifers
and
cows
failing
to
wean
a
calf
each
year
were
culled.
Heifers
and
cows
were
also
culled
for
unsoundness
and
defects
such
as
bad
udders,
leg
and
feet
problems,
etc.
The
frequencies
of
the
various
reasons
for
disposal
for
the
herds
have
been
reported
by
Arthur
et
al
(1992).
The
lifetime
productivity
of
these
cows
has
also
been
reported
by
Arthur
et
al
(1993).
Demographic
analyses
Life
table
statistics
were
computed
for
the
2
herds
in
this
study.
The
cohort
method
of
life
table
construction
was
used.
This
method
follows
an
actual
cohort
(birth
year
group)
from
birth
to
the
end
of
the
last
member’s
life
(Caughley,
1966,
1967;
Mertz,
1970).
Data
on
10
full
cohorts
(1966
through
1975;
all
animals
had
left
the
herd)
were
used
in
the
construction
of
the
life
tables
for
each
herd.
The
model
utilized
females
only
and
involved
annual
seasonal
breeding
and
overlapping
generations.
The
time
reference
was
immediately
postpartum,
with
birth
considered
age
0
and
time
interval
being
1
year.
Leaving
the
herd
for
any
reason
was
equated
with
mortality.
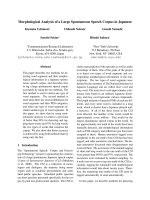
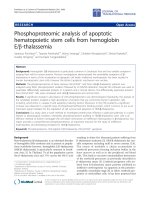
The
biological
flow
chart
of
the
model
is
illustrated
in
figure
1.
Six
age-specific
life
table
statistics
and
3
overall
life
table
statistics
were
com-
puted
(Caughley,
1966,
1967;
Mertz,
1970;
Pianka
and
Parker,
1975).
The
age-
specific
life
table
statistics
computed
were
as
follows:
survivorship
(probability
at
birth
of
an
animal
surviving
to
a
particular
age,
Lx);
survival
rate
(probability
at
a
particular
age
of
surviving
to
the
next
age,
Px);
mortality
rate
(probability
at
a
particular
age
of
dying
before
the
next
age,
Qx
=
1 —
Px);
expected
herd
life
(ad-
ditional
number
of
years
an
animal
of
a
particular
age
is
expected
to
remain
in
the
herd,
Ex);
birth
rate
(probability
of
a
cow
of
a
particular
age
producing
a
live
female
calf,
Mx);
and
reproductive
value
(relative
contribution
of
an
animal
of
a
particular
age
to
future
generations,
Vx).
The
overall
life
table
statistics
computed
were
net
reproductive
rate
(expected
number
of
daughters
produced
by
each
animal,
Ro),
instantaneous
rate
of
population
increase
(a
measure
of
herd
number
increase
or
decrease,
r)
and
generation
interval
in
years.
The
computational
formulae
for
these
life
table
statistics
have
been
summarised
by
Schons
et
al
(1985).
In
many
stud-
ies
populations
are
characterized
by
constructing
a
life
table
pooled
across
cohorts
(Krehbiel
et
al,
1962;
Greer
et
al,
1980;
Melton,
1983).
Another
method
to
cancel
out
any
differences
between
cohort
and
distortions
due
to
small
numbers
of
animals
at
older
ages
is
to
average
each
life
table
statistic
over
all
cohorts
and
at
each
age,
if
age-specific
(Schons
et
al,
1985).
The
age-specific
survivorship
(Lx)
forms
the
basis
of
all
the
life
table
statistics.
Preliminary
analysis
of
Lx
curves
indicated
that
using
the
pooled
or
the
average
life
table
method
described
the
herds
in
a
similar
manner,
hence
only
the
average
life
table
method
was
used
for
the
computation
of
all
the
life
table
statistics.
The
Lee-Desu
D
statistic
(Lee
and
Desu,
1972)
was
computed,
using
the
Survival
procedure
in
SPSS
(1990),
to
compare
the
age-specific
survivorship
of
the
two
herds.
The
D
statistic
is
based
on
a
score
that
compares
the
Lx
values
or
another
statistic
between
herds
and
tests
the
null
hypothesis
that
the
herds
are
samples
from
the
same
survival
distribution.
Differences
between
the
2
herds
in
the
overall
life
table
statistics
(Ro,
T
and
r)
were
tested
using
a t-test.
Within
each
herd,
simple
linear
regression
analysis
was
done
for
each
of
the
overall
life
table
statistics
to
examine
the
nature
of
the
slope
(Steel
and
Torrie,
1980).
RESULTS
AND
DISCUSSION
Comparison
of
the
survivorship
(Lx)
values
of
the
2
herds
using
the
Lee-Desu
D
statistic
showed
significant
difference
between
the
herds
(D
=
3.98;
p
<
0.05)
leading
to
the
rejection
of
the
null
hypothesis
that
the
survival
distributions
of
the
2
herds
are
the
same.
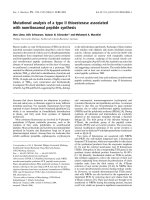
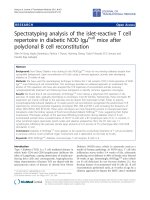
The
survival
patterns
(L!)
for
HE
and
SY1
were
similar
up
to
age
2
years,
after
which
there
was
a
faster
rate
of
the
decline
in
HE
compared
to
SY1
(fig
2).
A
detailed
discussion
on
the
L!
curves
and
the
reasons
for
disposal
of
the
females
of
the
2
herds
have
been
reported
previously
(Arthur
et
al,
1992,
1993).
The
probabilities
at
a
particular
age
of
surviving
to
the
next
age
(Px)
are
presented
in
table
II.
There
was
a
high
probability
for
survival
from
birth
to
age
1
year
and
from
age
1
to
age
2
years
(greater
than
0.9).
This
was
due
to
the
facts
that
firstly
there
were
very
few
deaths
prior
to
age
2
years
and,
secondly,
all
available
females
entered
the
breeding
herd
as
replacements.
From
age
2
years,
causes
other
than
death,
viz
culling
for
reproductive
failure,
calving
problems,
calf
survival
and
udder
problems,
become
additional
sources
of
mortality,
resulting
in
relatively
lower
Px
values
after
age
1
year.
In
general,
SY1
had
higher
survival
probabilities
than
HE
after
age
1
year.
The
age-specific
mortality
rate
(Qx)
is
a
mirror
image
(1 -
Px)
of
the
age-specific
survival
rate
(Px)
and
the
results
are
opposite
those
of
the
Px
statistic
discussed.
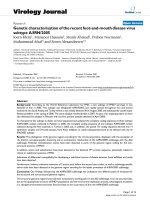
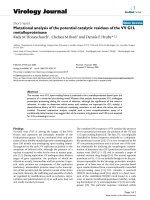
SY1
had
higher
values
for
expected
herd
life
(Ex)
at
all
ages
compared
to
HE
(fig
3),
indicating
that
at
any
particular
age
SY1
females
were
expected
to
live
longer
than
HE
females.
The
age-specific
birth
rate
(probability
of
a
cow
of
a
particular
age
producing
a
live
female
calf,
Mx)
is
a
very
important
statistic
in
beef
cattle
production,
because
it
influences
the
number
of
replacement
heifers
available,
population
growth
and
generation
interval.
Mx
is
dependent
on
the
sex
ratio
of
progeny.
At
older
ages
there
were
fewer
cows
present
in
the
herd,
hence
the
likelihood
that
the
sex
ratio
of
progeny
of
cows
at
these
ages
was
not
1:1
was
high.
This
deviation
from
the
expected
1:1
sex
ratio
contributed
to
the
relatively
high
or
low
Mx
values
obtained
at
older
ages
(table
II).
Mean
Mx
across
all
ages
was
0.46
and
0.48
for
HE
and
SY1,
respectively.
Reproductive
value
(Vx)
is
also
as
the
ratio
of
the
expected
size
of
a
herd
(at
some
future
time)
founded
by
a
cow
or
group
of
cows
of
a
particular
age
to
the
expected
size
of
a
herd
founded
simultaneously
by
a
heifer
calf
or
group
of
heifer
calves
aged
0
(MacArthur
and
Wilson,
1967).
The
Vx
values
for
both
herds
peaked
at
age
2
years
and
gradually
dropped
off
with
SY1
having
higher
values
than
HE
at
all
ages
(table
II).
The
rise
in
the
V!
values
up
to
age
2
years
was
due
to
the
lack
of
reproduction
until
2
years
of
age
(Mx
values
are
zero
for
ages
0
and
1
year).
The
overall
life
table
statistics
for
the
2
herds
are
presented
in
table
III.
The
means
for
net
reproductive
rate
(Ro)
were
greater
than
unity
and
those
for
instantaneous
rate
of
population
increase
(r)
were
greater
than
zero
for
both
herds.
These
results,
which
represent
the
average
for
the
entire
study
period,
indicate
that
cows
in
both
herds
were
more
than
replacing
themselves
and
that
herd
numbers
were
increasing.
The
means
for
these
statistics
were
higher
in
SY1
than
is
HE.
For
natural
populations
r can
be
used
as
a
measure
of
a
population’s
capacity
for
sustained
change
in
numbers;
the
higher
the
r
the
more
fit
the
population.
Alternatively,
the
environment
in
which
a
population
has
its
highest
r
is
the
optimal
environment
for
that
population
(Mertz,
1970).
Because
of
human
influence
on
livestock
management
for
production
efficiency,
the
application
of
r
as
a
measure
of
a
population’s
capacity
for
sustained
change
in
numbers
is
limited.
Herd
differences
in
generation
interval
(T)
also
followed
a
pattern
similar
to
Ro
and
r
with
SY1
having
higher
means
than
HE.
Examination
of
the
trend
in
the
overall
life
table
statistics
indicated
that
the
means
of
these
statistics
had
been
decreasing
with
time.
For
Ro
both
herds
had
a
negative
regression
coefficient
although
the
coefficient
for
SY1
was
smaller
than
that
for
HE
(fig
4).
For
HE
the
predicted
Ro
values
were
less
than
unity
for
the
1972
and
later
cohorts,
indicating
that
those
cohorts
were
not
replacing
themselves.
The
pattern
for
r
was
similar
to
Ro
and
hence
the
results
are
not
presented.
For
T,
the
regressions
for
SY1
(T
=
5.73 -
O.11Y)
and
for
HE
(T
=
4.84 -
0.108Y)
were
significant
and
both
herds
had
negative
regression
coefficients.
Y
in
the
equations
represents
year
cohorts,
with
the
1966
cohorts
having
a
value
of
1.
The
declining
trend
in
the
overall
life
table
statistics
was
probably
the
result
of
the
stringent
culling
policy.
The
contribution
of
inbreeding
to
this
decline,
if
any,
would
be
minimal
since
efforts
were
made
to
prevent
inbreeding
in
both
herds,
through
the
selection
of
breeding
bulls,
as
well
as
through
the
occasional
use
of
Hereford
bulls
from
outside
the
HE
herd.
The
breed
composition
of
the
multibreed
SY1
herd
stabilized
around
1970
(table
I).
The
trends
in
the
overall
life
table
statistics
were
also
evaluated
using
only
the
1970
to
1975
cohorts
for
both
herds,
to
reflect
the
period
of
stable
breed
composition
of
SY1.
For
these
cohorts
the
regressions
for
SY1
were
not
significant
(Ro
=
1.36-0.004Y
and
T
=
5.22-0.103Y)
while
those
for
HE
were
significant
(Ro
=
1.34-0.103Y
and
T
=
5.16-0.286Y).
These
results
indicate
that
after
the
breed
composition
of
the
SY1
herd
had
stabilized
in
1970
its
Ro
and
T
statistics
also
stabilized,
while
those
for
the
HE
herd
continued
to
decrease.
If
this
declining
trend
needs
to
be
arrested,
strategies
which
aim
at
increasing
the
survival
rates
of
2
and
3
year
old
cows
should
be
considered,
since
survival
rates
(Px)
dropped
at
ages
2
and
3
years
relative
to
ages
1-2
and
4-5
years.
In
this
study,
2
and
3
year
old
cows
are
first
and
second
calvers;
53
and
65%
of
mortalities
in
first
and
second
calvers,
respectively,
were
due
to
reproductive
failure
(culling
for
failure
to
produce
a
calf,
Arthur
et
al,
1992).
The
stringency
of
culling
for
reproductive
failure
can
be
relaxed
for
these
2
ages,
or
cows
at
these
ages
could
be
provided
with
a
higher
level
of
husbandry,
such
as
improved
nutrition,
to
increase
their
reproductive
rates.
There
were
no
significant
differences
between
the
herds
in
the
percentages
of
cows
disposed
(referred
to
as
mortality
in
this
study)
for
any
of
the
major
reasons
for
disposal
reported
by
Arthur
et
al
(1992),
except
for
calf
survival
problems
(perinatal
and
preweaning).
The
value
of
17.1%
of
all
cows
disposed
from
the
HE
herd
was
due
to
the
fact
that
they
gave
birth
to
stillborn
calves
or
that
their
calves
did
not
survive
to
weaning.
This
compares
to
9.1%
for
the
SY1
herd.
In
the
execution
of
the
culling
policy
no
cow
or
herd
was
given
preferential
treatment,
hence
any
cow
or
heifer
which
produced
a
stillborn
calf
or
failed
to
wean
its
calf
was
culled.
The
HE
and
SY1
herds
were
raised
at
the
same
location
and
under
similar
management
and
culling
policy
hence
herd
differences
were
likely
due
to
the
genetic
make-up
of
the
females.
The
positive
effect
of
heterosis
on
calf
survival
has
been
reported
in
beef
cattle
(Cundiff
et
al,
1974;
Spelbring
et
al,
1977).
It
is
thus
likely
that
the
calf
survival
in
the
SY1
herd,
being
a
multibreed
composite,
was
positively
influenced
by
heterosis
while
the
HE
herd,
being
purebred,
was
not.
The
difference
in
the
life
table
statistics
for
the
2
herds
can
be
attributable,
at
least
in
part,
to
the
relative
difference
in
calf
survival
between
the
herds.
Population
analysis
of
a
commercial
herd
of
Angus
cattle
in
Wyoming
was
reported
by
Schons
et
al
(1985)
using
similar
biological
model
and
computational
formulae.
The
Lx
curves
of
herds
in
this
study
(Kinsella
herds)
and
that
of
the
Wyoming
herd
(Schons
et
al,
1985)
are
presented
in
figure
2.
The
most
noticeable
difference
between
the
Lx
curves
of
the
Kinsella
herds
and
that
of
the
Wyoming
herd
occurred
at
ages
1
and
2
years,
where
the
Lx
values
for
the
Kinsella
herd
were
almost
double
those
of
the
Wyoming
herd.
This
is
attributable
to
differences
in
replacement
heifer
policy
at
the
2
locations.
In
the
Kinsella
herds
all
sound
heifers
were
included
in
the
breeding
herd
and
exposed
to
bulls
as
yearlings,
hence
an
Lx
of
over
0.9
at
1
year
of
age.
In
the
Wyoming
herd,
not
all
heifers
entered
the
breeding
herds.
Replacement
heifers
were
selected
based
on
weaning
weight,
yearling
weight,
dams
record,
and
in
some
years
on
information
on
their
sires.
Hence
just
over
50%
of
the
heifers
(Lx
of
0.52)
were
used
as
replacements.
Another
difference
between
the
Kinsella
and
Wyoming
herds
is
in
the
slope
of
the
Lx
curves
after
age
2
years,
although
the
curves
were
all
smooth
with
no
major
disruptions.
The
slopes
of
the
Kinsella
herds
are
sharper
than
that
of
the
Wyoming
herd.
This
is
likely
due
to
differences
in
the
culling
policies
at
the
2
locations.
Culling
was
very
stringent
in
the
Kinsella
herds;
any
cow
failing
to
wean
a
calf
each
year
was
culled.
Cows
were
also
culled
for
caesarian
sections,
bad
udders,
and
leg
and
feet
problems
(Arthur
et
al,
1992).
In
the
Wyoming
herd
cows
were
culled
for
some
of
the
reasons
as
in
the
Kinsella
herds,
but
culling
was
not
as
stringent.
The
Lx
curve
reported
by
Krehbiel
et
al
(1962),
using
data
(1939-1961)
from
the
Virginia
Beef
Cattle
Improvement
Association
(VBCIA),
was
similar
to
that
of
the
Wyoming
herd
except
for
its
slightly
steeper
slope.
Px
values
for
the
Kinsella
herds
were
higher
than
that
of
the
Wyoming
herd
at
age
1
year,
similar
at
age
2
years
generally
lower
at
subsequent
ages,
due
to
the
same
reasons
discussed
for
differences
in
Lx
values
between
the
2
locations.
Ex
curves
from
the
Wyoming
(Schons
et
al,
1985)
and
VBCIA
(Krehbiel
et
al,
1962)
herds
peaked
at
age
1
year,
whereas
those
of
the
Kinsella
herds
were
highest
at
age
0
but
peaked
again
at
ages
4
and
5
years
(fig
3).
Although
the
Ex
values
reported
by
Greer
et
al
(1980)
for
a
herd
of
mostly
Hereford
cattle
in
Montana
did
not
include
ages
0
and
1
years,
the
values
for
ages
2
to
10
years
provided
did
not
show
any
peak
beyond
the
highest
value
at
age
2
years.
The
difference
in
the
direction
of
the
Ex
curves
between
ages
0
and
1
years
for
the
Kinsella
herds
(decreasing)
compared
with
those
of
the
other
studies
(increasing)
is
probably
due
to
differences
in
replacement
heifer
policy.
All
heifers
were
used
as
replacements
in
the
Kinsella
herds
versus
the
selection
of
a
proportion
of
heifers
which
was
used
as
replacement
in
the
other
studies.
In
the
Kinsella
herds
females
were
expected
to
wean
a
calf
each
year.
Culling
for
reproductive
failure
and
calf
survival
problems
accounted
for
63%
of
all
mortalities
(Arthur
et
al,
1992).
There
was
therefore
an
indirect
reproduction
related
automatic
selection
with
age.
This
automatic
selection
could
be
responsible
for
the
rise
in
the
Ex
curves
after
first
calving
(age
2.years)
and
reaching
a
peak
at
ages
4
and
5
years,
which
is
unique
to
the
Kinsella
herds.
Mx
values
for
the
Kinsella
herds
(overall
average
of
0.46
for
HE
and
0.48
for
SY1)
were
generally
higher
than
those
of
the
Wyoming
herd
(overall
average
of
0.42).
Mx
is
a
function
of
sex
ratio,
fecundity
and
foetal
mortality.
In
the
Kinsella
herds
any
females
which
failed
to
calve
in
any
year
was
culled,
hence
there
is
an
indirect
automatic
selection
for
females
with
high
reproductive
efficiency.
This
could
account
for
the
higher
Mx
value
in
the
Kinsella
herds
compared
to
the
Wyoming
herd,
where
culling
for
reproductive
failure
was
not
as
stringent.
Vx
values
in
the
Wyoming
herd
are
higher
than
those
of
the
Kinsella
herds,
probably
due
to
differences
in
culling
policy
and
replacement
heifer
management
as
discussed
for
Lx.
Means
of
overall
Ro
and
r
values
for
the
SY1
herd
were
higher
than,
whereas
those
of
the
HE
herd
were
similar
to,
those
of
the
Wyoming
herd.
Generation
intervals
(T)
for
the
Kinsella
herds
were
lower
than
that
of
the
Wyoming
herd.
The
value
of
T
for
most
beef
cattle
herds
is
between
4.5
and
6
years
(Neumann
and
Snapp,
1969)
hence
the
Kinsella
herds
are
at
the
lower
end
of
the
range,
due
to
the
stringent
culling
policy.
In
addition
to
the
reproduction-related
automatic
selection
with
age,
the
strin-
gent
culling
policy
had
the
effect
of
reducing
T.
In
situations
where
genetic
progress
is
being
made
for
any
trait,
this
reduction
in
T
may
be
beneficial,
as
a
lower
T
in-
creases
the
rate
of
genetic
gain.
In
these
herds,
direct
selection
of
bulls
for
pre-
and
postweaning
gain
was
occurring,
which
resulted
in
positive
genetic
gain
(Sharma
et
al,
1985).
The
rate
of
this
genetic
progress
was
thus
enhanced
by
the reduction
in
T
for
the
females.
It
is
however
recommended
that
in
using
such
a
stringent
culling
policy
careful
monitoring
should
be
exercised
to
ensure
that
cows
are
able
to
replace
themselves
(Ro §
1)
so
that
herd
numbers
de
not
decrease
(r >
0).
CONCLUSION
The
results
of
this
study
and
those
of
other
studies
in
beef
cattle
indicate
that
life
table
statistics
can
differ
among
herds
where
management
and
culling
policies
differ.
However,
this
study
also
shows
that
the
same
management
and
culling
policy
may
result
in
different
life
table
statistics.
This
is
probably
due
to
the
influence
of
heterosis
for
calf
survival
in
the
multibreed
composite
SY1
herd.
The
stringent
culling
policy
had
the
effect
of
reducing
the
net
reproductive
rate,
instantaneous
rate
of
population
increase
and
generation
interval
in
both
herds
over
time.
However,
in
the
SY1
herd
the
trend
stabilized
in
1970
and
the
ability
to
maintain
herd
numbers
was
retained,
while
in
the
HE
herd
the
trend
continued
to
the
point
where
herd
size
could
not
be
maintained
(Ro
<
1
for
1972
and
later
cohorts,
fig
4).
If
the
decline
in
these
overall
life
table
statistics
needs
to
be
stopped,
it
is
suggested
that
strategies
that
aim
at
reducing
mortality
rates
in
2
and
3
years
olds
should
be
considered.
ACKNOWLEDGMENTS
Assistance
provided
by
G
Minchau
and
the
staff
at
the
University
ranch
is
acknowledged.
Financial
support
provided
by
the
Natural
Sciences
and
Engineering
Research
Council,
Agriculture
Canada
and
the
Alberta
Cattle
Commission
is
acknowledged.
REFERENCES
Ahmad
Z,
Berger
PJ,
Healey
MH
(1992)
Estimated
culling
probabilities,
age
distribution,
and
expected
herd
life
in
Nili-Ravi
Buffalo.
J
Dairy
Sci
75, 1707-1714
Arthur
PF,
Makarechian
M,
Berg
RT,
Weingardt
R
(1992)
Reasons
for
disposal
of
range
beef
cows.
Can
J
Anim
Sci
72,
751-578
Arthur
PF,
Makarechian
M,
Berg
RT,
Weingardt
R
(1993)
Longevity
and
lifetime
productivity
of
range
beef
cows.
J
Anim
Sci
71,
1142-1147
Basu
SB,
Ghai
AS
(1980)
Note
on
age-structure,
herd
life
and
replacement
rate
in
Murrah
buffalo
herd.
Indian
J
Anim
Sci
757-759
Berg
RT
(1980)
University
of
Alberta
Kinsella
Ranch -
The
first
twenty
years.
Dept
of
Anim
Sci,
University
of
Alberta.
Annual
Feeders’ Day
Rep
59, 3-9
Berg
RT,
Makarechian
M,
Arthur
PF
(1990)
The
University
of
Alberta
beef
breeding
project
after
30
years - A
review.
Dept
Anim
Sci,
University
of
Alberta.
Annual
Feeders’
Day
Rep
69,
65-69
Caughley
G
(1966)
Mortality
patterns
in
mammals.
Ecology
47,
906-918
Caughley
G
(1967)
Parameters
for
seasonally
breeding
populations.
Ecology
48,
834-839
Cundiff LU,
Gregory
KE,
Koch
RM
(1974)
Effects
of heterosis
on
reproduction
in
Hereford,
Angus
and
Shorthorn
cattle.
J
Anim
Sci
38, 711-727
Greer
RC,
Whitman
RW,
Woodward
RR
(1980)
Estimation
of
probability
of
beef
cows
being
culled
and
calculation
of
expected
herd
life.
J
Anim
Sci
51,
10-19
Hickey
F
(1960)
Death
and
reproductive
rates
of
sheep
in
relation
to
flock
culling
and
selection.
NZ
J
Agric
Res
3,
332-344
Krehbiel
E,
Johnson
WL,
Carter
RC
(1962)
Actuarial
methods
applied
to
domestic
animals.
J
Anim
Sci
21,
973-974
(Abst)
Lauvergne
JJ,
Boyazoglu
JG,
Carta
R,
Casu
S
(1973)
Caractéristiques
démographiques
de
la
race
ovine
sarde.
Ann
Genet
Sel
Anim
5, 53-72
Lee
E,
Desu
M
(1972)
A
computer
program
for
comparing
k samples
with
right-censored
data.
Comput
Programs
Biomed
2,
315-321
MacArthur
RH,
Wilson
EO
(1967)
The
Theory
of
Island
Biogeography.
Princeton
Univ
Press,
Princeton,
NJ,
USA
Martin
(1975)
A
genetic
analysis
of
the
Galway
sheep
breed.
I.
Some
aspects
of
population
dynamics
of
the
pedigree
and
non-pedigree
Galway
sheep
breed.
Ir
J
Agric
Res
14,
245-
253
Melton
DA
(1983)
Population
dynamics
of
waterbuck
(Kobus
ellipsiprymnus)
in
the
Umfolozi
Game
Reserve. Afr
J
Ecol
21,
77-91
Mertz
DB
(1970)
Notes
on
methods
used
in
life-history
studies.
In:
Readings
in
Ecology
and
Ecological
Genetics
(JH
Connell,
DB
Mertz,
WW
Murdoch,
eds)
Harper
and
Row,
New
York,
USA,
4-17
Nadkarni
UG,
Arya
SN,
Abraham
J
(1983)
Age-specific
mortality
rates
in
bovines
in
ICD
(Amritsar)
and
non-ICD
(Ferozepur)
areas.
Indian
J
Anim
Sci
53, 712-714
Neumann
AL,
Snapp
RR
(1969)
Beef
Cattle.
John
Wiley
and
Sons
Inc,
New
York,
USA,
52
Pianka
ER,
Parker
WS
(1975)
Age-specific
reproductive
tactics.
Am
Nat
109,
453-464
Schons
D,
Hohenboken
WD,
Hall
JD
(1985)
Population
analysis
of
a
commercial
beef
cattle
herd.
J
Anim
Sci
61,
44-54
Sharma
AK,
Willms
L,
Hardin
RT,
Berg
RT
(1985)
Selection
response
in
a
purebred
Hereford
and
a
multi-breed
synthetic
population
of
beef
cattle.
Can
J
Anim
Sci
65,
1-9
Spelbring
MC,
Martin
TG,
Drewry
KJ
(1977)
Maternal
productivity
of
crossbred
Angus
X
Milking
Shorthorn
cows.
II.
Cow
reproduction
and
longevity.
J
Anim
Sci
45, 976-982
SPSS
(1990)
SPSS/PC
+
Advanced
Statistics
4.0.
SPSS
Inc,
Chicago,
IL,
USA
Steel
RGD,
Torrie
JH
(1980)
Principles
and
Procedures
of
Statistics.
(2nd
ed)
McGraw-
Hill,
New
York,
USA
Turner
HN,
Dolling
CHS,
Sheaffe
PHG
(1959)
Vital
statistics
for
an
experimental
flock
of
Merino
sheep.
I.
Death
rates
in
adult
sheep,
in
relation
to
method
of
selection,
age
and
sex.
Aust
J
Agric
Res
10,
581-590
Vu
Tien
Khang
J
(1983)
Methods
of
analysis
of
demographic
and
geneological
data
in
the
populations
of
domestic
animals.
Genet
Sel
Evol
15,
263-298
Wiener
G
(1961)
Population
dynamics
in
14
lowland
breeds
of
sheep
in
Great
Britain.
J
Agric
Sci
57,
21-28