Báo cáo sinh học: " Body size and developmental temperature in Drosophila simulans: comparison of reaction norms with sympatric " docx
Bạn đang xem bản rút gọn của tài liệu. Xem và tải ngay bản đầy đủ của tài liệu tại đây (1.17 MB, 22 trang )
Original
article
Body
size
and
developmental
temperature
in
Drosophila
simulans:
comparison
of
reaction
norms
with
sympatric
Drosophila
melanogaster
JP
Morin
B
Moreteau
G
Pétavy
AG
Imasheva
2
JR
David
1
Laboratoire
de
populations,
genetique
et
evolution,
CNRS,
91198
Gif sur-Yvette
cedex,
Prance;
2
L!avilov
Institute
of
General
Genetics,
3
Gubkin
Street,
117809
Moscow,
Russia
(Received
10
November
1995;
accepted
7
July
1996)
Summary -
Reaction
norms
of
two
size-related
traits
(wing
and
thorax
length)
were
analyzed
in
relation
to
growth
temperature
in
a
French
natural
population
of
Drosophila
simulans,
using
the
isofemale
lines
method.
The
wing/thorax
ratio
was
also
studied.
Data
were
compared
to
those
of
the
sibling
species
Drosophila
melanogaster
from
the
same
locality.
Flies
were
reared
at
seven
constant
temperatures,
representing
the
whole
thermal
range
of
the
two
species.
Phenotypic
and
genetic
variabilities
were
analyzed.
For
investigating
the
shape
of
the
response
curves
(ie,
reaction
norms)
two
methods
were
used:
analysis
of
slope
variations
and
polynomial
adjustments.
As
expected
from
the
relatedness
of
the
two
species,
many
similarities
were
observed.
Notably,
the
reaction
norms
of
wing
and
thorax
lengths
exhibited
a
maximum
at
low
temperature,
while
the
wing/thorax
ratio
was
a
regularly
decreasing
sigmoid
curve.
Numerous
and
sometimes
great
differences
were
also
observed.
At
the
phenotypic
level,
D
simulans
was
generally
more
variable,
while
at
the
genetic
level,
it
was
less
variable
than
D
melanogaster.
Isofemale
line
heritabilities
varied
according
to
growth
temperature,
but
with
different
patterns
in
the
two
species.
In
both
species,
sexual
dimorphism
increased
with
temperature,
but
the
average
values
and
the
response
curves
were
different.
The
reaction
norms
of
wing
and
thorax
lengths
were
mainly
characterized
by
different
TMSs
(temperatures
of
maximum
size)
with
lower
values
in
D
simulans.
This
species
was
also
characterized
by
a
much
lower
wing/thorax
ratio
with
a
higher
TIP
(temperature
of
inflexion
point).
The
possible
adaptive
significance
of
these variations
remains
unclear.
Indeed,
TMS
variations
suggest
that
D
simulans
could
be
more
tolerant
to
cold
than
its
sibling.
On
the
other
hand,
the
lower
wing/thorax
ratio
of
D
simulans
suggests
a
warm-adapted
species.
phenotypic
plasticity
/
isofemale
line
/
wing
length
/
thorax
length
/
wing/thorax
ratio
Résumé -
Taille
corporelle
et
température
de
développement
chez
Drosophila
simu-
lans :
comparaison
des
normes
de
réaction
avec
l’espèce
sympatrique
Drosophila
melanogaster.
Les
normes
de
réaction
de
la
taille
du
corps
(aile
et
thorax)
et
du
rapport
ailé/thorax
ont
été
analysées
en
fonction
de
la
température
de
développement
par
la
méthode
des
lignées
isofemelles.
Deux
populations
naturelles
sympatriques
françaises
des
espèces
sceurs
Drosophila
simulans
et
Drosophila
melanogaster
ont
été
comparées.
Les
drosophiles
ont
été
élevées
à
sept températures
constantes
comprises
entre
12
et
31
°C,
ce
qui
recouvre
l’ensemble
de
la
gamme
des
températures
possibles
pour
ces
deux
espèces.
La
variabilité
phénotypique
entre
les
individus
d’une
même
lignée
a
été
analysée
en
utilisant
les
coefficients
de
variation,
et
la
variabilité
génétique
en
utilisant
les
coefficients
de
corrélation
intraclasse.
La
forme
des
courbes
de
réponse
(ie,
normes
de
réaction)
a
été
analysée
par
deux
méthodes :
la
variation
des
pentes
et
les
ajustements
polyno-
miaux.
En
accord
avec
la
parenté
des
dézix
espèces,
de
nombreuses
similitudes
ont
été
observées.
En
particulier
les
normes
de
réaction
de
l’aile
et
du
thorax
présentent
un
maximum
à
basse
température,
tandis
que
le
rapport
aile/thorax
est
une
courbe
sigmoïde
décroissante.
De
nombreuses
différences
ont
aussi
été
observées,
parfois
très
importantes.
Au
niveau
phénotypique,
D
simulans
est
généralement
plus
variable
que
D
melanogaster,
tandis
qu’au
niveau
génétique
elle
s’est
avérée
en
général
moins
variable.
L’héritabilité
varie
avec
la
température,
mais
avec
des
modalités
différentes
dans
chaque
espèce.
Dans
les
deux
espèces,
le
dimorphisme
sexuel
(évalué
par
le
rapport
femelle/mâle)
augmente
avec
la
température,
mais
les
valeurs
et
les
courbes
de
réponse
sont
différentes.
Les
normes
de
réaction
de
l’aile
et
du
thorax
sont
principalement
différenciées
par
les
TTMs
(températures
de
taille
maximale),
avec
des
valeurs
plus
basses
chez
D
simulans.
Cette
espèce
est
également
caractérisée
par
un
rapport
aile/thorax
inférieur
avec
une
TPI
(température
de
point
d’inflexion)
plus
élevée.
Ces
différences
sont
difficiles
à
interpréter.
En
effet,
les
variations
de
TTMs
suggèrent
que
D
simulans
pourrait
être
plus
résistante
au
froid
que
D
melanogaster ;
en
revanche
le
rapport
ailé/thorax
plus
faible
de
D
simulans
suggère
une
adaptation
à
la
chaleur.
plasticité
phénotypique
/
lignée
isofemelle
/
taille
de
l’aile
/
taille
du
thorax
/
rapport
aile/thorax
INTRODUCTION
Body
size,
which
exhibits
huge
variations
among
living
organisms,
has
long
exerted
a
kind
of
fascination
upon
biologists.
Size
variations
influence
numerous
biological
traits,
such
as
basal
metabolism,
duration
of
development
or
age
at
maturity
(Reiss,
1989;
Stearns,
1992;
Charnov,
1993).
Reciprocally,
size
is
a
target
for
natural
selection
and
varies
as
a
consequence
of
environmental
pressures.
For
example,
the
old
Bergman’s
rule
describes,
in
numerous
homeotherm
species,
an
increase
of
size
related
to
a
colder
environment.
Finally
size
exhibits
large
variations
between
individuals
of
the
same
population,
not
only
due
to
genetic
differences
but
also
due
to
phenotypic
plasticity,
related
to
different
environmental
conditions
during
development.
In
Drosophila,
allometric
relationships
are
not
well
documented,
although
im-
portant
size
variations
exist
between
species
(Ashburner,
1989).
Several
species
including
Drosophila
melanogaster
and
Drosophila
simulans
exhibit
genetic
latitu-
dinal
clines
with
a
larger
size
under
colder
climate
(David
et
al,
1983;
Capy
et
al,
1993),
these
clines
presumably
being
linked
to
temperature.
Laboratory
experiments
keeping
strains
at
different
temperatures
for
many
generations
have
demonstrated
genetic
size
variations
over
time,
ie,
smaller
flies
at
high
temperatures
and
bigger
ones
at
low
temperatures
(Powell,
1974;
Cavicchi
et
al,
1985;
Partridge
et
al,
1994).
These
observations
remind
one
of
Bergman’s
rule,
although
Drosophila
is
an
ecto-
therm
so
that
we
do
not
know
why
it
should
be
better
to
be
larger
in
a
colder
climate
(David
et
al,
1994;
Partridge
et
al,
1994).
In
natural
populations,
adult
size
exhibits
a
huge
variability,
presumably
related
to
variations
in
feeding
and
thermal
conditions
(Atkinson,
1979;
David
et
al,
1980,
1983;
Coyne
and
Beecham,
1987;
Imasheva
et
al,
1994;
Partridge
et
al,
1994;
Moreteau
et
al,
1995).
This
phenotypic
plasticity
cannot
be
considered
as
completely
neutral.
For
example,
a
positive
phenotypic
correlation
exists
between
size
and
fitness
in
nature
(Boul6treau,
1978;
Partridge
et
al,
1987).
Moreover,
Coyne
and
Beecham
(1987)
demonstrated
that
size
variations
were
to
some
extent
heritable
in
spite
of
a
large
environmental
component
due
to
plasticity.
However,
a
positive
phenotypic
correlation
between
body
size
and
adult
fitness
components,
together
with
the
existence
of
additive
genetic
variance
for
body
size,
does
not
necessarily
lead
to
the
conclusion that
body
size
is
the
target
of
selection
(Rausher,
1992).
Up
to
now,
quantitative
genetic
variations
among
natural
populations,
including
latitudinal
clines,
have
generally
been
investigated
at
a
single
temperature
(with
the
exception
of
Coyne
and
Beecham,
1987),
most
often
25 °C
(David
et
al,
1983;
David
and
Capy,
1988;
Capy
et
al,
1993).
On
the
other
hand,
natural
selection,
which
is
presumed
to
be
responsible
for
the
clines,
acts
at
various
temperatures
in
different
localities
and,
in
all
cases,
upon
highly
variable
phenotypes.
Moreover,
temperature
is
the
most
important
abiotic
factor
explaining
geographic
distribution
and
abundance
of
species
in
Drosophila
(David
et
al,
1983;
Parsons,
1983;
Hoffmann
and
Parsons,
1991).
Thus,
for
a
better
understanding
of
these
problems,
several
temperatures
must
be
investigated
and
compared.
In
other
words,
we
have
to
investigate
the
relationship
between
developmental
temperature
and
phenotypes,
ie,
the
reaction
norms
of
various
traits.
Generally,
authors
who
were
interested
in
the
genetics
and
evolution
of
reac-
tion
norms
only
considered
two
environments
and
consequently
linear
norms
(Via
and
Lande,
1985,
1987;
Scheiner
and
Lyman,
1989,
1991;
De
Jong,
1990;
Scheiner,
1993a;
Via,
1993).
Gavrilets
and
Scheiner
(1993)
underlined,
however,
the
neces-
sity
of
studying
nonlinear
norms
and
proposed
to
model
them
using
polynomial
adjustments.
Indeed,
when
a
broad
range
of
environments
(eg,
temperature)
is
in-
vestigated,
norms
of
quantitative
traits
are
as
a
rule
nonlinear
(David
et
al,
1983,
1990, 1994;
Delpuech
et
al,
1995).
A
recent
controversy
has
developed
concerning
the
genetics
of
plasticity.
Various
authors
have
considered
that
the
mean
value
of
a
trait
and
the
shape
of
the
reaction
norm
should
be
distinguished.
In
other
words,
genes
regulating
the
position
of
the
curve
(trait
mean
value
genes)
and
genes
regulating
plasticity
(shape
genes)
might
coexist
(Bradshaw,
1965;
Scheiner
and
Lyman,
1989,
1991;
Scheiner
et
al,
1991;
Weber
and
Scheiner,
1992;
Scheiner,
1993ab;
Gavrilets
and
Scheiner,
1993).
But
this
conception
was
criticized
by
Via
(1993,
1994)
who
considered
it
an
unnecessary
complication,
and
recent
papers
have
tried
to
reconcile
these
two
approaches
(Van
Tienderen
and
Koelewijn,
1994;
Via
et
al,
1995).
Analysing
plasticity
leads
to
several
related
questions.
What
is
the
genetic
basis
of
the
reaction
norms,
and
are
there
specific
genes
for
their
shape?
What
is
the
significance
of
the
norm?
Is
it
a
consequence
of
internal
constraints
or
is
it
adaptive,
ie,
shaped
by
natural
selection?
It
is
generally
recognized
that,
before
developing
a
theory
on
the
evolution
of
reaction
norms,
many
more
empirical
data
are
needed,
relating
the
norms
with
ecological
adaptations
and
life
history
parameters.
In
this
respect,
it
will
be
easier
to
compare
different
species
(Harvey
and
Pagel,
1991)
since
a
larger
evolutionary
time
should
have
permitted
a
broader
divergence
of
the
norms,
especially
if
they
were
shaped by
natural
selection.
In
this
paper,
we
investigated
the
reaction
norms
of
size
traits
of
a
natural
population
of
D
simulans
from
France,
and
compared
the
results
with
those
obtained
for
the
sibling
D
melanogaster
from
the
same
locality
(David
et
al,
1994).
We
found
similarities
between
the
two
species
but,
more
interestingly,
numerous
significant
differences.
These
differences
demonstrate
that,
within
a
relatively
short
evolutionary
time
(about
2
million
years)
reaction
norms
have
diverged.
The
possible
adaptive
significance
of
these
variations
is
discussed.
MATERIALS
AND
METHODS
A
D
simulans
population
was
collected
in
a
vineyard
in
Pont
de
la
Maye
near
Bordeaux
(southern
France).
Variability
of
size
according
to
temperature
was
analyzed,
and
compared
to
a
population
of
D
melanogaster
collected
in
the
same
locality
and
previously
studied
(David
et
al,
1994).
The
isofemale
lines
method
was
used.
Wild
living
females
were
collected
with
banana
traps
and
used
to
establish
20
isofemale
lines,
and
ten
of
them
were
then
randomly
chosen.
For
each,
ten
pairs
of
the
first
laboratory
generation
were
used
as
parents.
They
oviposited
at
room
temperature
(20 !
2 °C)
for
about
half
a
day.
A
rich
feeding
medium,
based
on
killed
yeast,
was
used
for
the
development
(David
and
Clavel,
1965).
Such
a
food
prevents
crowding
effects
which
could
affect
fly
size.
Density
ranged
between
100
and
200
eggs
per
vial.
Vials
with
eggs
were
then
transferred
to
one
of
seven
experimental
constant
temperatures
(12,
14, 17,
21,
25,
28,
31 °C).
Measured
flies
thus
correspond
to
the
second
laboratory
generation.
Such
a
procedure
is
a
necessity
for
obtaining
enough
offspring
(see
Moreteau
et
al,
1995
for
discussion).
It
also
eliminates
possible
maternal
effects
and
provides
Hardy-
Weinberg
proportions
within
lines.
’
From
each
line
at
each
temperature,
ten
females
and
ten
males
were
randomly
taken.
Their
wing
and
thorax
lengths
were
measured
with
a
micrometer
in
a
binocular
microscope.
Total
wing
length
was
measured
from
the
articulation
on
the
side of
the
thorax
to
the
distal
tip.
Thorax
was
measured
on
a
left
side
view,
from
the
base
of
the
neck
to
the
tip
of
the
scutellum.
Analyses
were
made
directly
on
measurements
expressed
in
mm
x
100,
since
a
preliminary
analysis
with
log-
transformed
data
failed
to
show
any
scaling
effect.
Statistical
analyses
and
orthogonal
polynomial
adjustments
were
made
with
STATISTICA
software
(Statistica
Statsoft
Inc,
1993).
RESULTS
Variation
of
wing
and
thorax
length:
mean
of
the
ten
lines
Reaction
norms
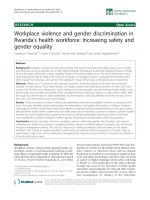
The
response
curves
(fig
1)
show
that
females
are
larger
than
males
in
both
species
and
that
D
melanogaster
is
larger
than
D
simulans.
In
both
species,
a
maximum
seems
to
exist
at
a
low
temperature.
A
steep
decrease
from
this
maximum
is
observed
when
temperature
increases,
and
a
shorter
one
when
temperature
decreases.
In
both
species,
significant
differences
exist
between
the
reaction
norms
of
wing
and
thorax.
Finally
D
simulans
seems
to
exhibit
its
maxima
for
both
traits
at
lower
temperatures
than
D
melanogaster.
This
problem
will
be
analyzed
further.
Sources
of
variation
Variations
were
investigated
simultaneously
on
the
two
traits
in
D
sim!alans
with
MANOVA
(table
I).
Sex
and
temperature
are
the
main
sources
of
variation.
A
highly
significant
line
effect
demonstrates
their
genetic
heterogeneity.
The
temperature-
line
interaction,
also
highly
significant,
shows
that
the
reaction
norms
of
the
differ-
ent
lines
are
not
parallel
but
exhibit
different
shapes.
Finally
the
sex-temperature
interaction
means
that
males
do
not
react
exactly
as
the
females
do.
These
results
are
similar
to
those
obtained
in
D
melanogaster
(David
et
al,
1994),
except
that
the
sex-line
interaction,
which
is
not
significant
in
D
simulans,
was
significant
in
D
melanogaster.
Correlation
between
sexes
and
sexual
dimorphism
Male-female
correlations
were
analyzed
considering
the
mean
values
of
each
line
(table
II).
There
was
no
temperature
effect
on
the
coefficients
of
correlation
(ANOVA,
not
shown).
Average
correlation
is
significantly
lower
for
wing
in
D
sim!lans
(0.66 !
0.07
versus
0.91
t
0.05
in
D
melanogaster),
but
similar
for
thorax
in
both
species
(0.71 !
0.06
and
0.76 !
0.16).
Sexual
dimorphism
was
calculated
at
each
temperature
and
for
each
line
as
the
female/male
ratio,
and
submitted
to
ANOVA
(not
shown).
For
wing
and
thorax,
only
the
temperature
effect
was
significant
while
the
line
effect
was
also
highly
significant
in
D
melanogaster.
A
nested
ANOVA
including
the
two
species
(not
shown)
demonstrated
highly
significant
species
differences.
The
two
traits
(wing
and
thorax)
provide
the
same
information.
In
the
two
species,
the
two
sexes
are
more
similar
when
reared
at
low
temperature
(temperature
effect).
The
female/male
ratio
of
D
simulans
is
characterized
by
lower
values
than
in
D
melanogaster
(species
effect,
see
David
et
al,
1994)
and
by
a
decrease
between
28
and
31 °C
(temperature-
species
interaction).
Covariation
between
wing
and
thorax;
the
wing/thorax
ratio
Wing—thorax
correlation
The
wing-thorax
correlation
was
investigated
at
the
individual
(=
within
lines)
and
at
the
line
(=
between
line
means)
levels
(table
III).
At
the
individual
level,
the
values
did
not
vary
significantly
with
temperature;
the
average
phenotypic
correlations
were
0.71
for
females
and
0.77
for
males
and
were
similar
to
those
obtained
in
D
melanogaster
(David
et
al,
1994).
For
the
lines,
average
values
were
superior
in
males
(0.79
versus
0.66)
but
not
significantly
so
(t
test,
not
shown).
In
D
!rcelanogaster,
values
were
quite
similar:
0.73
in
males
and
0.78
in
females.
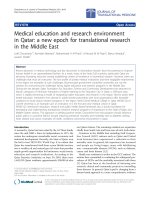
Wing/thorax
ratio
Average
curves
(fig
2)
have
a
general
decreasing
sigmoid
shape
in
the
two
species,
but
values
are
much
lower
in
D
simulans.
Statistical
analyses
(ANOVA,
not
shown)
demonstrated
highly
significant
effects
of
temperature
(which
explains
87%
of
total
variation)
and
lines.
Two-factor
interactions
were
significant
as
was
the
triple-factor
one.
Similar
conclusions
were
obtained
in
D
melanogaster
(David
et
al,
1994).
On
the
other
hand,
the
sex
effect
was
not
significant,
and
sexual
dimorphism
was
very
reduced
for
the
ratio
in
both
species
(see
fig
2).
Phenotypic
and
genetic
variability
Within-line
variability
For
easier
comparison
between
characters,
a
relative
measure
was
used:
the
coef-
ficient
of
variation
(CV)
(see
David
et
al,
1994).
A
major
difference
between
the
two
species
concerned
the
levels
of
variability.
Values
were
higher
in
D
simulans
at
high
temperatures
for
the
wing
(25-31
°C)
and
the
wing/thorax
ratio
(21-31
°C),
and
for
the
thorax
over
the
whole
temperature
range.
Mean
values
for
the
seven
temperatures
are,
respectively
for
wing,
thorax,
and
wing/thorax
ratio
2.16 ! 0.18,
2.40 !
0.21,
1.58 !
0.15
in
D
simulans,
and
1.97 !
0.17,
1.96 t
0.21,
1.40 t
0.15
in
D
melanogaster.
Between-line
variability
The
between-line
variance
was
analyzed
by
calculating
the
coefficient
of
intraclass
correlation
t,
for
each
sex
at
each
temperature,
which
is
an
indicator
of
isofemale
line
heritability
(Hoffmann
and
Parsons,
1988).
Values
of
t for
wing
and
thorax
are
given
in
table
IV.
For
wing
length,
a
marked
species
effect
is
observed,
with
very
different
overall
means:
0.14 !
0.03
for
females
and
0.22 !
0.05
for
males
in
D
simulans,
versus
0.58±0.03
and
0.51±0.03
in
D
melanogaster.
For
thorax
length,
values
are
more
similar:
0.25 ±0.06
(females)
and
0.30 +0.05
(males)
in
D
simulans
versus
0.37 t
0.04
and
0.30 !
0.04
in
D
melanogaster.
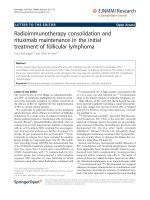
These
results
are
illustrated
in
figure
3
as
a
correlation
between
male
and
female
t
values.
In
D
simulans,
t values
for
the
two
traits
can
be
divided
into
two
groups:
high
values
(=
higher
heritability)
are
observed
at
medium
temperatures
(21,
25,
28 °C)
and
low
values
at
extreme
temperatures
(12,
14,
31 °C).
Means
of
these
two
groups
are
0.34 !
0.03
and
0.12 !
0.02
respectively
and
statistically
different
(Student’s
test,
not
shown).
In
D
melanogaster,
no
temperature
effect
was
observed
for
the
wing,
but
a
difference
between
high
and
low
temperatures
was
observed
for
the
thorax,
with
a
higher
genetic
variability
at
high
temperatures.
For
the
wing/thorax
ratio
(table
IV),
the
general
mean
calculated
on
14
obser-
vations
is
0.27 !
0.03,
much
lower
than
in
D
melanogaster
(0.57 !
0.02).
Analysis
of
the
shape
of
reaction
norms:
slope
variations
and
derivative
curves
Wing
and
thorax
For
each
isofemale
line,
length
variation
for
a
given
temperature
interval
allows
the
calculation
of
a
slope
(ie,
length
variation
per
degree),
by
a
linear
intrapolation.
Repeating
this
process
for
successive
intervals
produces
an
empirical
derivative
of
the
reaction
norm.
An
ANOVA
(not
shown)
was
conducted
on
the
slopes
in
D
simulans.
Results
were
similar
for
wing
and
thorax
with
a
very
significant
temperature
effect,
demon-
strating
nonlinear
norms.
Contrarily
to
D
melanogaster,
there
was
no
significant
sex
effect.
No
line
effect
was
detected,
as
in
the
sibling
species.
In
the
two
species
a
clear
line-temperature
interaction
shows
that
derivative
curves
have
different
shapes
among
lines.
Finally,
a
highly
significant
sex-temperature
interaction
is
present,
which
was
not
found
in
D
melanogaster.
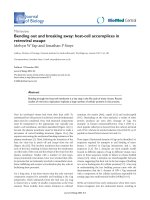
Average
curves
and
single
line
curves
are
given
in
figure
4,
for
wing
in
females
only.
In
the
two
species,
average
curves
(fig
4a)
show
a
progressive
decrease
from
positive
to
negative
values.
These
values
are
significantly
lower
at
low
temperature
in
D
simulans
and
not
significantly
greater
than
zero.
This
means
that
the
point
where
this
derivative
curve
crosses
the
null
line,
which
corresponds
to
the
temperature
of
maximum
size
(TMS),
is
far
less
obvious
in
D
simulans
than
in
D
melanogaster,
especially
for
the
thorax
(see
also
fig
1).
This
observation
is
confirmed
by
the
examination
of
the
curves
of
different
lines
(fig
4b).
Indeed
in
D
simulans,
wing
length
never
reached
the
zero
value
in
two
lines,
and
for
thorax
length
(not
shown)
the
slope
often
crossed
the
null
line
several
times.
Hence
in
D
simulans,
a
TMS
can
be
calculated
by
using
the
average
curves,
but
not
for
each
isofemale
line.
Average
curves
point
TMS
values
at
13.5
°C
for
wing
and
at
16 °C
for
thorax
in
D
simulans,
and
at
16
and
19 °C
respectively
in
D
melanogaster.
In
other
words
TMS
values
appear
to
be
lower
in
D
simulans
than
in
D
melanogaster.
For
comparing
the
two
traits,
slopes
were
standardized
and
expressed
as
a
percentage
of
the
mean
(curves
not
shown).
With
such
a
transformation
(David
et
al,
1994),
the
amplitudes
of
variation
for
the
two
traits
become
similar.
In
D
melanogaster
the
variation
range
was
greater:
the
overall
phenotypic
plasticity
seems
to
be
less
pronounced
in
D
simulans.
Wing/thorax
ratio
Slopes
of
the
wing/thorax
ratio
were
calculated
in
the
same
way
and
an
ANOVA
(not
shown)
demonstrated
a
major
effect
of
temperature,
a
low
sex
effect,
no
line
effect
but
a
significant
line-temperature
interaction.
Average
slope
variations
are
illustrated
in
figure
4c
for
females.
In
the
two
species,
average
derivative
curves
are
U-shaped
indicating
that
the
maximum
phenotypic
plasticity
occurs
at
intermediate
temperatures,
and
also
that
the
wing/thorax
ratio
varies
according
to
a
decreasing
sigmoid
curve
(see
fig
2).
A
regular
feature
in
D
sim-
ulans
is
that
the
derivative
curve
is
always
above
that
of
D
melanogaster.
Notably,
extreme
temperatures,
zero
values
correspond
to
the
fact
that
the
curve
of
the
wing/thorax
ratio
was
horizontal
(see
fig
2).
Moreover,
the
overall
amplitude
of
variation
is
larger
in
D
simulans.
Analysis
of
the
shape
of
the
reaction
norms:
polynomial
adjustments
Degree
of
polynomial
adjustments
After
a
theoretical
study
of
linear
norms,
Gavrilets
and
Scheiner
(1993)
suggested
that
nonlinear
norms
should
be
adjusted
to
second
degree
polynomials,
according
to
the
formula
P(t)
=
go
+
glt
+
g2t2
(if
we
are
dealing
with
temperature,
P(t)
is
the
phenotype
value
at
temperature
t).
The
authors
proposed
for
go,
the
intercept,
a
genetic
significance
fixing
a
basic
value
to
the
studied
trait,
while
gl,
the
slope,
could
be
a
genetic
parameter
of
adaptation
to
the
environment,
and
g2
a
genetic
parameter
of
curvature.
A
second
degree
polynomial
implies
that
the
derivative
curve
(ie,
slope
variation)
is
linear.
Such
was
not
the
case
for
the
three
traits
(see
fig
4),
so
that
at
least
a
third
degree
adjustment
should
be
used.
Incomplete
polynomials
could
also
be
used,
for
instance
with
no t
2
term.
The
validity
of
the
various
adjustments
was
assessed
by
adjusted
R2
values,
a
poor
adjustment
being
characterized
by
a
low
adjusted
R2.
A
third
degree
equation
proved
to
be
convenient
for
the
wing/thorax
ratio.
For
wing
and
thorax
lengths,
considering
the
similar
shapes
in
the
two
species,
we
imposed
a
constraint
on
the
adjustment,
ie,
the
existence
of
a
plausible
TMS
calculated
by
solving
the
equation
P’(t)
=
0.
For
third
and
fourth
degrees,
two
or
three
solutions
were
obtained
respectively,
which
needed
to
be
checked
to
know
which
one
corresponded
to
the
overall
maximum.
Finally,
for
overall
homogeneity,
all
the
wing
and
thorax
curves
were
adjusted
to
fourth
degree
polynomials,
even
those
which
were
compatible
with
third
degree
polynomials.
Also,
similar
adjustments
were
made
with
the
data
of
D
melanogaster
to
compare
the
two
species.
Such
adjustments
were
not
made
in
a
previous
paper
(David
et
al,
1994).
Wing
and
thorax
Even
with
fourth
degree
polynomials,
there
were
still
some
inadequate
TMS
values,
for
instance,
6.3
°C
for
a
male
wing.
This
often
occurred
from
an
abnormal
value
at
a
single
temperature
(=
rearing
accident?)
which
modified
the
adjustment
equation
and
thus
the
TMS.
Such
cases
represented
six
out
of
the
40
adjustments
made
on
D
simulans,
but
only
two
of
them
(for
male
thorax)
deviated
from
a
reasonable
value.
Choosing
a
fourth
power
polynomial
leads
to
much
more
heterogeneous g
i
parameters
than
an
adjustment
in
t2.
For
instance,
for
females
wing
in
D
simulans,
the
ten
go
values
ranged
from
62
to
69
with
the t
2
adjustment,
and
from —79
to
+93
with
the t
4
adjustment.
A
similar
conclusion
was
obtained
for
all
other
parameters.
Fortunately,
calculation
of
critical
points,
such
as
TMS
values,
provided
much
less
variable
values,
thus
confirming
previous
observations
on
ovariole
number
(Delpuech
et
al,
1995).
In
both
sexes
of
D
simulans
thorax
TMS
values
were
generally
higher
than
wing
ones,
as
in
D
melanogaster.
Also
significantly
higher
values
were
demonstrated
in
females
(ANOVA,
not
shown).
In
D
simulans
an
overlap
of
TMSs
of
the
two
traits
was
observed,
contrarily
to
D
melanogaster.
Mean
values
are
given
in
table
V
and
compared
to
those
of
D
melanogaster.
In
all
cases,
TMS
values
are
significantly
higher
for
the
latter
species.
Another
striking
species
difference
is
the
large
dispersal
among
lines
of
D
simulans
contrasting
with
a
better
homogeneity
in
D
melanogaster
(see
CVs
in
table
V).
Finally,
in
all
cases,
values
of
males
and
females
of
the
same
line
were
positively
correlated,
suggesting
that
they
provide,
at
least
in
part,
the
same
genetic
information.
As
in
David
et
al
(1994),
values
of
both
sexes
were
averaged
for
each
trait.
A
scatter
plot
of
wing
and
thorax
TMS
values
(fig
5)
clearly
contrasted
the
two
species.
Interestingly,
a
positive
correlation
is
found
in
D
melanogaster
while
a
non-significant
but
negative
correlation
is
found
for
the
eight
lines
of
D
simulans
(excluding
two
lines
with
aberrant
TMS
for
male
thorax).
The
between-line
heterogeneity
seems
to
be
mainly
due
to
thoracic
variations.
Taking
all
values
into
consideration,
average
curves
were
also
adjusted
to
the
fourth
degree
and
gave
TMS
values
of
13.5
°C
(females)
and
12.4
°C
(males)
for
the
wing,
and
of
16.1
°C
(females)
and
13.2
°C
(males)
for
the
thorax.
These
values
are
lower
than
in
D
melanogaster
(respectively
15.6
and
14.8
°C
for
wing,
19.2
and
17.6
°C
for
thorax).
They
are
close
to
the
mean
values
of
the
ten
lines
given
in
table
V
and
thus
characterize
the
species.
Interestingly,
the
gi
parameters
of
the
average
curves
were
similar
to
the
mean
values
of
the g
i
of
the
ten
lines.
Wing/thorax
ratio
The
gi
parameters
of
the
third
degree
polynomial
were
very
variable;
CVs
ranged
between
16.5
and
40%
for
the
four
female
coefficients
(mean
CV
=
28%)
and
between
22
and
65%
(mean
CV
=
46%)
for
males.
Curves
were
then
characterized
by
their
temperature
of
inflexion
point
(TIP),
ie,
the
temperature
where
the
second
derivative
becomes
null.
One
line
posed
a
problem
in
both
sexes
(aberrant
inflexion
point
value
because
of
a
hyperbolic
rather
than
sigmoid
shape)
and
was
excluded.
TIPs
(fig
6)
ranged
between
19.9
and
22.8
°C
(mean:
21.1 !
0.3
°C)
in
females
and
between
19.9
and
21.3
°C
(mean:
20.6 !
0.2
°C)
in
males.
There
was
neither
line
nor
sex
effect
(ANOVA,
not
shown).
In
D
melanogaster,
the
same
adjustments
produced
far
more
variable g
i
coeffi-
cients:
mean
CV
of
69%
in
females
and
92%
in
males,
ie,
more
than
twice
as
large
as
in
D
simulans.
This
also
resulted
in
a
much
greater
dispersal
of
the
TIP
values
of
the
different
lines
(see
fig
6).
Also
the
TIPs
were
on
the
average
significantly
lower
(ANOVA,
not
shown)
in
D
melanogaster
than
in
D
simulans:
19.0 f
0.9
°C
in
females
and
16.9
t
1.2
°C
in
males.
A
final
observation
was
that
for
a
given
temperature,
the
ratio
of
the
polynomi-
ally
adjusted
wing
value
to
the
polynomially
adjusted
thorax
value
was
the
same
as
the
polynomially
adjusted
wing/thorax
ratio.
DISCUSSION
AND
CONCLUSION
Our
results
need
to be
discussed
from
two
different
points
of
view:
a
methodological
approach
for
the
description
of
reaction
norms,
and
the
comparative
evolutionary
biology
of
the
two
sibling
species.
A
major,
still
unsolved
problem,
will
be
to
decide
which
species
is
better
adapted
to
a
warmer
environment.
How
should
empirical
reaction
norms
be
investigated?
In
Drosophila,
genetic
plasticity
of
quantitative
traits
such
as
wing
and
thorax
length
was
first
investigated
over
two
environments
(Scheiner
and
Lyman,
1989,
1991;
Scheiner
et
al,
1991;
Weber
and
Scheiner,
1992;
Scheiner,
1993a)
and
a
linear
model
was
used.
When
a
broad
range
of
environmental
conditions
is
used,
as
such
was
the
case
here,
most
reaction
norms
are,
however,
nonlinear
(David
et
al,
1983,
1994;
Gavrilets
and
Scheiner,
1993)
and
this
raises
a
major
problem:
what
is
the
best
way
to
describe
and
analyse
the
shape
of
the
curve?
Factors
of
variation
can
be
identified
with
ANOVA
or
MANOVA,
as
well
as
numerous
interactions
which
demonstrate,
for
example,
that
the
norms
significantly
differ
among
isofemale
lines
from
the
same
population.
More
precise
analyses
are
however
needed
for
describing
the
norms,
and
two
kinds
of
methods
may
be
used:
slope
variations
and
mathematical
adjustments.
Analysis
of
slope
variations
was
used
by
David
et
al
(1990)
for
demonstrating
different
pigmentation
norms
in
successive
abdominal
segments.
This
method
can
be
of
general
use
for
comparing
different
traits
or
species,
and
significant
differences
may
be
easily
demonstrated.
Also
the
overall
shape
of
the
reaction
norm
may
be
inferred
from
the
shape
of
its
derivative.
In
D
simulans,
and
contrarily
to
D
melanogaster
(David
et
al,
1994),
this
method
was
not
satisfactory
(problems
in
TMS
values
determination)
and
the
shapes
of
the
curves
had
to
be
studied
by
mathematical
adjustments.
An
adjustment
to
a
mathematical
model
should
be
a
better
method
but
numer-
ous
equations
could
be
chosen.
In
the
present
case
there
was
no
a
priori
reason
for
guiding
the
choice
and
thus
we
used
a
general
method,
ie,
a
polynomial
adjust-
ment,
as
suggested
by
Gavrilets
and
Scheiner
(1993)
and
Via
et
al
(1995).
Because
of
the
great
variability
among
the
polynomial
coefficients
of
various
lines,
it
ap-
peared
difficult
to
give
them
a
genetic
sense,
contrarily
to
what
has
been
suggested
(Gavrilets
and
Scheiner,
1993).
These
parameters
are,
however,
conveniently
used
for
calculating
critical
points
of
the
curves,
especially
the
temperature
of
maximum
size
(TMS)
for
wing
and
thorax
lengths
or
the
temperature
of
inflexion
point
(TIP)
for
the
wing/thorax
ratio.
Reaction
norms
appear
to
be
better
characterized
by
these
points,
which
are
less
variable
and
seem
to
have
a
biological
significance,
and
presumably
also
a
genetic
basis.
In
this
respect,
we
found
that
TMS
values
of
males
and
females
of
the
same
line
were
positively
correlated
in
both
species
and,
among
lines,
thorax
and
wing
TMS
values
were
also
correlated
in
D
melanogaster
(David
et
al,
1994).
Interestingly
in
D
melanogaster,
calculating
the
TMS
values
either
by
considering
slope
variations
or
with
polynomial
adjustments
provided
similar
re-
sults.
In
D
simulans,
fourth
power
polynomials
had
to
be
used
instead
of
quadratic
ones
for
a
better
characterization
of
TMS
values.
But
even
in
that
case,
the
adjust-
ment
could
not
be
performed
for
some
isofemale
lines.
This
may
reflect
either
true
genetic
peculiarities
of
these
lines
or
some
experimental
imprecisions.
This
prob-
lem
needs
further
investigation,
for
example,
by
analyzing
the
same
line
over
two
successive
generations.
Similarities
between
the
two
species
Similarities
between
closely
related
species
are
expected
because
of
phylogenetic
constraints
and
also
from
a
possible
similarity
of
their
ecological
niches
(Harvey
and
Pagel,
1991).
In
the
present
study,
numerous
similarities
were
observed,
which
are
briefly
summarized
below.
In
the
two
species
females
are
larger
than
males,
and
this
could
be
a
general
result
in
most
Drosophila.
The
female/male
ratio
gives
similar
data
for
wing
and
thorax
and
could
be
considered
as
a
good
measure
of
sexual
dimorphism.
This
dimorphism
is
a
phenotypically
plastic
trait
with
minimum
values
at
low
temperatures
in
both
species.
Reaction
norms
of
the
three
characters
(wing
and
thorax
length
and
wing/thorax
ratio)
are
nonlinear
and
present
the
same
sources
of
variation.
Wing
and
thorax
both
exhibit
a
maximum
at
low
temperature.
The
response
of
the
wing/thorax
ratio
to
temperature
is
a
sigmoid
decreasing
curve,
similar
for
both
sexes.
In
all
cases,
coefficients
of
intraclass
correlation
(t)
were
significantly
greater
than
zero,
demonstrating
(Hoffmann
and
Parsons,
1988)
a
high
heritability
of
the
traits.
Moreover
a
regular
line-temperature
interaction
indicates
significant
genetic
variations
in
the
shapes
of
reaction
norms
among
isofemale
lines.
The
within-line
CVs
varied
with
temperature
in
all
cases,
with
maxima
at
extreme
temperatures.
This
is
likely
due
to
an
increase
of
the
developmental
noise
under
stressful
conditions.
In
both
species,
the
wing/thorax
ratio
is
less
variable
(lower
CVs)
than
the
traits
themselves.
This
is
due
to
the
fact
that
wing
and
thorax
variations
are
correlated
at
the
individual
level.
Differences
between
the
two
sibling
species
Numerous
and
important
differences
were
found
between
the
two
species.
These
differences
demonstrate
that
canalization
during
development
is
not
very
strong
so
that
the
investigated
traits
could
diverge,
either
as
a
consequence
of
drift
or
of
ecological
adaptation.
As
already
known
from
numerous
observations
(see
Capy
et
al,
1993)
D
simulans
is
a
smaller
species.
We
may
argue
that
speciation
was
accompanied
by
size
gene
variations,
determining
the
position
of
the
reaction
norms
on
the
Y
axis.
Sexual
dimorphism
presented
different
reaction
norms
in
the
two
species.
It
is
unfortunate
that
we
do
not
have
a
convenient
evolutionary
theory
for
sexual
dimorphism
in
organisms
like
Drosophila
(Charnov,
1993).
Heritability
of
size
traits
was
different
in
the
two
species,
contrarily
to
what
was
found
by
Capy
et
al
(1994)
in
a
broad
survey
of
numerous
populations
reared
at
a
single
temperature
(25
°C).
In
our
study
of
two
sympatric
populations,
D
melanogaster
appeared
on
the
average
more
variable
than
D
simulans.
In
both
species
variations
of
isofemale
line
heritabilities
were
observed
according
to
developmental
temperature,
but
with
different
patterns
for
different
traits.
These
differences
are
difficult
to
interpret,
and
many
more
comparative
studies
should
be
undertaken.
At
the
within-line
level,
phenotypic
variability
exhibits
a
major
environmental
component
(Falconer,
1989)
and
thus
reflects
in
some
way
the
reactivity
of
individu-
als
to
minor
variations
in
culture
vials
(eg,
food
desiccation
or
larval
competition).
This
reactivity
may
be
estimated
by
considering
the
CVs.
D
simulans
appeared
more
variable
than
D
melanogaster
for
thorax
length
over
the
whole
temperature
range
and
for
the
other
two
traits
at
high
temperatures
only.
These
results
are
somewhat
surprising,
because
phenotypic
variability
was
previously
found
to
be
similar
in
the
two
species
(Capy
et
al,
1994).
A
problem
remains:
are
these
results
general
to
the
species
or
specific
to
the
studied
populations?
A
major
difference
between
the
two
species
concerns
their
TMS
values,
which
are
much
lower
in
D
simulans
than
in
D
melanogaster,
with
a
translation
toward
the
left
in
D
simulans.
As
the
thermal
ranges
are
about
the
same
in
the
two
species
(Cohet
et
al,
1980,
and
this
work),
it
was
more
difficult
to
calculate
TMS
values
in
D
simul
d
ns.
A
careful
analysis
showed
that,
besides
the
translation,
the
shapes
of
the
norms
were
somewhat
different
in
the
two
species.
Within
species,
a
significant
line-temperature
interaction
demonstrates
genetic
variations
in
the
curve
shapes.
Finally,
the
heterogeneity
of
TMS
values
between
lines
is
larger
in
D
simulans
than
in
D
melanogaster,
in
spite
of
a
lower
genetic
variability
within
each
temperature
in
the
former
species.
These
observations
argue
in
favor
of
a
genetic
regulation
of
the
reaction
norm
shape.
A
last
but
major
difference
between
the
two
species
concerns
the
wing/thorax
ratio
which
is
much
smaller
in
D
simulans
and
presents
higher
TIPs.
All
these
differences
support
a
general
trend:
the
more
the
two
species
are
compared,
the
more
they
appear
different
(see
Capy
et
al,
1993,
1994
for
discussion
and
references).
Reaction
norms
and
the
thermal
adaptation
of
the
two
species
Since
we
investigated
the
effects
of
developmental
temperature,
we
must
ask
the
question:
is
one
species
better
adapted
to
a
colder
or
warmer
climate?
Answering
this
question
is
difficult,
since
we
have
conflicting
observations.
Although
the
thermal
laboratory
ranges
are
similar
(12-31
°C)
in
the
two
species
(Cohet
et
al,
1980),
ecological
surveys
(Louis,
1983)
have
shown
that
D
simulans
is
generally
more
abundant
than
D
melanogaster
in
warm
temperate
and
subtropical
regions,
while
it
is
rare
or
even
absent
in
cold
regions
where
D
melanogaster
is
still
present.
These
observations
lead
to
the
classical
interpretation
that
D
simulans
is
less
tolerant
to
cold
than
D
melanogaster
(Parsons,
1983).
So
our
results
are
surprising.
Indeed,
even
if
the
biological
meaning
of
a
TMS
is
not
clearly
established,
we
expect
that
a
maximum
should
be
related
to
some
optimum
(Parker
and
Maynard-Smith,
1990;
Gabriel
and
Lynch,
1992;
Stearns,
1992).
Could
we
suppose,
then,
that
D
simulans
is
more
adapted
to
cold
than
D
melanogaster,
contrarily
to
what
was
believed
up
to
now,
and
that
reaction
norms
indicate
the
direction
of
adaptation?
In
fact,
this
hypothesis
is
not
unlikely.
Indeed,
from
an
ecological
point
of
view,
D
melanogaster
enters
human
buildings
where
it
is
protected
during
winter,
whereas
this
is
not
the
case
for
D
simulans
(Rouault
and
David,
1982).
So
the
latter
will
suffer
lower
temperatures
than
D
melanogaster
during
winter,
and
hence
will
be
selected
for
cold
tolerance.
Two
other
arguments
support
this
hypothesis.
Firstly,
in
D
melanogaster,
males
reared
at
12
or
13 °C
are
sterile,
whereas
this
is
not
the
case
in
D
simulans
(David,
unpublished
observations).
Secondly,
in
competition
experiments
at
25 °C,
D
melanogaster
generally
eliminates
D
simulans,
while
the
reverse
occurs
at
temperatures
below
20 °C
(Tantawy
and
Soliman,
1967;
Montchamp-Moreau,
1983).
Other
observations
suggest
however
a
reverse
interpretation.
The
wing/thorax
ratio,
which
is
inversely
proportional
to
wing
loading
and
wing
beat
frequency
(P6tavy
et
al,
1992,
1996)
decreases
with
temperature,
presumably
in
relation
with
a
better
muscular
efficiency
at
higher
temperature
(Reed
et
al,
1942).
In
other
words,
a
low
wing/thorax
ratio
could
indicate
a
warm
adapted
phenotype,
and
according
to
this
hypothesis,
D
simulans
would
be
adapted
to
a
warmer
climate
than
D
melanogaster.
Moreover
the
TIP,
which
corresponds
to
a
maximum
of
plasticity,
is
higher
in
D
simulans.
Even
if
the
possible
relationship
between
the
TIP
and
the
optimum
flight
temperature
remains
to
be
investigated,
this
could
support
the
hypothesis
of
a
better
adaptation
of
D
simulans
to
a
warmer
environment.
Molecular
studies
at
the
within-population
level
have
shown
that
D
simulans
was
generally
more
polymorphic
than
D
melanogaster
(Aquadro
et
al,
1988;
Begun
and
Aquadro,
1991;
Aquadro,
1992).
To
explain
this
observation,
the
former
authors
suggested
that
the
population
effective
number
is
higher
in
D
simulans,
due
to
a
higher
migration
rate
and
a
better
dispersal
capacity.
In
this
respect
the
lower
wing/thorax
ratio
in
D
simulans
could
be
more
a
dispersal
adaptation
than
a
thermal
adaptation.
However,
in
spite
of
numerous
studies
(Brodsky,
1994)
we
do
not
know
what
is
the
best
strategy
for
dispersal,
ie,
high
speed
correlated
with
high
wing
loading
and
relatively
short
flight
duration,
or
vice
versa.
In
conclusion,
the
two
sibling
species
which
are
increasingly
investigated
as
a
model
for
evolutionary
studies,
appear
very
different
when
more
thoroughly
analyzed,
and
interpretations
are
difficult.
Concerning
the
evolution
of
reaction
norms
and
their
possible relationship
with
thermal
adaptation,
further
comparative
studies
are
needed,
either
on
geographic
populations
of
the
two
sibling
species
and
on
other
Drosophila
species
clearly
adapted
to
warm
or
cold
climates.
ACKNOWLEDGMENT
This
work
benefited
from
a
grant
from
the
French
Minist6re
de
l’Environnement
(EGPN
committee)
to
JR
David.
REFERENCES
Aquadro
CF
(1992)
Why
is
the
genome
variable?
Insights
from
Drosophila.
Rends
Genet
8,
355-362
Aquadro
CF,
Lado
KM,
Noon
WA
(1988)
The
rosy
region
of
Drosophila
melanogaster
and
Drosophila
simulans.
I.
Contrasting
levels
of
naturally
occurring
DNA
restriction
map
variation
and
divergence.
Genetics
119,
875-888
Ashburner
M
(1989)
Drosophila:
A
Laboratory
Manual.
Cold
Spring
Harbor
Laboratory
Press
Atkinson
WD
(1979)
A
field
investigation
of
larval
competition
in
domestic
Drosophila.
J
Anim
Ecol 48,
91-102
Begun
DJ,
Aquadro
CF
(1991)
Molecular
population
genetics
of
the
distal
portion
of
the
X
chromosome
in
Drosophila:
evidence
for
genetic
hitchhiking
of
the
yellow-achaete
region.
Genetics
129,
1147-1158
Boulétreau
J
(1978)
Ovarian
activity
and
reproductive
potential
in
a
natural
population
of
Drosophila
melanogaster.
lE
cologia
(Berl)
35,
319-342
Brodsky
AK
(1994)
The
Evolution
of
Insect
Flight.
Oxford
Univ
Press,
Oxford
Bradshaw
AD
(1965)
Evolutionary
significance
of
phenotypic
plasticity
in
plants.
Adv
Genet
13,
115-155
Capy
P,
Pla
E,
David
JR
(1993)
Phenotypic
and
genetic
variability
of
morphometrical
traits
in
natural
populations
of
Drosophila
!nelanogaster
and
D
simulans.
I.
Geographic
variations.
Genet
Sel
Evol
25,
517-536
Capy
P,
Pla
E,
David
JR
(1994)
Phenotypic
and
genetic
variability
of
morphometrical
traits
in
natural
populations
of
Drosophila
melanogaster
and
D
simulans.
II.
Within-
population
variability.
Genet
Sel
Evol
26,
15-28
Cavicchi
SD,
Guerra
G,
Giorgi
G,
Pezzoli
C
(1985)
Temperature-related
divergence
in
experimental
populations
of
Drosophila
melanogaster.
I.
Genetic
and
developmental
basis
of
wing
size
and
shape
variation.
Genetics
109,
665-689
Charnov
EL
(1993)
Life
History
Invariants.
Oxford
Univ
Press,
Oxford
Cohet
Y,
Vouidibio
J,
David
JR
(1980)
Thermal
tolerance
and
geographic
distribution:
a
comparison
of
cosmopolitan
and
tropical
endemic
Drosophila
species.
J
Therm
Biol
5,
69-74
Coyne
JA,
Beecham
E
(1987)
Heritability
of
two
morphological
characters
within
and
among
natural
populations
of
Drosophila
melanogaster.
Genetics
117,
727-737
David
JR,
Clavel
MF
(1965)
Interaction
entre
le
genotype
et
le
milieu
d’61evage.
Consequences
sur
les
caract6ristiques
du
développement
de
la
drosophile.
Bull
Biol
Pr
Belg
99,
369-378
David
JR,
Capy
P
(1988)
Genetic
variation
of
Drosophila
melanogaster
natural
popula-
tions.
Trends
Genet
4,
106-111
David
JR,
Cohet
Y,
Fouillet
P,
Arens
MF
(1980)
Phenotypic
variability
of
wild
collected
Drosophila:
an
approach
toward
understanding
selective
pressures
in
natural
popula-
tions.
Egypt
J
Genet
Cytol
9,
51-66
David
JR,
Allemand
R,
Van
Herrewege
J,
Cohet
Y
(1983)
Ecophysiology:
abiotic
factors.
In:
The
Genetics
and
Biology
of
Drosophila
(M
Ashburner,
HL
Carson,
JN
Thompson,
eds),
Academic
Press,
London,
Vol
3D,
105-170
David
JR,
Capy
P,
Gauthier
JP
(1990)
Abdominal
pigmentation
and
growth
temperature
in
Drosophila
melanogaster.
similarities
and
differences
in
the
norms
of
reaction
of
successive
segments.
J
Evol
Biol
3,
429-445
David
JR,
Moreteau
B,
Gauthier
JP,
P6tavy
G,
Stockel
J,
Imasheva
AG
(1994)
Reaction
norms
of
size
characters
in
relation
to
growth
temperature
in
Drosophila
melanogaster.
an
isofemale
lines
analysis.
Genet
Sel
Evol
26,
229-251
De
Jong
G
(1990)
Genotype-by-environment
interaction
and
the
genetic
covariance
between
environments:
multilocus
genetics.
Genetica
81,
171-177
Delpuech
JM,
Moreteau
B,
Chiche
J,
Pla
E,
Vouidibio
J,
David
JR
(1995)
Phenotypic
plasticity
and
reaction
norms
in
temperate
and
tropical
populations
of
Drosophila
melanogaster:
ovarian
size
and
developmental
temperature.
Evolution
49,
670-675
Falconer
DS
(1989)
Introduction
of
Quantitative
Genetics,
third
edition,
Longman,
New
York
Gabriel
W,
Lynch
M
(1992)
The
selective
advantage
of
reaction
norms
for
environmental
tolerance.
J
Evol
Biol
5,
41-59
Gavrilets
S,
Scheiner
SM
(1993)
The
genetics
of
phenotypic
plasticity.
V.
Evolution
of
reaction
norm
shape.
J
Evol
Biol
6,
31-48
Harvey
P,
Pagel
MD
(1991)
The
Comparative
Method
in
Evolutionary
Biology.
Oxford
Univ
Press,
Oxford
Hoffmann
AA,
Parsons
PA
(1988)
The
analysis
of
quantitative
variation
in
natural
populations
with
isofemale
strains.
Genet
Sel
Evol 20,
87-98
Hoffmann
AA,
Parsons
PA
(1991)
Evolutionary
Genetics
and
Environmental
Stress.
Oxford
Univ
Press,
Oxford
Imasheva
AG,
Bubli
OA,
Lazebny
OE
(1994)
Variation
in
wing
length
in
Eurasian
natural
populations
of
Drosophila
melanogaster.
Heredity
72,
508-514
Louis
J
(1983)
Les
esp6ces
dominantes
de
drosophiles
dans
les
peuplements
de
I’Europe
atlantique
et
m6diterran6enne.
Ann
Soc
Entomol
F’r
19, 167-173
Montchamp-Moreau
C
(1983)
Interspecific
competition
between
Drosophila
melanogaster
and
Drosophila
simulans:
temperature
effect
on
competitive
ability
and
fitness
compo-
nents.
Genet
Sel
Evol 15,
367-378
Moreteau
B,
Capy
P,
Alonso-Moraga
A,
Munoz-Serrano
A,
Stockel
J,
David
JR
(1995)
Genetic
characterization
of
geographic
populations
using
morphometrical
traits
in
Drosophila
melanogaster.
isogroups
versus
isofemale
lines.
Genetica
96,
207-215
Parker
GA,
Maynard-Smith
J
(1990)
Optimality
theory
in
evolutionary
biology.
Nature
348,
27-33
Parsons
PA
(1983)
The
Evolutionary
Biology
of
Colonizing
Species.
Cambridge
Univ
Press,
Cambridge
Partridge
L,
Hoffman
A,
Jones
JS
(1987)
Male
size
and
mating
success
in
Drosophila
melanogaster
and
D
pseudoobscura
under
field
conditions.
Anim
Behav
35,
468-476
Partridge
L,
Barrie
B,
Fowler
K,
French
V
(1994)
Evolution
and
development
of
body
size
and
cell
size
in
Drosophila
melanogaster
in
response
to
temperature.
Evolution
48,
1269-1276
P6tavy
G,
Gauthier
JP,
David
JR
(1992)
Plasticit6
phénotypique
et
normes
de
reaction
de
la
taille
chez
Drosophila
melanogaster.
influence
de
la
temperature
de
d6veloppement.
Bull
Soc
Ecophysiol
17,
107-113
P6tavy
G,
David
JR,
Moreteau
B
(1996)
Les
variations
induites
par
la
temperature
sur
les
paramètres
de
taille
et
du
vol
des
drosophiles
sont-elles
adaptatives ?
Bull
Soc
Zool
Fr
(in
press)
Powell
JR
(1974)
Temperature-related
genetic
divergence
in
Drosophila
size.
J
Hered
65,
257-258
Rausher
MD
(1992)
The
measurement
of
selection
on
quantitative
traits:
biases
due
to
environmental
covariances
between
traits
and
fitness. Evolution
46,
616-626
Reed
SC,
Williams
CM,
Chadwick
LE
(1942)
Frequency
of
wing-beat
as
a
character
for
separating
species,
races
and
geographic
varieties
of
Drosophila.
Genetics
27,
349-361
Reiss
MJ
(1989)
The
Adlometry
of
Growth
and
Reproduction.
Cambridge
Univ
Press,
Cambridge
Rouault
J,
David
JR
(1982)
Evolutionary
biology
of
Drosophila
melanogaster
and
D
sim-
ulans:
a
behavioral
divergence
in
microhabitat
selection.
Acta
Œcol
Gener
3,
331-338
Scheiner
SM
(1993a)
Genetics
and
evolution
of
phenotypic
plasticity.
Ann
Rev
Ecol
Syst
24,
35-68
Scheiner
SM
(1993b)
Plasticity
as
a
selectable
trait:
reply
to
Via.
Am
Nat
142, 371-373
Scheiner
SM,
Lyman
RF
(1989)
The
genetics
of
phenotypic
plasticity.
I.
Heritability.
J
Evol
Biol
2,
95-107
Scheiner
SM,
Lyman
RF
(1991)
The
genetics
of
phenotypic
plasticity.
II.
Response
to
selection.
J
Evol
Biol
4,
23-50
Scheiner
SM,
Caplan
RL,
Lyman
RF
(1991)
The
genetics
of
phenotypic
plasticity.
III.
Genetic
correlations
and
fluctuating
asymmetries.
J
Evol
Biol
4,
51-68
STATISTICA
Statsoft
Inc
(1993)
Statistica,
release
l,.5.
Tulsa,
OK,
USA
Stearns
SC
(1992)
The
Evolution
of
Life
Histories.
Oxford
Univ
Press,
Oxford
Tantawy
AO,
Soliman
MH
(1967)
Studies
on
natural
populations
of
Drosophila.
VI.
Com-
petition
between
D
melanogaster
and
D
simulans.
Evolution
21,
34-40
Van
Tienderen
PH,
Koelewijn
HP
(1994)
Selection
on
reaction
norms,
genetic
correlations
and
constraints.
Genet
Res
64,
115-125
Via
S
(1993)
Adaptive
phenotypic
plasticity:
target
or
by-product
of
selection
in
a
variable
environment ?
Am
Nat
142,
352-365
Via
S
(1994)
The
evolution
of
phenotypic
plasticity:
what
do
we
really
know?
In:
Ecological
Genetics
(LA
Real,
ed),
Princeton
University
Press,
Chichester,
35-57
Via
S,
Lande
R
(1985)
Genotype!nvironment
interaction
and
the
evolution
of phenotypic
plasticity.
Evolution
39,
505-522
Via
S,
Lande
R
(1987)
Evolution
of
genetic
variability
in
a
spatially
heterogeneous
environment:
effects
of
genotype-environment
interaction.
Genet
Res
49,
147-156
Via
S,
Gomulkiewicz
R,
De
Jong
G,
Scheiner
SM,
Schlichting
CD,
Van
Tienderen
PH
(1995)
Adaptive
phenotypic
plasticity:
consensus
and
controversy.
Trends
Ecol
Evol
10,
212-217
Weber
SL,
Scheiner
SM
(1992)
The
genetics
of
phenotypic
plasticity.
IV.
Chromosomal
localization.
J
Evol
Biol
5,
109-120