Báo cáo sinh học: "Breeding value estimation with incomplete marker data" pptx
Bạn đang xem bản rút gọn của tài liệu. Xem và tải ngay bản đầy đủ của tài liệu tại đây (648.78 KB, 14 trang )
Original
article
Breeding
value
estimation
with
incomplete
marker
data
Marco
C.A.M.
Bink
Johan
A.M.
Van
Arendonk
a
Richard
L.
Quaas
a
Animal
Breeding
and
Genetics
Group,
Wageningen
Institute
of
Animal
Sciences,
Wageningen
Agricultural
University,
PO
Box
338,
6700
AH
Wageningen,
the
Netherlands
b
Department
of
Animal
Science,
Cornell
University,
Ithaca,
NY
14853,
USA
(Received
20
January
1997;
accepted
17
November
1997)
Abstract -
Incomplete
marker
data
prevent
application
of
marker-assisted
breeding
value
estimation
using
animal
model
BLUP.
We
describe
a
Gibbs
sampling
approach
for
Bayesian
estimation
of
breeding
values,
allowing
incomplete
information
on
a
single
marker
that
is
linked
to
a
quantitative
trait
locus.
Derivation
of
sampling
densities
for
marker
genotypes
is
emphasized,
because
reconsideration
of
the
gametic
relationship
matrix
structure
for
a
marked
quantitative
trait
locus
leads
to
simple
conditional
densities.
A
small
numerical
example
is
used to
validate
estimates
obtained
from
Gibbs
sampling.
Extension
and
application
of
the
presented
approach
in
livestock
populations
is
discussed.
©
Inra/Elsevier,
Paris
breeding
values
/
quantitative
trait
locus
/
incomplete
marker
data
/
Gibbs
sampling
Résumé -
Estimation
des
valeurs
génétiques
avec
information
incomplète
sur
les
marqueurs.
Un
typage
incomplet
pour
les
marqueurs
empêche
l’estimation
des
valeurs
génétiques
de
type
BLUP
utilisant
l’information
sur
les
marqueurs.
On
décrit
une
procédure
d’échantillonnage
de
Gibbs
pour
l’estimation
bayésienne
des
valeurs
génétiques
permettant
une
information
incomplète
pour
un
marqueur
unique
lié
à
un
locus
quantitatif.
On
développe
le
calcul
des
densités
de
probabilités
des
génotypes
au
marqueur
parce
que
la
reconsidération
de
la
structure
de
la
matrice
des
corrélations
gamétiques
pour
un
locus
quantitatif
marqué
conduit
à
des
densités
conditionnelles
simples.
Un
petit
exemple
numérique
est
donné
pour
valider
les
estimées
obtenues
par
échantillonnage
de
Gibbs.
L’application
de
l’approche
aux
populations
d’animaux
domestiques
est
discutée.
©
Inra/Elsevier,
Paris
valeur
génétique
/
locus
quantitatif
/
marqueurs
incomplets
/
échantillonnage
de
Gibbs
*
Correspondence
and
reprints
1.
INTRODUCTION
Identification
of
a
genetic
marker
closely
linked
to
a
gene
(or
a
cluster
of
genes)
affecting
a
quantitative
trait,
allows
more
accurate
selection
for
that
trait
[5].
The
possible
advantages
of
marker-assisted
genetic
evaluation
have
been
described
extensively
(e.g.
[13,
16,
17]).
Fernando
and
Grossman
[1]
demonstrated
how
best
linear
unbiased
prediction
(BLUP)
can
be
performed
when
data
are
available
on
a
single
marker
linked
to
quantitative
trait
locus
((aTL).
The
method
of
Fernando
and
Grossman
has
been
modified
for
including
multiple
unlinked
marked
QTL
[23],
a
different
method
of
assigning
QTL
effects
within
animals
[26];
and
marker
brackets
[5].
These
methods
are
efficient
when
marker
data
are
complete.
However,
in
practice,
incompleteness
of
marker
data
is
very
likely
because
it
is
expensive
and
often
impossible
(when
no
DNA
is
available)
to
obtain
marker
genotypes
for
all
animals
in
a
pedigree.
For
every
unmarked
animal,
several
marker
genotypes
can
be
fitted,
each
resulting
in
a
different
marker
genotype
configuration.
When
the
proportion
or
number
of
unmarked
animals
increases,
identification
of
each
possible
marker
genotype
con-
figuration
becomes
tedious
and
analytical
computation
of
likelihood
of
occurrence
of
these
configurations
becomes
impossible.
Gibbs
sampling
[3]
is
a
numerical
integration
method
which
provides
opportuni-
ties
to
solve
analytically
intractable
problems.
Applications
of
this
technique
have
recently
been
published
in
statistics
(e.g.
[2,
3])
as
well
as
animal
breeding
(e.g.
[18,
25]).
Janss
et
al.
[10]
successfully
applied
Gibbs
sampling
to
sample
genotypes
for
a
bi-allelic
major
gene,
in
the
absence
of
markers.
Sampling
genotypes
for
multiallelic
loci,
e.g.
genetic
markers,
may
lead
to
reducible
Gibbs
chains
[15,
20].
Thompson
[21]
summarizes
approaches
to
resolve
this
potential
reducibility
and
concludes
that
a
sampler
can
be
constructed
that
efficiently
samples
multiallelic
genotypes
on
a
large
pedigree.
The
objective
of
this
paper
is
to
describe
the
Gibbs
sampler
for
marker-assisted
breeding
value
estimation
for
situations
where
genotypes
for
a
single
marker
locus
are
unknown
for
some
individuals
in
the
pedigree.
Derivation
of
the
conditional,
discrete,
sampling
distributions
for
genotypes
at
the
marker
is
emphasized.
A
small
numerical
example
is
used
to
compare
estimates
from
Gibbs
sampling
to
true
posterior
mean
estimates.
Extension
and
application
of
our
method
are
discussed.
2. METHODOLOGY
2.1.
Model
and
priors
We
consider
inferences
about
model
parameters
for
a
mixed
inheritance
model
of
the
form
where
y
and
e
are
n-vectors
representing
observations
and
residual
errors,
(3
is
a
p-vector
of
’fixed
effects’,
u
and
v
are
q
and
2q-vectors
of
random
polygenic
and
QTL
effects,
respectively,
X
is
a
known n
x
p
matrix
of
full
column
rank,
and
Z
and
W are
known
n
x
q
and
n
x
2q
matrices,
respectively.
For
each
individual
we
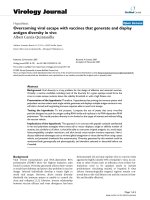
consider
three
random
genetic
effects,
i.e.
two
additive
effects
at
a
marked
QTL
(v!
and
v2,
see
figure
1)
and
a
residual
polygenic
effect
(u;).
Here
e
is
assumed
to
have
the
distribution
Nn
(O, 1
0
&dquo;;),
independently
of
(3,
u
and
v.
Also
u
is
taken
to
be
Nq(0,
AO,2
),
where
A
is
the
well-known
numerator
relationship
matrix.
Finally,
v
is
taken
to
be
N2q(OGQ!),
where
G
is
the
gametic
relationship
matrix
(2q
x
2q)
computed
from
pedigrees,
a
full
set
of
marker
genotypes
and
the
known
map
distance
between
marker
and
QTL
[26].
In
case
of
incomplete
marker
data,
we
augment
genotypes
for
ungenotyped
individuals.
We
then
denote
f
fi(
k)
and
G(
k)
as
the
marker
genotype
configuration
k
and
as
the
corresponding
gametic
relationship
matrix.
Further,
/3,
u,
v,
and
missing
marker
genotypes
are
assumed
to
be
independent,
a
priori.
We
assume
complete
knowledge
on
variance
components
and
map
distance
between
marker
and
QTL.
2.2.
Joint
posterior
density
and
full
conditional
distributions
for
location
parameters
The
conditional
density
of
y
given
/3,
u,
and
v
for
the
model
given
in
equation
(1)
is
proportional
to
exp{ -1/2a;
2
(y -
X,3 -
Zu -
Wv)’(y -
X/3 -
Zu -
Wv},
so
the
joint
posterior
density
is
given
by
The
joint
posterior
density
includes
a
summation
(n
c)
over
all
consistent
marker
genotype
configurations
(M(k
))-
In
the
derivation
of
the
sampling
densities
for
marked
QTL
effects,
however,
one
particular
marker
genotype
configuration,
m(
k
),
is
fixed.
The
summation
needs
to
be
considered
only
when
the
sampling
of
marker
genotypes
is
concerned.
To
implement
the
Gibbs
sampling
algorithm,
we
require
the
conditional
posterior
distributions
of
each
of
(3,
u,
and
v
given
the
remaining
parameters,
the
so-called
full
conditional
distributions,
which
are
as
follows
and
gametic
covariances
in
the
pedigree,
respectively.
Note
that
the
means
of
the
distributions
(3),
(4)
and
(5)
correspond
to
the
updates
obtained
when
mixed model
equations
are
solved
by
Gauss-Seidel
iteration.
Methods
for
sampling
from
these
distributions
are
well
known
(e.g.
[24,
25]).
2.3.
Sampling
densities
for
marker
genotypes
Suppose
m
is
the
current
vector
of
marker
genotypes,
some
observed
and
some
of
which
were
augmented
(e.g.
sampled
by
the
Gibbs
sampler).
Let
m-
i
denote
the
complete
set
except
for
the
ith
(ungenotyped)
individual,
and
let
gm
denote
a
particular
genotype
for
the
marker
locus.
Then
the
posterior
distribution
of
genotype
gm
is
the
product
of
two
factors
with,
where
G-
1
corresponds
to
marker
genotype
set
IM-i,
Mi
=
gm
).
Thus,
equation
(7)
shows
that
phenotypic
information
needed
for
sampling
new
genotypes
for
the
marker
is
present
in
the
vector
of
QTL
effects
(v).
Now,
it
suffices
to
compute
equation
(6)
for
all
possible
values
of
gm,
and
then
randomly
select
one
from
that
multinomial
distribution
[20].
In
practice
consid-
ering
only
those
gm
that
are
consistent
with
m-
i
and
Mendelian
inheritance
can
minimize
the,
computations.
Furthermore,
computations
can
be
simplified
because
&dquo;transmission
of
genes
from
parents
to
offspring
are
conditionally
independent
given
the
genotypes
of
the
parents&dquo;
[15].
Adapting
notation
from
Sheehan
and
Thomas
[15],
let
Sj
denote
the
set
of
mates
(spouses)
of
individual
i
and
0;,!
be
the
set
of
offspring
of
the
pair
i
and
j.
Furthermore,
the
parents
of
individual
i
are
denoted
by
s
(sire)
and
d
(dam).
Then,
equation
(6)
can
be
more
specifically
written
as
p(mi = gm, m-i IV, oV 2 ,Mobs, r)
When
parents
of
individual
i
are
not
known,
then
the
first
two
terms
on
the
right-hand
side
of
equation
(8)
are
replaced
by
x(m;),
which
represents
frequen-
cies
of
marker
genotypes
in
a
population.
The
probability
p(m;
=
9. 1 M
., Md
). cor-
responds
to
Mendelian
inheritance
rules
for
obtaining
marker
genotype
gi
given
parental
genotypes
ms
and
md,
similar
for
p(m
1
Im¡
=
gm, m!).
The
computation of
p{v
i
lv
d
,m¡,m
s
,m
d
,r}
(and
p{v
1
Iv¡,
Vj,m
i
,m
j
,m
1
,r})
can
efficiently
be
performed
by
utilizing
special
characteristics
of
the
matrix
G-
1.
Let
Qi
denote
a
gametic
contribution
matrix
relating
the
QTL
effects
of
individual
i
to
the
QTL
effects
of
its
parents.
The
matrix
Qi
is
2(i —
1)
x
2.
For
founder
animals,
matrix
Qi
is
simply
zero.
The
recursive
algorithm
to
compute
G-
1
of
Wang
et
al.
(1995,
equation
[18] )
can
be
rewritten
as
where
D¡1
=
(C; -
Q;G¡-
1Q
¡)-
1
(which
reduces
to
D¡
1
=
(C
i
-
QfG
i
-,Q
i
)-’
with
no
inbreeding),
Oi
is
a
2(q—i)
x
2
null
matrix.
The
off-diagonals
in
C;
equal
the
inbreeding
coefficient
at
the
marked
QTL
[26].
Equation
(8)
shows
the
similarity
to
Henderson’s
rules
for
A-
1
[6].
The
nonzero
elements
of
G-
1
pertaining
to
an
animal
arise
from
its
own
contribution
plus
those
of
its
offspring.
So,
when
sampling
the
ith
animal’s
marker
genotype,
only
those
contribution
matrices
need be
considered
that
contain
elements
pertaining
to
animal
i.
These
are
the
individual’s
own
contributions
and
those
of
its
progeny
when
i
appears
as
a
parent.
where
Vk
is
the
vector
of
animal
k’s
two
marked
QTL
effects,
and
Qp
denotes
the
rows
of
Qk
pertaining
to
P,
one
of
k’s
parents.
Again,
we
recognize
each
term
in
the
sum
is
the
kernel
of
a
(bivariate)
normal
which
is
pfv
i
Iv
s,
vd,
m¡,
ms,
md,
r}
or
p{v1Iv¡, Vj, m¡, mj,m1, r}.
2.4.
Running
the
Gibbs
sampling
The
Gibbs
sampler
is
used
to
obtain
a
sample
of
a
parameter
from
the
posterior
distribution
and
can
be
seen
as
a
chained
data
augmentation
algorithm
[19].
So,
one
augments
data
(y
and
mobs)
with
parameters
(0)
to
obtain,
for
example,
p(e
1
Ie
2
, ,
Od,
y).
For
the
purpose
of
breeding
value
estimation,
Gibbs
sampling
works
as
follows:
1)
set
arbitrary
initial
values
for
9!°!,
we
use
zeros
for
fixed
and
genetic
effects
and
for
each
unmarked
animal,
we
augment
a
genotype
that
is
consistent
with
pedigree,
Mendelian
inheritance,
and
observed
marker
data;
2)
sample
01’+ll
from
[3],
i
=
1, 2, ,
p;
for
fixed
effects,
[4],
i
=
p
+
1,
p
+
2, ,
p
+
q;
for
polygenic
effects,
[5],
i
=
p
+
q
+
1,
p
+
q
+
2, ,
p
+
q
+
2q;
for
marked
QTL
effects,
or
[6],
i
=
p
+
3q
+
1,
p
+
3q
+
2, ,
p
+
3q
+ t;
for
marker
genotypes,
and
replace
6!T!
with
ei
T+1
];
.
3)
repeat
2)
N
(length
of
chain)
times.
For
any
individual
parameter,
the
collection
of
n
values
can
be viewed
as
a
simulated
sample
from
the
appropriate
marginal
distribution.
This
sample
can
be
used
to
calculate
a
marginal
posterior
mean
or
to
estimate
the
marginal
posterior
distribution.
For
small
pedigrees
with
only
a
few
animals
missing
observed
marker
genotypes,
posterior
means
can
be
evaluated
directly
using
where
B*
is
a
fixed,
polygenic
or
marked
QTL
effect.
This
provides
a
criterion
to
compare
the
estimates
obtained
from
Gibbs
sampling.
3.
NUMERICAL
EXAMPLE
A
small
numerical
example
is
used
to
verify
the
use
of
the
Gibbs
sampler
to
obtain
posterior
mean
estimates
and
illustrate
the
effect
of
the
data
on
the
estimates
obtained
from
two
different
estimators,
i.e.
a
posterior
mean
and
the
well-known
BLUP
estimator
(by
solving
the
MME
given
in
the
Appendix).
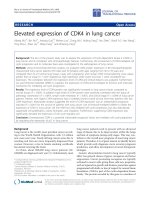
Pedigree
and
data
of
the
example
are
in
figure
2.
Both
sire
(01)
and
dam
(02)
have
observed
marker
genotypes,
AB
and
CD,
respectively,
but
do
not
have
phenotypes
observed.
Three
full
sibs
have
a
marker
genotype
BC
and
a
phenotype
+20
(denoted
FS
03,
04,
05);
three
other
full
sibs
have
a
marker
genotype
AD
and
a
phenotype
-20
(denoted
FS
06, 07,
08).
Both
animals
09
and
10
have
no
marker
genotypes
but
have
a
phenotype
+20
and
-20,
respectively.
Complete
knowledge
was
assumed
on
variance
components
and
recombination
rate
between
marker
and
MQTL
(table
I).
The
thinning
factor
in
Gibbs
sampling
chain
was
50
cycles
and
the
burn
in
period
was
twice
the
thinning
factor,
and
20 000
thinned
samples
were
used
for
analysis.
3.1.
Estimates
for
genetic
effects
The
posterior
estimates
obtained
from
Gibbs
sampling
were
similar
to
the
TRUE
posterior
estimates,
as
shown
in
table
11.
The
posterior
estimates
of
MQTL
effects
of
animals
09
and
10
(f0.70)
were
much
less
divergent
than
those
of
their
full
sibs
that
had
their
marker
genotypes
observed
(f2.48).
These
less
divergent
values
reflect
the
uncertainty
on
marker
genotypes
of
animals
09
and
10.
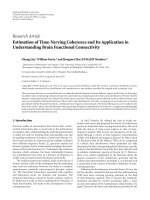
The
TRUE
and
GIBBS
posterior
densities
for
an
MQTL
effect
of
animal
09
were
also
very
similar
(figure
3).
The
posterior
variance
was
52.3,
which
was
larger
than
the
prior
variance
(ufl
=
50)
and
reveals
that
the
data
are
not
decreasing
the
prior
uncertainty
on
MQTL
effects
for
animals
09
and
10
in
this
situation.
For
the
other
full
sibs,
the
posterior
variance
was
47.02,
which
was
lower
than
the
prior
variance
because
segregation
of
MQTL
effects
was
known
with
higher
certainty,
i.e.
marker
genotypes
were
known.
The
BLUP
estimates
for
MQTL
effects
of
animal
09
and
10
were
equal
to
1/6
of
the
polygenic
effects
of
these
animals,
which
equaled
the
variance
ratio
of
the
MQTL
and
the
polygenes.
Marker
genotype
probabilities
In
the
following
marker
genotype
AB
represents
both
AB
and
BA.
In
the
latter
case,
alleles
for
both
marker
and
MQTL
are
reordered,
maintaining
linkage
between
marker
and
MQTL
alleles
within
an
animal.
So,
four
marker
genotypes
were
possible
for
animals
09
and
10
(table
III).
Based
on
pedigree
and
marker
data
solely,
each
of
these
four
genotypes
was
equally
likely
(prior
probability
=
0.25).
After
including
phenotypic
data,
(posterior)
probabilities
changed:
marker
genotype
BC
and
AD
for
animal
09
became
more
and
less
probable,
respectively.
The
reverse
holds
for
animal
10.
The
estimates
from
the
Gibbs
sampler
were
again
very
similar
to
the
TRUE
posterior
probabilities.
Complete
phenotypic
and
marker
information
on
six
full
sibs
gave
the
MQTL
effects
linked
to
marker
alleles
B and
C
positive
values
and
marker
alleles
A
and
D
negative
values.
Note
that
probabilities
(TRUE)
for
marker
genotypes
AC
and
BD
also
(slightly)
changed
after
considering
the
phenotypic
data.
4.
DISCUSSION
Marker-assisted
breeding
value
estimation
in
livestock
has
been
hampered
by
incomplete
marker
data.
Previously
described
methods
[1,
23,
26]
can
accommodate
ungenotyped
individuals
which
do
not
have
offspring
themselves
as
was
shown
by
Hoeschele
[7].
However,
they
do
not
provide
the
flexibility
to
incorporate
parents
with
unknown
genotypes
which
results
in
the
loss
of
information
for
estimating
marker
linked
effects.
The
described
Gibbs
sampling
algorithm
now
provides
this
required
flexibility.
The
innovative
step
in
our
approach
is
the
sampling
of
genotypes
for
a
marker
locus
that
is
closely
linked
to
QTL
with
normally
distributed
allelic
effects.
Normality
of
QTL
effects
is
a
robust
assumption
to
allow
segregation
of
many
alleles
throughout
a
population
and
allow
changes
in
allelic
effects
over
generations,
e.g.
due
to
mutations
and
interactions
with
environments
[8].
In
sampling
missing
genotypes
information
from
marker
genotypes
as
well
as
phenotypes
of
animals
in
the
pedigree
are
used.
Jansen
et
al.
[9]
indicate
that,
as
a
result
of
the
use
of
phenotypic
information,
unbiased
estimates
of
effects
at
the
QTL
can
be
obtained
in
situations
where
animals
have
been
selectively
genotyped.
In
this
paper
we
have
concentrated
on
the
use
of
information
from
a
single
marker
locus.
Using
information
from
multiple
linked
markers
can
increase
accuracy
of
predicting
genetic
effects
at
the
QTL.
The
principles
applied
here
have
been
extended
to
situations
where
genotypes
for
all
the
linked
markers
are
known
for
all
individuals
[5,
22].
In
order
to
incorporate
individuals
with
unknown
genotypes,
the
method
presented
in
this
paper
needs
to
be extended
to
a
multiple
marker
situation.
In
extending
the
method
to
multiple
markers,
the
problem
of
reducibility
deserves
special
attention.
Reducibility
of
Gibbs
chains
can
arise
when
sampling
genotypes
for
a
polymor-
phic
locus
with
more
than
two
alleles
[20].
The
reducibility
problems
will
become
more
severe
when
sampling
genotypes
for
multiple
linked
markers.
Thompson
[21]
suggested
several,
workable,
approaches
to
guarantee
irreducibility
of
the
Gibbs
chain.
These
approaches
make
use
of
Metropolis-coupled
samplers
[11],
importance
sampling,
with
0/1
weights
[15],
and
’heating’
in
the
Metropolis-Hastings
steps
[12].
Alternatively,
Jansen
et
al.
[9]
sampled
IBD
values
for
all
marker
loci
indicating
parental
origin
of
alleles
instead
of
actual
alleles
to
avoid
the
reducibility
problem.
In
extending
the
method
to
multiple
linked
markers,
attention
also
needs
to
be
paid
to
an
efficient
scheme
for
haplotypes
or
genotypes
at
the
linked
loci.
Updating
of
genotypes
at
closely
linked
loci
will
be
more
efficient
when
genotypes
at
the
linked
loci
are
updated
together
(’in
blocks’)
in
order
to
reduce
auto-correlation
in
the
Gibbs
sampler
[10].
For
posterior
inferences
on
the
breeding
value
of
an
animal
a
minimum
of
100
effective
samples
is
needed.
In
the
numerical
example
this
minimum
would
correspond
to
a
chain
of
5 000
cycles
which
required
8
s
of
CPU
at
a
HP9000
K260
server.
It
has
been
found
that
computing
requirements
increase
more
or
less
linearly
with
the
number
of
animals
[10].
The
presented
method
can
be
applied
to
data
originating
from
nucleus
herds
which
comprise
the
relatively
small
number
of
genetically
superior
animals
from
the
population.
In
a
marker-assisted
selection
scheme
marker
genotypes
will
be
collected
largely
on
these
animals,
with
sufficient
animals
having
marker
genotypes
observed
to
improve
selection
of
superior
individuals.
Straightforward
application
in
large
commercial
populations
with
thousands
of
marker
genotypes
missing,
is
not
a
valid
option
because
of
computational
requirements
of
Markov
chain
Monte
Carlo
(MCMC)
algorithms
such
as
Gibbs
sampling.
Hybrid
schemes
will
need
to
be
developed
to
incorporate
information
from
the
commercial
population
into
the
marker-assisted
prediction
of
breeding
values
of
nucleus
animals.
Similar
schemes
have
been
implemented
to
incorporate
foreign
information
into
national
evaluations
in
dairy
cattle.
Our
Bayesian
approach
can
also
be
considered
as
a
first
step
towards
a
MCMC
algorithm,
not
necessarily
Gibbs
sampling,
that
can
also
estimate
hyper
parame-
ters,
which
were
held
constant
in
this
study.
The
next
step,
therefore,
comprises
estimation
of
variance
components,
both
marked
QTL
and
polygenic,
given
a
fixed
map
position
of
the
QTL.
And,
eventually,
one
could
estimate
the
most
likely
po-
sition
of
the
QTL
within
a
linkage
map
containing
multiple
markers.
The
complete
MCMC
algorithm
can
then
be
used
for
the
analysis
in
QTL
mapping
experiments
with
complex
pedigree
structures,
such
as
(grand-)
daughter
designs,
in
outbred
populations.
ACKNOWLEDGEMENTS
Valuable
suggestions
by
S.
van
der
Beek
and
anonymous
reviewers
are
gratefully
acknowledged.
The
financial
support
of
Holland
Genetics
is
highly
appreciated.
REFERENCES
[1]
Fernando
R.L.,
Grossman
M.,
Marker-assisted
selection
using
best
linear
unbiased
prediction,
Genet.
Sel.
Evol.
21
(1989)
467-477.
[2]
Gelfand
A.E.,
Smith
A.F.M.,
Sampling-based
approaches
to
calculating
marginal
densities,
J.
Am.
Stat.
Assoc.
85
(1990)
398-409.
[3]
Geman
S.,
Geman
D.,
Stochastic
relaxation,
Gibbs
distributions
and
the
Bayesian
restoration
of
images,
IEEE
Trans
Pattern
Anal
Machine
Intelligence
6
(1984)
721-
741.
[4]
Geyer
C.J.,
A
practical
guide
to
Markov
chain
Monte
Carlo,
Stat.
Sci.
72
(1992)
320-339.
[5]
Goddard
M.E.,
A
mixed model
for
analysis
of
data
on
multiple
genetic
markers,
Theor.
Appl.
Genet.
83
(1992)
878-886.
[6]
Henderson
C.R.,
A
simple
method
for
computing
the
inverse
of
a
numerator
rela-
tionship
matrix
used
in
prediction
of
breeding
values,
Biometrics
32
(1976)
69-83.
[7]
Hoeschele
I.,
Elimination
of
quantitative
trait
loci
equations
in
an
animal
model
incorporating
genetic
marker
data,
J.
Dairy
Sci.
76
(1993)
1693-1713.
[8]
Jansen
R.C.,
Complex
plant
traits:
time
for
polygenic
analysis,
Trends
Plant
Sci.
3
(1996)
73-103.
[9]
Jansen
R.C.,
Johnson
D.L.,
Van
Arendonk
J.A.M.,
A
mixture
model
approach
to
the
mapping
if
quantitative
trait
loci
in
complex
populations
with
an
application
to
multiple
cattle
families,
Genetics
(1997)
(in
press).
[10]
Janss
L.L.G.,
Thompson
R.,
Van
Arendonk
J.A.M.,
(1995)
Application
of
Gibbs
sampling
for
inference
in
a
mixed
major
gene-polygenic
inheritance
model
in
animal
populations,
Theor.
Appl.
Genet.
91
(1995)
1137-1147.
[11]
Lin
S.,
Markov
chain
Monte
Carlo
estimates
of
probabilities
on
complex
structures,
Ph.D.
dissertation,
University
of
Washington.
[12]
Lin
S.,
Thompson
E.A.,
Wijsman
E.,
Achieving
irreducibility
of
the
Markov
chain
Monte
Carlo
method
applied
to
pedigree
data,
IMA
J.
Math.
Appl.
Med.
Biol.
10
(1993)
1-17.
[13]
Meuwissen
T.H.E.,
VanArendonk
J.A.M.,
Potential
improvements
in
rate
of
genetic
gain
from
marker-assisted
selection
in
dairy
cattle
breeding
schemes,
J.
Dairy
Sci.
75
(1992)
1651-1659.
[14]
Schaeffer
L.R.,
Kennedy
B.W.,
Computing
strategies
for
solving
mixed model
equations,
J.
Dairy
Sci.
69
(1986)
575-579.
[15]
Sheehan
N.,
Thomas
A.,
On
the
irreducibility
of
a
Markov
chain
defined
on
a
space
of
genotype
configurations
by
a
sampling
scheme,
Biometrics
49
(1993)
163-175.
[16]
Smith
C.,
Simpson
S.P.,
(1986)
The
use
of
genetic
polymorphisms
in
livestock
improvement,
J.
Anim.
Breed.
Genet.
103
(1986)
205-217.
[17]
Soller
M.,
Beckmann
J.S.,
Restricted
fragment
length
polymorphisms
and
genetic
improvement,
in:
Proc.
2nd
World
Congress
Genet.
Appl.
Livest.
Prod.,
Madrid,
Editorial
Garsi,
Madrid,
Spain,
vol.
6,
1982,
pp.
396-404.
[18]
Sorensen
D.A.,
Wang
C.S.,
Jensen
J.,
Gianola
D.,
Bayesian
analysis
of
genetic
change
due
to
selection
using
Gibbs
sampling,
Genet.
Sel.
Evol.
26
(1994)
333-360.
[19]
Tanner
M.A.,
Tools
for
Statistical
Inference,
Springer-Verlag,
New
York,
NY,
1993.
[20]
Thomas
D.C.,
Cortessis
V.,
A
Gibbs
sampling
approach
to
linkage
analysis,
Hum.
Hered.
42
(1992)
63-76.
[21]
Thompson
E.A.,
Monte
Carlo
likelihood
in
genetic
mapping.
Stat.
Sci.
9
(1994)
355-
366.
[22]
Uimari
P.,
Thaller
G.,
Hoeschele
I.,
The
use
of
multiple
markers
in
a
Bayesian
method
for
mapping
quantitative
trait
loci,
Genetics
143
(1996)
1831-1842.
[23]
VanArendonk
J.A.M.,
Tier
B.,
Kinghorn
B.P.,
Use
of
multiple
genetic
markers
in
prediction
of
breeding
values,
Genetics
137
(1994)
319-329.
[24]
VanTassell
C.P.,
Casella
G.,
Pollak
E.J.,
Effects
of
selection
on
estimates
of
variance
components
using
Gibbs
sampling
and
restricted
maximum
likelihood,
J.
Dairy
Sci.
78
(1995)
678-692.
[25]
Wang
C.S.,
Rutledge
J.J.,
Gianola
D.,
(1993)
Marginal
inferences
about
variance
components
in
a
mixed
linear
model
using
Gibbs
sampling,
Genet.
Sel.
Evol.
25
(1993)
41-62.
[26]
Wang
T.,
Fernando
R.L.,
van
der
Beek
S.,
Grossman
M.,
Van
Arendonk
J.A.M.,
Covariance
between
relatives
for
a
marked
quantitative
trait
locus,
Genet.
Sel.
Evol.
27
(1995)
251-272.
Al.
APPENDIX
A1.1.
Computation
of
average
G
with
incomplete
marker
data
Wang
et
al.
[26]
suggested
computing
an
average
G,
here
denoted
G,
as
where
G(
k)
is
the
gametic
relationship
matrix
given
a
particular
marker
genotype
configuration
m(
k
);
and
p(
M(k
)lM
ob,)
is
the
probability
of
m(
k)
given
mobs.
This
equation
is
not
conditioned
on
phenotypic
information.
Al.2.
Marker-assisted
best
linear
unbiased
prediction
of
breeding
values
Mixed
model
equations
(MME)
to
obtain
BLUE
for
fixed
effects
and
BLUP
for
random
effects
are
where
a&dquo;
=
Qe !Qu,
a&dquo;
=
Qe !Q!
and
G
are
all
known.
Solutions
can
be
obtained
by
iteration
on
the
data
[14].
These
equations
can
be
used
in
three
situations.
First,
G
is
unique
(complete
marker
data).
Second,
with
missing
markers,
a
linear
estimator
is
obtained
by
taking
G
=
G.
Third,
with
G
=
G!!!,
they
are
used
to
compute
E!BIG(k), !u! !!, ae ! Y)!