Báo cáo sinh học: " Demographic characterization, inbreeding and maintenance of genetic diversity in the endangered " ppsx
Bạn đang xem bản rút gọn của tài liệu. Xem và tải ngay bản đầy đủ của tài liệu tại đây (386.64 KB, 7 trang )
Note
Demographic
characterization,
inbreeding
and
maintenance
of
genetic
diversity
in
the
endangered
Catalonian
donkey
breed
Pilar
Folch
Jordi
Jordana*
Unitat
de
Genètica
i
Millora
Animal,
Departament
de
Patologia
i
Producciô
Animals,
Facultat
de
Veterinària,
Universitat
Autonoma
de
Barcelona,
08193-Bellaterra,
Barcelona,
Spain
(Received
20
November
1997;
accepted
1
March
1998)
Abstract -
This
study
characterizes
the
demographic
and
genealogical
structure
of
a
limited-size
population
in
danger
of
extinction:
the
Catalonian
donkey
breed.
The
purpose
of
this
paper
is
to
establish
the
most
suitable
breeding
criteria
and
guidelines
to
achieve
the
’Programme
of
Conservation
and
Maintenance
of
Animal
Genetic
Resources’
in
this
population.
The
two
main
objectives
proposed
are:
1)
to
maintain
the
maximum
genetic
diversity,
with
2)
the
minimum
possible
consanguinity
increase
per
generation.
A
population
size
of
109
animals
of
both
sexes,
44
males
and
65
females,
was
analysed.
The
pedigree
information
was
used to
calculate
the
following
items:
generation
length
(L),
variances
of
family
size
(o,2) k ,
effective
population
size
(N
e
),
inbreeding
coefficient
(F)
and
probability
of
gene
origin.
The
results
obtained
and
breeding
criteria
to
be
followed
are
discussed.
The
correct
mating
policy
between
a
stallion
and
a
jenny
would
be
that
which
would
maximize
the
so-called
genetic
conservation
index
and
minimize
the
inbreeding
coefficient
of
the
hypothetical
offspring
of
the
couple.
©
Inra/Elsevier,
Paris
donkey
/
endangered
breed
/
pedigree
analysis
/
demographic
structure
/
genetic
diversity
maintenance
*
Correspondence
and
reprints
E-mail:
Résumé -
Caractérisation
démographique,
consanguinité
et
entretien
de
la
varia-
bilité
génétique
de
la
race
asine
Catalane.
Le
présent
travail
caractérise
la
structure
démographique
et
généalogique
d’une
population
en
voie
d’extinction :
la
race
asine
Catalane.
La
finalité
de
ce
travail
a
été
d’établir
les
critères
et
normes
de
reproduction
les
plus
appropriés
pour
développer
le
«
programme
de
conservation
et
entretien
des
ressources
génétiques
animales»
pour
cette
population.
Les
deux
principaux
objectifs
proposés
sont :
1)
l’entretien
d’une
quantité
maximale
de
diversité
génétique,
avec
2)
le
minimum
d’augmentation
possible
de
consanguinité
par
génération.
La
taille
de
la
population
analysée
a
été
de
109
animaux
des
deux
sexes,
44
mâles
et
65
femelles.
L’information
qui
provient
des
généalogies
a
été
utilisée
pour
calculer
les
paramètres
suivants :
intervalles
entres
générations
(L),
variance
pour
la
taille
de
la
famille
(a!),
taille
effective
de
la
population
(Ne),
coefficient
de
consanguinité
(F)
et
probabilité
de
l’origine
des
gènes.
Les
résultats
obtenus,
ainsi
que
les
normes
reproductives
seront
analysés,
considérant
qu’un
accouplement
optimal
entre
un
étalon
et
une
ânesse
sera
celui
qui
maximise
le
dénommé
Indice
de
Conservation
Génétique
et
celui
qui
minimise
la
consanguinité
d’un
descendant
hypothétique
du
couple
en
question.
©
Inra/Elsevier,
Paris
âne
/
race
en
voie
d’extinction
/
analyse
de
généalogies
/
structure
démographique
/
entretien
de
la
variabilité
génétique
1.
INTRODUCTION
The
Catalonian
donkey
is
a
local
tame
donkey
breed
located
in
several
Pyrenean
and
pre-Pyrenean
regions
of
the
Catalonian
area
of
northeast
Spain.
This
popula-
tion
is
in
danger
of
extinction.
The
last
census
carried
out
only
slightly
surpassed
100
animals,
a
third
of
which
were
males
(10!.
Following
the
guidelines
proposed
by
the
FAO,
investigations
were
first
carried
out
on
morphological
traits
(4!,
on
haematological
and
clinical
biochemical
param-
eters
[7,
11]
and
on
genetic
loci
[5,
6!,
to
characterize
this
breed.
A
small
and
homogeneous
population,
has
important
problems
derived
from
inbreeding.
Therefore,
the
two
priorities
accounted
for
in
the
Catalonian
donkey
breed
Conservation
Programme
are:
1)
keeping
the
maximum
genetic
diversity,
2)
obtaining
the
lowest
possible
inbreeding
rate
per
generation.
The
purpose
of
this
paper
is
to
characterize
demography
and
to
analyse
the
pedigree
structure
of
this
population
in
danger
of
extinction,
to
set
up
the
breeding
criteria
to
fit
to
these
objectives.
2.
MATERIALS
AND
METHODS
The
data
file
information
corresponds
to
the
period
1979-1996.
The
breed
population
analysed
consisted
of
109
individuals,
distributed
between
39
foals
of
both
sexes
(<
3
years
old;
18
males
and
21
females)
and
70
adults:
26
males
(aged
3-14)
and
44
females
(aged
3-18).
The
pedigree
information
was
used
to
compute:
generation
length
(L),
variances
of
family
size
(o, 2),
effective
population
size
(N
e
),
inbreeding
coefficient
and
probability
of
gene
origin.
The
Ne
computation
was
obtained
from
the
formula
proposed
by
[9]
where
Nm
and
Nf
are,
respectively,
adults
males
and
females
with
offspring
and
L
as
the
average
of
the
generation
intervals
calculated
for
the
four
pathways.
Let
cov!I&dquo;m,n,f)
be
the
covariance
of
the
number
of
male
and
female
progeny
from
each
male
parent
and
cov(
f
,,,,ff)
from
each
female
parent.
The
variances
in
family
size
are
expressed
as:
<7!;
u£!;
afm !
!ff -
The
inbreeding
coefficient
(F)
was
calculated
for
every
animal
in
the
file,
using
a
computer
programme
based
on
Quaas-Henderson’s
algorithm
[8,
16).
The
evolution
of
the
average
coefficient
of
inbreeding
was
observed
over
year
of
birth
and
summarized
by
the
linear
regression
over
years.
The
probability
of
gene
origin
was
calculated
from
the
genetic
contributions
of
the
founders
of
the
current
population
[2,
3,
13,
15].
A
founder
is
defined
as
an
ancestor
with
unknown
parents
in
the
file.
This
effective
number
of
founders
( f
e)
is
equivalent
to
the
so-called
Genetic
Conservation
Index
(GCI)
proposed
by
Alderson
[1],
which shows
the
relative
capacity
of
an
individual
to
retain
the
ancestral
genetic
variability
where
each
founder k
can
be
characterized
by
the
expected
contribution
q!
to
the
gene
pool
considered;
fe
can
be
calculated
for
an
individual
or
a
group
of
individuals
(by
definition,
the
sum
of q
kS
is
equal
to
one).
If
the
founder
contributions
are
balan-
ced,
the
effective
number
of
founders
is
equal
to
f.
Otherwise,
f
is
lower
[2,
3!.
3.
RESULTS
AND
DISCUSSION
3.1.
Demographic
parameters
When
using
the
formula
proposed
by
Hill
!9!,
an
Ne
value
of
59.97
was
obtained.
If
our
objective
is
to
try
to
maximize
this
Ne,
i.e.
to
minimize
the
inbreeding
increase
per
generation
(OF),
then
we
can
see
according
to
equation
(1),
that
a
series
of
factors
exists
that
would
allow
us
to
increase
this
Ne.
3.1.1.
Generation
interval
The
average
generation
interval
between
parents
and
offspring
was
6.74 f
1.66
years,
the
maternal
interval
(7.32 t
2.95)
being
larger
than
the
paternal
one
(6.16 !
1.55),
even
though
the
differences
between
both
were
not
statistically
sig-
nificant.
The
maternal
interval
was
more
variable
than
the
paternal
one
because
their
variation
coefficients
(CV)
were,
respectively,
40.3
%
and
25.1
%.
The
gen-
eration
interval
according
to
the
four
gene
transmission
pathways
were
the
fol-
lowing:
L
ss
=
6.15 !
1.90;
L
sd
=
6.17 !
2.45;
L
dd
=
7.42 !
4.75;
L
ds
=
7.21
3.51,
with
s
=
sires
and
d
=
dams.
The
average
age
of
the
parents
at
birth
of
their
first
offspring
was
4.23 t
1.57
years
among
stallions
and
5.37 :I:
3.89
years
among
jennies.
The
average
reproduc-
tive
life
was
2.85
t
3.42
and
2.77
t
3.37
years,
respectively.
Despite
this,
there
was
no
significant
differences
between
sex,
which
would
indicate
that
the
annual
re-
placement
rates
are
similar
among
the
male
and
female
subpopulations.
The
generation
lengths
are
determined
by
age
at
first
mating
and
by
reproductive
life.
These
parameters
and
the
total
offspring
that
parents
leave
to
the
next
generation
are
directly
affected
by
the
breeding
policy.
On
the
other
hand,
the
effective
population
size
would
increase
if
these
generation
intervals
would
rise
(9!.
Generation
intervals
which
have
been
described
in
horse
breeds
by
other
authors,
since
there
are
not
any
references
in
the
donkey
species,
show
a
L
value
much
greater
than
ours.
For
example,
both
Moureaux
et
al.
(15!,
analysing
French
race
and
riding
horses
and
Klemetsdal
(12!,
analysing
Norwegian
trotters,
obtained
an
average
L
of
10-12
years.
According
to
Moureaux
et
al.
in
their
study,
the
reason
for
their
intervals
being
higher
than
ours,
is
due
to
the
fact
that
the
animals
analysed
were
to
be
exploited
for
sport.
This
means
that
the
sporting
career
preceded
the
breeding
life,
whereas
the
donkeys
analysed
here
are
only
used
for
breeding.
It
could
possibly
be
the
reason
why
no
significant
differences
have
been
found
between
the
generation
lengths
of
males
and
females
in
our
breed.
3.1.2.
Family
size
variances
Progeny
size
was
4.0
t
4.82
per
stallion
and
2.28 !
1.34
per
jenny.
The
family
size
distribution
for
males
is
more
unbalanced
than
in
females
because
there
are
a
few
stallions
with
more
than
ten
offspring,
approximately
three
times
as
many
as
the
average
number
of
offspring
per
male.
In
contrast,
few
jennies
had
more
than
four
foals,
and
then,
females
show
a
greater
breeding
homogeneity
than
males.
The
family
size
variances
calculated
along
the
four
pathways
for
gametes
confirm
the
previous
remarks:
an&dquo;&dquo;
=
7.66;
0
,2 m
=
5.83;
or fm 2
=
0.90;
0
,2
=
0.90
offspring.
3.1.3.
Male/female
proportion
(sex
ratio)
When
analysing
this
population
census
and
its
breeding
structure,
two
types
of
problems
can
be
observed.
The
adult
female
percentage
(62.85
%)
nearly
doubles
the
male
proportion
(37.14
%),
44
females
versus
26
males.
On
the
other
hand,
the
number
of
adult
males
and
females
which
are
breeding
is
less
than
half
the
number
of
adult
individuals
which
could
potentially
be
used
as
reproducers
(N
f
= 21
and
Nm
=
12).
In
short,
we
would
recommend
increasing
the
Ne
population,
to
try
to
equalize
the
sex
ratio
(n
m
m
Nf)
and
to
use
the
maximum
number
of
adult
animals
which
are
now
present
in
our
population.
To
conclude,
and
directing
these
results
to
the
Conservation
Programme,
the
main
objective
would
be
to
maximize
the
effective
population
size
(N
e)
to
guarantee
that
increments
of
consanguinity
per
generation
would
be
minimal:
1)
equalize
the
sex
ratio
(Nm !
Nf)
avoiding
the
family
size
fluctuations
and
that
ideally,
each
male
would
contribute
with
a
male
offspring
and
each
female
with
a
female
offspring
to
the
next
generation,
2)
standardize
the
family
size
minimizing
the
variance
(o, k 2),
and
3)
increase
the
generation
intervals,
that
is,
lengthen
the
reproductive
life
of
the
animals.
3.2.
Inbreeding
and
pedigree
completeness
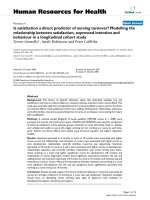
The
annual
average
inbreeding
(!F),
calculated
by
linear
regression
over
years,
was
0.38
%
(figure
1).
The
accumulated
consanguinity
average
(F)
was
5.9
%.
The
expected
theoretical
inbreeding
increase
was
calculated
from
OF
=
1/2N
e
which
gave
a
result
of
0.83
%
in
the
studied
population.
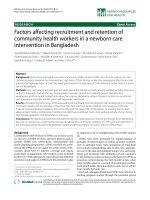
The
pedigree
completeness
degree
[14]
was
measured
for
each
animal
in
the
study
by
calculating
the
proportion
of
ancestors
known
in
each
preceding
generation
(figure
2).
The
pedigree
thoroughness
was
found
to
be
very
incomplete
up
to
the
fifth
generation
of
ancestors
because
the
proportion
of
known
ancestors
was
less
than
20
%.
That
is
why
this
situation
should
be
taken
into
account
when
analysing
the
inbreeding
coefficients.
3.3.
Probability
of
gene
origin
The
effective
number
of
founders
( f
e
),
according
to
the
formula
(2),
was
51.31
ancestors,
the
total
number
of
founders
( f
t)
was
85.
However,
we
considered
that
the
total
number
of
founders
was
very
high
basically
due
to
the
poor
quality
of
pedigree
information.
According
to
Boichard
et
al.
[3],
these
individuals
do
not
represent
the
genetic
variability
which
exists
in
the
current
population.
In
the
first
place,
because
these
animals
have
possibly
been
considered
as
founders
and,
as
a
result,
genetically
independent,
their
relationship
is
virtually
zero,
but
perhaps
this
is
not
true.
In
the
second
place,
because
the
contributions
of
the
present
population
are
very
unbalanced
owing
to
the
fact
that
some
founders
have
contributed
very
little
or
even
not
at
all.
Analysing
the
relationship
f
e/ f
t
a result
of
60.36
%
was
obtained,
that
is,
for
every
ancestor
contributing
effectively
to
the
genetic
pool
in
the
population
under
study
there
is
another
for
whom
information
has
been
lost.
This
relationship
has
been
described
in
French
horse
populations
[15].
It
was
noticed
that
they
have
ranged
from
2.78
%
to
14.03
%,
where
some
populations,
such
as
the
Trotteur
F!anCais,
were
particularly
very
unbalanced
(only
1
%
of
founders
accounted
for
half
the
current
gene
pool).
Probably
these
imbalances
are
due
to
the
fact
that
the
selection
intensity
in
these
populations
is
very
high
and
that
they
use
only
the
best
stallions
for
matings.
To
maintain
and
to
conserve
a
small
population,
a
correct
mating
system
is
very
important.
On
the
whole,
an
ideal
breeding
policy
would
be
that
which
would
calculate
the
effective
number
of
founders
and
the
inbreeding
coefficient
of
the
hypothetical
offspring
of
each
possible
populating
couple.
In
this
way,
those
couples
which
would
maximize
this
effective
founder
number
and
minimize
the
offspring
inbreeding
coefficient
would
be
chosen.
4.
CONCLUSION
We
must
ensure
the
equal
contribution
of
the
maximum
number
of
animals
possible
(from
both
sexes),
with
as
much
time
as
possible,
leaving
offspring
for
the
next
generation.
A
minimum
number
of
inbreeding
matings
should
be
allowed.
A
maximum
number
of
founder
animals
(ideally
all
of
them)
would
then
be
represented
in
the
next
generation.
ACKNOWLEDGEMENTS
The
authors
wish
to
thank
the
Departament
d’Agricultura,
Ramaderia
i
Pesca
of
the
Generalitat
de
Catalunya,
which
financed
this
study;
likewise
the
AFRAC
association
for
their
helpful
contribution
and
for
providing
the
data
used
in
the
analysis.
Also,
the
authors
are
grateful
to
E.
Bedmar
for
providing
a
computer
program
for
inbreeding
and
probability
gene-origin
calculations
as
well
as
his
computation
assistance
throughout
this
paper.
Also,
we
would
like
to
thank
Chuck
Simmons
for
the
English
revision.
REFERENCES
[1]
Alderson
G.L.H.,
A
system
to
maximize
the
maintenance
of
genetic
variability
in
small
populations,
in:
Alderson
L.,
Bod6
I.
(Eds.),
Genetic
Conservation
of
Domestic
Livestock,
CAB
International,
Wallingford,
1992,
pp.
18-29.
[2]
Boichard
D.,
Maignel
L.,
Verrier
E.,
Analyse
généalogique
des
races
bovines
laitieres
franqaises,
Inra
Prod.
Anim.
9
(1996)
323-335.
[3]
Boichard
D.,
Maignel
L.,
Verrier
E.,
The
value
of
using
probabilities
of
gene
origin
to
measure
genetic
variability
in
a
population,
Genet.
Sel.
Evol.
29
(1997)
5-23.
[4]
Folch
P.,
Jordana
J.,
Characterization,
reference
ranges
and
the
influence
of
gender
on
morphological
parameters
of
the
endangered
Catalonian
donkey
breed,
J.
Equine
Vet.
Sci.
17
(1997)
102-111.
[5]
Folch
P.,
Jordana
J.,
Estado
actual
de
resultados
del
Programa
de
Conservacion
Genetica
en
la
raza
asnal
Catalana,
ITEA
Suppl.
18
(1997)
348-350.
[6]
Folch
P.,
Jordana
J.,
Sdnchez
A.,
Genetic
variation
of
the
endangered
Catalonian
donkey
breed,
Anim.
Genet.
27
(S2)
(1996)
34.
[7]
Folch
P.,
Jordana
J.,
Cuenca
C.,
Reference
ranges
and
the
influence
of
age
and
sex
on
haematological
values
of
the
endangered
Catalonian
donkey
breed,
Vet.
J.
154
(1997)
163-168.
[8]
Henderson
C.,
A
simple
method
for
computing
the
inverse
of
a
numerator
relation-
ship
matrix
used
in
the
prediction
of
breeding
values,
Biometrics
32
(1976)
69-83.
[9]
Hill
W.G.,
Effective
size
of
populations
with
overlapping
generations,
Theor.
Popul.
Biol.
3
(1972)
278-289.
[10]
Jordana
J.,
Folch
P.,
The
endangered
Catalonian
donkey
breed:
the
main
ancestor
of
the
American
ass
or
Mammoth,
J.
Equine
Vet.
Sci.
16
(1996)
436-441.
(11J
Jordana
J.,
Folch
P.,
Cuenca
C.,
Clinical
biochemical
parameters
of
the
endangered
Catalonian
donkey
breed:
normal
values
and
the
influence
of
sex,
age
and
management
practices
effect,
Res.
Vet.
Sci.
(1998)
(in
press).
[12]
Klemetsdal
G.,
Demographic
parameters
and
inbreeding
in
the
Norwegian
Trotter,
Acta
Agric.
Scand.
A-An.
43
(1993)
1-8.
[13]
Lacy
R.C.,
Analysis
of
founder
representation
in
pedigrees:
founder
equivalents
and
founder
genome
equivalents,
Zoo
Biol.
8
(1989)
111-123.
[14]
MacCluer
J.W.,
Boyce
A.J.,
Dyke
B.,
Weitkamp
L.R.,
Pfenning
D.W.,
Parsons
C.J.,
Inbreeding
and
pedigree
structure
in
Standardbred
horses,
J.
Hered.
74,
(1983)
394-399.
[15]
Moureaux
S.,
Verrier
E.,
Ricard
A.,
Mériaux
J.C.,
Genetic
variability
within
French
race
and
riding
horse
breeds
from
genealogical
data
and
blood
marker
polymorphism,
Genet.
Sel.
Evol.
28,
(1996)
83-102.
[16]
Quaas
R.L.,
Computing
the
diagonal
elements
and
inverse
of
a
large
numerator
relationship
matrix,
Biometrics
32
(1976)
949-953.