Documentsbeyond transparency collective engagement in sustainable phần 7 doc
Bạn đang xem bản rút gọn của tài liệu. Xem và tải ngay bản đầy đủ của tài liệu tại đây (1.09 MB, 10 trang )
62
Field
Research
Findings
The
five
entrepreneurs
used
Sourcemap
as
a
communication
platform:
they
found
ways
to
express
their
particular
sustainability
approaches
through
the
visualization,
calculators
and
marketing
features
of
the
site.
The
Designer
sought
to
express
cultural
traditions;
the
Butcher
priori-
tized
quality
and
traceability;
the
Hotelier
advertized
a
carbon
neutral
approach;
the
Brewer
shared
concerns
about
her
industry;
and
the
Ca-
terer
communicated
a
combination
of
quality,
traceability,
and
innova-
tion
in
ingredients.
Communications
functionality
was
a
strong
motiva-
tion
for
the
business
owners
to
try
Sourcemap.
Viral
media
channels
are
already
popular
with
small
businesses
as
an
inexpensive
way
to
enrich
their
websites.
One
unexpected
discovery
was
that
supply
chain
transparency
could
be
applied
in
such
diverse
ways
to
convey
the
nuanced
sustainability
strategies
of
the
entrepreneurs.
Beyond
this,
three
of
the
business
owners
carried
out
an
audit
of
some
aspect
of
their
sustainability
strategy
(the
Butcher,
the
Hotelier,
and
the
Brewer)
and
three
used
it
to
determine
how
to
streamline
their
opera-
tions
(the
Hotelier,
the
Brewer
and
the
Caterer).
Small
business
entre-
preneurs
have
a
choice
of
worksheets
to
measure
environmental
per-
formance;
and
professional
consulting
can
bring
about
more
thorough
assessments
and
action
plans.
None
of
the
entrepreneurs
favored
these
approaches,
however,
as
they
can
be
resource-intensive
and
the
results
opaque.
In
conversations
with
the
entrepreneurs,
the
transparency
of
Sourcemap
was
seen
as
a
differentiator:
the
open
calculations
and
math
make
it
easy
to
test
different
scenarios
and
understand
the
relative
im-
portance
of
certain
choices.
Sourcemap
supports
the
sustainable
design
decisions
of
the
business
proprietors
by
simulating
the
impacts
of
dif-
ferent
hypothetical
scenarios.
Beyond
that,
publishing
assessments
on
the
site
is
a
way
to
avoid
grenwashing
-
the
risk
that
visitors
interpret
sustainability
claims
as
empty
rhetoric
-
since
the
underlying
impact
calculations
are
plain
for
all
to
see.
Two
of
the
participants
have
been
actively
reorganizing
their
regional
industries:
the
brewer,
by
relocating
bottling
operations
to
a
new
fac-
tory,
and
the
caterer,
by
investing
in
a
root
cellar
and
canning
operation
and
a
local
produce
distribution
hub.
These
regional
infrastructure
de-
velopments
reflect
ideas
and
priorities
already
held
by
the
business
owners,
with
Sourcemap
serving
to
communicate
the
results.
Source-
map
is
able
to
support
this
type
of
sustainable
design
that
extends
beyond
the
interests
of
a
single
business
to
include
the
industry
and
the
region.
These
entrepreneurs
sought
to
differentiate
themselves,
as
well
as
to
raise
the
standards
of
their
respective
industries.
This
reinforces
the
need
for
a
sustainability
communications
platform
where
multiple
stakeholders
can
participate
-including
suppliers,
competitors,
inves-
tors
and
regulators-
to
trace
the
impacts
of
sustainability
decisions
on
the
economy,
society
and
the
environment.
Communications
functionality
motivated
the
use
of
Sourcemap
and
made
it
possible
to
account
for
larger-scale
social,
environmental
and
economic
sustainability.
The
field
studies
also
highlighted
a
need
for
sustainable
design
tools
that
are
accessible
by
decision-makers
outside
the
environmental
domain.
While
the
model
of
simplified
LCA
and
supply
chain
mapping
employed
by
Sourcemap
proved
to
be
widely
ap-
plicable
to
different
design
strategies,
there
has
yet
to
be
a
robust
me-
chanism
for
valuing
social
impacts.
Social
sustainability
initiatives
will
need
to
be
better
illustrated
to
reflect
the
benefits
of
small
business
supplier
networks.
Pilot
Studies
I
Scaling
Sourcemap
The field
research
points
towards
large-scale
applications
of
a
social
network
for
supply
chain
stakeholders.
Two
pilot
studies
were
carried
out
to
test
transparency
in
large
supply
chains:
one
with
a
regional
de-
velopment
group
and
another
with
a
major
retailer.
These
exploratory
studies
point
to
future
directions
in
the
development
of
collective
tools
for
sustainable
design.
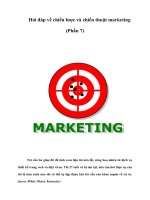
Our Sussex Breakfast
is sourced locally
to help sustainability
and support local producers
Have a look at
the comparson below
to see how many miles,
and
tonnes of carbon are
saved when the hotel
you choose to stay at
actively supports and sources
their ingredients
locally.
Our
Locally Sourced
Sussex Breakfast
A Standard
World Produce Breakfast
This
badge
is
included
on
the
website
of
businesses
participating
in
a
campaign
to
promote
local
foods,
showing
the
business'
actual
sources
(left)
as
compared
with
a
globally-source
meal
(right).
Regional
Development
Group
Two
of
the
small
business
entrepreneurs
defined
a
regional
strategy
through
their
use
of
Sourcemap:
the
Brewer,
in
her
plans
for
a
regional
bottling
hub,
and
the
Caterer,
in
his
creation
of
a
local
farm
stand.
To
arrive
at
these
strategic
decisions,
each
had
to be
conscious
of
the needs
of
their
respective
industries,
needs
that
extend
beyond
the day-to-day
concerns
of
running
a
business.
What
if
a
real-time
assessment
of
re-
gional
sourcing
could
be
aggregated
from
all
of
the
sourcemaps
of
indi-
vidual
businesses
in a
region?
A
tourism
organization
in
the
South
of
England
created
its
own
version
of
Sourcemap
to
promote
local
industry
and culture.
Hotels
and
restaurants
that
source
a
proportion
of
ingre-
dients
from
local
farms
are
asked
to
disclose
their
sources
in
exchange
for
being
featured
on
the
umbrella
organization's
website.
Sourcemap
is
used
as
a
reporting
and
certification
tool:
any
business
can
join
the
group
if
it
is
transparent
about
its
sourcing
and meets
community
stan-
dards.
A
branch
of
Souroemap
was
created
by
local
developers;
a
cultu-
rally
relevant
measure
has
been
introduced
(food
miles)
as
well
as
lo-
cally
specific
means
of
shipping
(diesel van,
lorry).
Five
hospitality
businesses
have
mapped
their
regional
food
supply
chains,
and
these
maps
were
embedded
in
their
respective
websites
and
on
the
umbrella
organization's
site.
These
five
supply
chains
touch
sixty
supplier
farms
who
are
also
being
promoted
indirectly
through
the
sourcemaps.
Over
time,
an
ad-hoc
directory
of
suppliers
and
buyers
will
form,
providing
the
region
with
a
valuable
tool
for
development.
Work
is
under
way
to
visualize
this
aggregation
of
supply
chains
on
a
single
regional
map
which
could
be
used
as
a
shopping
portal
to
further
sti-
mulate
local
business.
Major
US
Retailer
Two
months after
publio
release
the
Sourcemap
team
was
contacted
by
representatives
from
a
major
US
retailer
to
create map-based
visualiza-
tions
of
product
supply
chains
for
internal
and
external
communica-
tions.
This
experience
highlighted
some
of
the
short-term
benefits
and
long-term
challenges
of
supply
chain
transparency
in
large organiza-
tions.
This
case
study
consisted
in
researching
a
single
supply
chain
-a
can
of
tomatoes
-
to
produce
visualizations
used
in
internal
and
external
pres-
entations.
The
canner
supplied
information
about
the
provenance
of
all
of
the
ingredients
and
packaging,
while
expressing
concern
that
this
in-
formation
could
be
used
by
the
retailer
-his
client-
to
push
for
changes
to
his
practices.
The
8
oz.
can
of
tomatoes
contains
eight
edible
ingre-
dients
from
seven
countries
in
North
and
South
America
and
Asia
(more
edible
ingredients
may
be
used
in
quantities
small
enough
to
fall
below
the threshold
for
reporting).
73
The
packaging
is
made
from
five
mate-
rials
sourced
in
three
oountries
in
North
America
and
in
Asia.
Even
though
some
of
the industrial
packaging
(eg.
pallets
and
pallet
wrap)
do
not appear
in
the
finished
product,
they
can
have
substantial
impacts
to
the
overall
safety
and sustainability
of
the
product.
74
In
short,
this
rela-
tively
simple
product
-
sold
as
'Tomatoes'
is
made
of
(at
least)
13
mate-
rials
from
9
countries
without
considering
secondary
inputs
like
fuel,
fertilizer
or
chemicals.
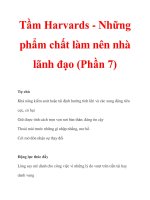
~ZZ
Two
of
the
visualizations
used
to
present
the
supply
chain:
Earth
(left)
and
a
still
from
a
video
of
production
practices
at
a
supplier
factory
(right)
73
Hydrolyzed
vegetable
protein
recall
available
at
(Retrieved
2010-07-21)
74
US
Food
&
Drug
Adminstration,
"Johnson
and
Johnson's
Recall
of Children's
Tylenol
and
Other
Children's
Medicines."
Available
at
/>NewsEvents/Testimony/ucm213640.htm
(Retrieved
2010-07-15)
Visually
depicting
the
supply
chain
of
a
simple
product
can
be
challeng-
ing.
After
numerous
calls
and
emails,
enough
information
was
gathered
to
make
four
Sourcemaps:
three
second-tier
suppliers
and
one
first-tier
supplier
(the
cannery).
The
second-tier
suppliers'
maps
are
nested
at
the
extremities
the
cannery's
supply
chain.
Videos
prepared
by
the
supplier
were
added
to
production
sites
on
the
map.
A
two-minute
movie
was
ultimately
produced
from
animated
screen
captures
of
Sour-
cemap
and
Earth.
It
was
presented
to
executives
within
the
company,
and
stills
were
shown
at
the
TED
2010
conference
by
a
com-
pany
executive.
75
Executives
were
surprised
by
the
number
and
prove-
nance
of
ingredients
sold as
California
tomatoes,
suggesting
that
in-
volving
more
people
in
sourcing
decisions
might
shift
practices.
The
pilot
study
was
considered
successful,
and
additional
supply
chains
are
being
mapped
as
part
of
a
larger
strategy
to
phase-in
supply
chain
transparency
within
the
organization.
The
retailer
case
study
underscores
the
need
for
platforms
with
mul-
tiple
points
of
entry
for
spreading
an
understanding
of
supply
chain
practices.
The
map-based
visualizations
of
Sourcemap
served
as
a
communications
link
between
suppliers,
sustainability
professionals,
retail
executives
and
the
general
public.
Considerable
hands-on
work
was
required
to
gather
the
supply
chain
information;
more
automated
methods
would
be
ideal.
Suppliers
could
one
day
publish
information
about
their
practices
directly
to
Sourcemap;
it
would
join
information
from
other
suppliers,
at
which
point
the
retailer
could
incorporate
all
of
the
supply
chain
data
for
internal
or
public-facing
presentations.
Moti-
vating
suppliers
and
consumers
to
make
use
of
the
data
is
another
challenge.
Creating
a
sustainability
'score'
could
drive
suppliers
to
monitor
and
report
on
their
performance
over
time.
Consumers
could
be
provided
with
in-store
and
mobile
applications
for
viewing
informa-
tion
about
the
story
behind
products;
they
could
also
be engaged
to
provide
user-generated
content
in
an
online
social
network.
Early
discussions
of
Sourcemap
suggested
that
major
industries
could
be
reluctant
to
adopt
supply
chain
transparency
because
of
concerns
over
disclosing
supplier
identities
or
proprietary
formulas.
This
study
showed
that
suppliers
could
present
a
more
significant
opposition.
Con-
versations
with
a
number
of
major
industries
suggest
that
a
phased-in
approach
is
being
favored,
where
transparency
migrates
from
within
an
organization
to
its
larger
supplier
network
and
finally
into
the
public
realm.
7
TED
conference
available
at
(Retrieved
2010-08-04)
Evaluating
Engagement
I
Contributor
Communities
Hands-on
evaluations
show
that
a
communications
platform
for
sus-
tainable
design
can
shift
attitudes
and
practices.
But
what
happens
when
the
platform
is
released
to
the
public?
Collective
engagement
de-
pends
on
the
collaboration
of
different
supply
chain
stakeholders:
con-
sumers,
producers,
designers,
environmental
experts
and
oversight
groups.
The
open
source
approach
also
depends
on
contributions
to
the
project
and
to
the
underlying
software.
Sourcemap.org
was
released
to
the
public
on
September
1st,
2009.
In
the
ten
months
since,
engagement
has
been
observed
through
user-generated
content
on
the
website
and
direct
contributions
to
the
project's
development
by
a
growing
commu-
nity
of
environmental,
logistics,
software
and
business
experts.
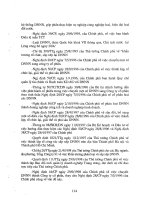
Other
8%
Marketing
&
Environmental
&
Press
Supply
Chain
11%
Expert
27%
IT
Expert
13%
Government
&
NGO
Designer
&
15%
Consultant
13%
Manufacturer
13%
Professional
affiliations
of 78
users
who
sent
emails
through
the
Sourcemap.org
con-
tact
page
between
November
2009
and
July
201076
A
cross-section
of
participants
can
be
glimpsed
from
those
who
sent
messages
sento
the
development
team
(above).
This
sampling
sug-
gests
that
Sourcemap.org
engages
the
communities
it
was
designed
for:
environmental
and supply
chain
experts
(27%),
manufacturers,
design-
ers
and
consultants
(26%),
oversight
groups
(15%),
and
IT
experts
(13%).
The
manufacturers,
designers
and
consultants
(who
have
a
di-
rect
influence
on
product
offerings)
include
one
or
two
representatives
from
each
of
these
sectors:
architecture,
apparel,
beverage,
consumer
76
SOUrCemap
contact
page:
/>(Retrieved
2010-08-03)
electronics,
engineering,
furniture,
household
goods,
pet
products,
po-
lymers,
product
design,
recycling,
retail
fixtures,
and
urban
planning.
Outside
the
target
groups,
journalists
and
marketing
professionals
also
contacted
us
to
write
about
the
project
or
to
use
Sourcemap
as
a
re-
source
for
stories
about
sustainability
and
supply
chains.
As
influencers
of
mainstream
media,
they
could
play
an
important
role
in
spreading
the
expectation
of
transparency
within
industry
and
to the
general
public.
Engagement
is
evaluated
through
user-generated
content
and
contribu-
tions
to
the
technical
development.
These
early
results
paint
an
opti-
mistic
picture
of
the
need
for
forums
where
supply
chains
can
be
shared
between
diverse
stakeholders.
At
the
same
time,
there
is
a
clear
need
for
a
uniform
quality
and
depth
of
information
about
supply
chains.
A
code
of
conduct
for
transparency
reporting
could
bring
more
specificity
to
the
public
discussion
of
sustainability.
Evaluating
Engagement
I
User-Generated
Content
9/09 10/09 11/09 12/09
1/10 2/10 3/10 4/10 5/10
6/10 7/10
Registered
users and
sourcemaps created September
2009
-
July
2010
The
largest
and
most
diverse
group
of
contributors
to
Sourcemap
is
made
up
of
visitors
to
the
website.
In
the
ten
months
since it
went
pub-
lic,
sourcemap.org
was
visited
by
170,000
people
from
182
countries
and
territories.
7 7
Nearly
2%
(3,200)
registered
as
members,
enabling
them
to
rank,
comment
on
and
create
sourcemaps.
28%
(913) of
users
created
at
least
one
entry
and
about
200
super-users
are
responsible
for
more
than
half
of
the
1,650
maps
on
the
site.
78
1 2 3 4 5
6 10 17 24
Sourcmps
Number
of
sourcemaps
created
per
user:
39%
of
users
create
1
map;
35%
create
2-5
maps,
12%
create
6-20
maps
and
14%
create more
than
20
maps
each.
77
As
of
2010-07-25:
3,200
registered
users,
171,685
unique
visits
and
515,142
page
views.
78
As
of
2010-07-25:
1,672
sourcemaps
have
been
created
excluding
entries
without
a
title,
an assembly location
or parts.
421
sourcemaps
are
publicly visible.
-Users
Sourcemaps
500
-
400
-
300
-
200
-
100
-