Wideband tdd wcdma for the unpaired spectrum phần 9 pptx
Bạn đang xem bản rút gọn của tài liệu. Xem và tải ngay bản đầy đủ của tài liệu tại đây (333.65 KB, 29 trang )
198 Radio Resource Management
5. SIR: As for the UE, the Signal to Interference Ratio (SIR) is measured on a specified
DPCH code and is defined as (RSCP/ISCP)*SF, where SF is the spreading factor of
the DPCH code. A number of timeslot samples are averaged together to produce a
reliable measurement.
6. BER: Transport Channel BER is an estimation of the average bit error rate (BER) of
a specific DCH or USCH.
7. RX Timing Deviation: The Rx Timing Deviation measurement is the estimate of the
difference in time between the start of Node B reception of an UL burst and the start
of transmission of Node B’s timeslot.
7.3.1.2 Intra-Cell vs Inter-Cell Interference
In general, the interference in CDMA systems is of the Intra-Cell and Inter-Cell type. The
former arises from multiple users in a cell whose signals overlap on time and frequency
but are separate in code domain. Since in WTDD, users are assigned different timeslots
also, the Intra-Cell Interference is limited to only those users active in the same timeslot. In
other words, the Intra-Cell Interference is reduced to Intra-Timeslot Interference! Since
the maximum number of users in a timeslot is limited to 16, the maximum Intra-Cell
interference is quite limited. Another very significant advantage comes about due to the
potential use of Multi-User Detectors for WTDD. Such detectors theoretically eliminate
interference among users in the same timeslot, thereby potentially removing all Intra-Cell
Interference altogether! In such cases, the WTDD systems would only have to minimize
Inter-Cell Interference, which is due to users active in an overlapping Timeslot (and same
carrier frequency) in another cell. If neighboring cells are assigned different timeslots, then
the distance to interfering cells is increased, thereby reducing Inter-Cell Interference also.
7.3.1.3 Timeslot Fragmentation
The RUs required by a service (as explained in Section 7.2.2) are allocated to various
timeslots. If the number of timeslots used is M, then a small M is said to pool the RUs into
a small number of timeslots. On the other hand, a larger M is equivalent to distributing
the RUs over more timeslots, resulting in the so-called Timeslot Fragmentation. One
advantage of pooling RUs is that the UE transmits and receives only during a fraction of
the frame period, potentially leading to battery power savings. Second, pooling RUs into
a small number of RUs reduces the code-blocking in the remaining timeslots. Although
pooling the codes into small number of timeslots creates increased interference among
the codes, Multi-User Detection is capable, in principle, of eliminating the Intra-Timeslot
Interference. Accordingly, we may associate a penalty with timeslot fragmentation. This
penalty can then be taken into RRM considerations possibly along with other criteria.
As a simple example, the penalty associated with allocating the required RUs into M
timeslots may be taken to be proportional to M. It is assumed that M does not exceed the
maximum number of timeslots that a UE can support.
7.3.1.4 Power Rise
By aiming at regulating the received power despite the Rayleigh fading, fast power control
is used (see later sections). Approximately, the variations in the instantaneous transmitted
Physical Layer RRM Algorithms 199
power may be taken to be the inverse of the gain of the fading channel. Assuming that
the average gain of the fading channel is unity, the average transmitted power would be
the statistical mean of the inverse. It follows from elementary probability theory that,
for common statistics of the gain of the fading channel, the average of the inverse is
greater than unity. In other words, although the average channel gain is unity, the average
transmitted power is greater than unity. This increase is termed as Power Rise due to
Power Control.
On the downlink, the power rise increases the interference level of all users in the
system and can simply be added to the Eb/No requirement measured at the received
antenna. On the uplink, the power rise does not lead to increased interference in the
serving cell but does so in the other cells of the system.
7.3.1.5 Noise Rise
When RUs are allocated to a timeslot, the transmitted Code power must be such that the
Signal-to-Interference Ratios are met for satisfactory performance. This causes increased
interference to other users in the same timeslot, so that they increase their respective
transmitted power levels. In turn, this causes increased interference seen by the first user,
to whom RU allocation was made. This phenomenon by which the interference seen by a
user increases due to his/her own transmissions, is termed as Noise (strictly interference)
rise. This process continues iteratively, until a balance occurs.
In general, the other users who cause the increase in Noise Rise may be within the
same cell as the first user or other cells. In TDD, thanks to the Multi-User Detector,
interference from users in the same cell can be completely eliminated (theoretically). As
a result of this, Noise Rise may be assumed to be caused only by Inter-Cell Interference
from adjacent cells using the same timeslot.
In general, Noise Rise depends upon the initial ISCP, Pathloss and SIR required for
the service. Thus, we write
Noise Rise = ISCP (ISCP, pathloss, SIR)
Noise Rise is important to consider, when timeslot allocations are being made based on
Interference considerations. This will be addressed in later sections.
7.3.1.6 Cell/Timeslot Load
At Node B, the Load in timeslot t of cell j, say L (j , t), can be directly related to the
amount of interference in timeslot t, namely ISCP (j , t). The precise relationship is given
as follows:
L(j, t) = 1 −
N
O
ISCP(j, t)
where N
O
represents the receiver noise level.
The above characterization of Load is useful for uplink applications; a Carrier Power-
based characterization is possible for Downlink Load determination at Node B. It is
given below:
L(j, t) =
P(j,t)
P
max
(j, t)
200 Radio Resource Management
where P(j,t) and P
max
(j, t) are the total carrier power and the maximum carrier power
respectively.
Considering the collection of all the Timeslot Loads as the Cell Load, different RRM
techniques may be invoked, depending on the Cell Load level.
7.3.2 Dynamic Channel Assignment (DCA) Algorithms
As discussed in the first part of this chapter, Dynamic Channel Allocation refers to
the process of dynamically allocating Physical Radio Resources, namely timeslots and
Channelization/Spreading Codes, to meet the QoS requirements to a single user as well
as to an entire cell, in such a way as to minimize the self-interference in the system and
maximize system capacity.
Depending on the application, DCA is referred to as Fast DCA, Slow DCA or Back-
ground DCA. Slow DCA is responsible for configuring the timeslots in each cell on a
coarse time scale. On the other hand, Fast DCA is responsible for assigning timeslots
and codes to different radio bearers on relatively short time scale. A central problem
in all DCA schemes is the optimal allocation of codes to timeslots, taking into account
interference and load. We shall devote the remaining part of this chapter to this topic.
Consider a set of K codes {C
i
:1≤ i ≤ K} with spreading factors {SF
i
:1≤ i ≤ K}
respectively. Clearly the values of SF
i
are 1, 2, 4, 8, 16 in the Uplink and 1, 16 in
the downlink. To illustrate the complexity of the problem, we shall only consider uplink
for this discussion. In terms of Resource Units, we can express the codes as {CRU
i
=
16/SF
i
:1≤ i ≤ K} respectively. The total number of RUs associated with the code set
is CRU = CRU
1
+ CRU
2
+···+CRU
K
.Let{M
1
, M
2
, M
4
, M
8
, M
16
} be the number of
codes with 1, 2, 4, 8, 16 RUs respectively.
Let us assume that N ≤ 15 timeslots are designated for uplink traffic. As explained
above, each timeslot has a maximum of 16 RUs. Let {ARU
1
, ARU
2
, ARU
N
} be the
number of RUs available in each of the N uplink timeslots. The total number of available
RUsisARU= ARU
1
+ ARU
2
+···+ARU
N
.Let{N
1
, N
2
, N
3
, N
4
, N
5
, N
6
, N
14
, N
15
,
N
16
} be the number of timeslots with 1,2, 16 available RUs respectively.
Now consider allocating the codes to timeslots. There are M
16
codes with 16 RUs,
which can be allocated to N
16
timeslots, each of which has 16 RUs available. This can
be done in
N
16
M
16
ways. Next there are M
8
codes with 8 RUs, which have to be allocated
to timeslots having 8 or more RUs. The number of such timeslots equals {N
8
+···+
N
14
+ N
15
+ (N
16
− M
16
)}.Thereare
N
8
+··+N
15
+(N
16
−M
16
)
M
8
ways in which no more than 1
code with 8 RUs is allocated to each timeslot. However, there are (N
16
− M
16
) timeslots,
which can be allotted 2 codes with 8 RUs. There are
N
8
+··+N
15
+(N
16
−M
16
)−1
M
8
−2
∗
(N
16
− M
16
)
such allocations. Clearly, the number of allocations becomes larger and more complex to
determine as we seek to allocate the remaining codes with smaller RUs.
Next, these allocations must be analyzed for validity and optimality. By validity, we
mean that the allocation must not violate constraints such as UE multislot/multicode
capability, Max power requirements, etc.
For optimality, there are a number of related considerations, namely, Interference,
Transmitted Power, Timeslot Fragmentation and Code Fragmentation.
Physical Layer RRM Algorithms 201
Let us first consider Interference. Clearly, each of the already allocated codes in each
timeslot has a certain amount of interference, which is quantified by ISCP. The sum of the
ISCPs of all codes in a timeslot is a Slot-ISCP. Allocation of new codes is preferably done
in timeslots with the least amount of Slot-ISCP. Recall that interference can be classified
as Intra-Cell and Inter-Cell Interference. Since Multi-User Detection is feasible in TDD
systems, we may ignore Intra-Cell Interference. Thus we may consider the following
optimization metric for Interference:
J
I
=
K
k=1
I(k)·
16
SF(k)
where K is the number of codes allocated to timeslot j and I
j
(k) is the ISCP after code
k has been allocated, which includes the Noise (interference) rise, as follows:
I(k) = ISCP + ISCP(ISCP, Pathloss, SIR)
Now we consider the Transmitted Power as an optimization metric. It is obvious that the
Transmitted Power at Node B must be minimized, as it relates to interference as well as
capacity. The following is an example optimization metric in terms of power.
J
P
= ISCP + ISCP(ISCP, Pathloss, SIR) + PathLoss + SIR
T
Timeslot Fragmentation refers to whether a given set of codes is allocated in a small
number of timeslots or spread across a non-minimal set of timeslots. UEs whose multislot
capability is limited would prefer allocation in the minimal set of timeslots, whereas UEs
whose multicode capabilities are limited may prefer allocations in non-minimal set of
timeslots. Similarly, UE battery consumption may be affected by the number of timeslots
within which it has to transmit/receive as well. Finally, the usage of Multi-User Detectors
may enable near complete cancellation of interference from codes in the same timeslot,
so that it may be better to pack the codes in the smallest number of timeslots. Therefore,
we see that there are multiple effects of the Timeslot Fragmentation phenomenon. An
example optimization metric in terms of timeslot fragmentation is as follows:
J
T
=
p · (j − 1) if 0 <j≤ C
∞ if j>C
where p is a fragmentation penalty increment, and C is the maximum number of time
slots that a UE can support.
Finally, Code Fragmentation is related to the f act the Channelization Codes are orga-
nized in a binary tree fashion, so that certain code allocations may block other codes from
being available. Therefore, the following optimization metric may be used for taking code
fragmentation into account:
J
C
=
Total slots assigned to CCTrCH
Number of physical channels in this slot for same CCTrCH
Note that in the downlink, there is no Code Fragmentation problem.
202 Radio Resource Management
In general, one could consider an optimization metric, which is a function of all
the above:
J = f(J
I
, J
P
, J
T
, J
C
)
A special case is a linear weighted combination:
J = αJ
I
+ βJ
P
+ γ J
T
+ λJ
C
The specific combination depends upon the context where the allocation is being done.
Some examples are: Allocation of Resources during Call/Session Admission; Periodic Re-
Allocation of Resources in order to optimize the Resource Utilization and Performance;
Reactive Re-Allocation of Resources in order to mitigate extraordinary situations, such as
excessive interference, etc. Accordingly, a number of related algorithms may be derived:
F-DCA Admission, F-DCA Background, F-DCA Escape.
Due to the complexity of the problem, and due to the fact that the truly optimal solution
is in general computationally impractical, we have to resort to sub-optimal and ad hoc
solutions. Since there can be many such solutions, we shall illustrate two approaches,
which capture the most essential ideas.
7.3.2.1 Allocation Algorithm 1
Assume that the cell has N(k) Resource Units available for allocation, with 0 ≤ N(k) ≤
16, and 1 ≤ k ≤ 15. Note that N(k) is allowed to be ‘0’, which indicates that kth Timeslot
is either unavailable or unallocated for service. For example, it may be designated for
traffic in the opposite direction.
The problem considered now is that of allocating a code set {n
1
(j ), n
2
(j ), n
4
(j ), n
8
(j ),
n
16
(j )} for a fixed j, to various timeslots. That is, the code set consists of n
1
codes of
SF = 1, n
2
codes with SF = 2, etc. Let the total number of codes be K and be denoted
as {c
1
, c
2
, c
K
}.
The problem can be approached by considering all possible permutations of the 15
timeslots, and allocating the above codes to each timeslot sequence in a prescribed manner,
evaluating each allocation with respect to some optimization metric and selecting the
allocation with the ‘best’ metric.
Let the timeslot sequences be denoted as: (S
1
S
N
),whereN= 15!. For example,
S
i
={1, 3, 5, 7, 9, 11, 13, 15, 2, 4, 6, 8, 10, 12, 14} for some i.
For each timeslot sequence, attempt to allocate the codes, starting with the code with
the smallest Spreading Factor. (The idea behind starting with the smallest SF is that it
will result in the smallest number of timeslots used.) In order for a code to be allocatable
to a timeslot, a number of criteria should be satisfied. For example, the timeslot should
have enough available resource units, and the allocation should be within the UE/Node B
capabilities in terms of multislot and multicode capabilities. Additionally, transmit power
limitations must be respected. For example, the required transmit power for a code that
has been added can be written as:
TX Power
new code
= ISCP + ISCP(ISCP, Pathloss, SIR) + PathLoss + SIR
T
Physical Layer RRM Algorithms 203
where PathLoss = PCCCPH/P transmit power – PCCPCH/P RSCP; SIR
T
= SIR target of
the code; and ISCP = Noise Rise. Clearly the sum of powers of all transmitted codes
(by the UE or Node-B) should be less than the maximum limits.
If the allocation to the first timeslot is successful, the allocation procedure is repeated
for the next code in the Code Set. On the other hand, if the allocation was not successful,
then the code is attempted to be allocated to the next timeslot in the timeslot sequence.
This process is completed until all codes are exhausted, resulting in either a successful
allocation to that timeslot sequence or not.
Let the number of successful allocations be N and denoted as {p
1
, p
2
, p
N
}.Inthe
jth allocation p
j
, let the code c
k
be assigned to timeslot i, given by i = f
j
(k).
Now the list of successful timeslot sequences is evaluated for some optimality criterion.
In general, the ‘optimality’ metric may be expressed as a joint function of the Total
Interference in the allocated timeslots and a suitably defined ‘fragmentation penalty’ [3].
We may express the Optimization Metric for the jth timeslot sequence as follows:
J(j) = g(I
T
(j), FP(j))
where I
T
(j ) is the total interference and FP(j) is a suitably defined Fragmentation
Penalty for the jth allocation. The relative significance (weight) given to each of these
aspects is operator specific. For example, higher weight given to fragmentation penalty
pools the timeslots (referred to as ‘slot pooling’). Conversely, if low weight is given to
the fragmentation penalty, codes will tend to get pooled in a small number of timeslots
(referred to as ‘code pooling’).
The total interference is the sum of interferences over all allocated codes and can be
expressed as:
I
T
(j) =
K
k=1
I(f
j
(k)) ·
16
SF(k)
Where I(f
j
(k)) is the ISCP after code k has been allocated to the timeslot f
j
(k).
An example definition of a Fragmentation Penalty is as follows:
frag
penalty(j) =
p · (j − 1) if 0 <j≤ C
∞ if j>C
where p is a fragmentation penalty increment, and C is the maximum number of time-slots
that a UE can support.
The optimal allocation solution is found by computing the above metric for all possible
valid allocations and finding the minimum.
7.3.2.1.1 Dedicated vs Common Measurements
We see from the above analysis that the algorithm needs UE-specific (dedicated) ISCP
and Pathloss parameters. In certain cases, the network (where the RRM algorithms reside)
may not have these measurements. For example, during handovers, the Network may not
know the UE ISCP. Similarly, during UE-initiated NRT data services, the network may
not know UE ISCP and Pathloss. In such cases, the algorithm may still be used based on
ISCP measured at the Node B (non-UE specific) and an average Pathloss. This leads to
Dedicated and Common Measurement-based Optimal Allocation algorithms.
204 Radio Resource Management
7.3.2.1.2 Computationally Efficient Alternatives
The above exhaustive search algorithm is computationally expensive, because the total
number of timeslot sequences is over 1.3 Trillion (15!). Computationally simpler alterna-
tives, with small amount of suboptimality are therefore highly desirable.
Early approaches used a Random method, in which a timeslot from all available times-
lots is chosen randomly [4]. If there are no usable RUs in the timeslot, another timeslot
is selected randomly. The drawback of this approach is obvious, in that there is no sense
of optimality at all!
The following is a method to reduce the number of timeslot sequences, based on the
logic of minimizing interference and fragmentation (referred to as the Fast Permutation
method). Define a Figure of Merit for each timeslot as the weighted sum of the relative
interference of the timeslot and the number of usable resource units in the timeslot, as:
FOM
i
=−α · I
i
+ β · RU
usable
(i)
where α is the weight parameter of the relative interference, β is the weight parameter of
the usable resource units in the time slots {RU
usable
(i), i = 1:15},andI
i
is defined as
I
i
− I
min
, with I
i
being the ISCP in timeslot i and I
min
being the minimum ISCP among all
timeslots. For a given pair of weight factors, the timeslots are sorted according to decreas-
ing FOM. By choosing different weight pairs λ and β, a number of timeslot sequences
is selected, which becomes the reduced search space for the optimization algorithm.
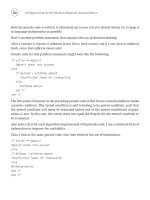
Figure 7.8 shows the performance of the three approaches, namely the N! method, Ran-
dom method and Fast Permutation method. It is seen that the Fast Permutation algorithm
is close to the Exhaustive Search algorithm.
7.3.2.2 Allocation Algorithm 2
We now present a simple scheme, in which the codes are allocated one by one, such that
a joint load and fragmentation metric is minimized. The load takes into account the load
of the current cell as well as neighboring cells.
Considering the uplink first, recall that the load is determined by interference consider-
ations. Let ISCP (i,t), measured at Node B, be the level of interference in timeslot t and
−76
Random Algorithm 4 Slots
Random Algorithm 10 Slots
Fast Permutation 4 Slots
Fast Permutation 10 Slots
Optimal Algorithm 4 Slots
Optimal Algorithm 10 Slots
−78
−80
−82
−84
−86
Effective total interference (dBm)
−88
−90
−92
−94
−96
32 48 64 80
Data rate of the new call (Kbps)
96 112 128 144 160
Random Algorithm 4 Slots
Random Algorithm 10 Slots
Fast Permutation 4 Slots
Fast Permutation 10 Slots
Optimal Algorithm 4 Slots
Optimal Algorithm 10 Slots
−78
−80
−82
−84
−86
−88
Effective total interference (dBm)
−90
−92
−94
−96
−100
−98
32 48 64 80
Data rate of the new call (Kbps)
96 112 128 144 160
Figure 7.8 Performance of 3 DCA Algorithms (Uplink - Downlink)
Physical Layer RRM Algorithms 205
cell i. Assume that one or more codes are added to this timeslot. If one or more codes
are added to this timeslot, the interference increases due to the Noise Rise phenomenon.
The new value of the interference may be predicted as follows:
ISCP
PRED
(i, t) = ISCP(i, t) × R(ISCP(i, t), A(i), SIR),
where A(i) and SIR represent respectively the pathloss to the cell and the sum of the chip-
level SIR targets of the added codes. R(·) represents the predicted increase in interference.
When available, the UE pathloss measurement is used as an input to the noise rise function.
Otherwise, the pathloss value parameter is used, which is determined from the distribution
of pathlosses measured throughout the cell.
The ensuing load in timeslot t of cell i is computed as follows:
L(i, t) = 1 −
N
O
ISCP
PRED
(i, t)
where N
O
represents the receiver noise level.
The load of timeslot t in neighboring cell j is computed as follows:
L(j, t) = 1 −
N
O
ISCP(j, t)
for all j = i, with i being the original cell. ISCP(j,t) is the current ISCP measurement of
the j th Node B.
We can now define an optimization metric in terms of Load and Timeslot Fragmentation.
An example is the following:
L
SYSTEM
(t) =
L(i, t) +
1
j=1,
α
j
L(j, t)
1 + ηN(t)
,
where
1
represents the set of neighboring cells to be included in the overall system load
with corresponding weight factors α
j
. The denominator, 1 + ηN(t), is a fragmentation
adjustment factor, where η corresponds to the fragmentation adjustment parameter and
N(t) corresponds to the number of codes already assigned to this timeslot.
The allocation of codes to timeslots is now done as follows:
1. Select the code with the smallest SF in the code set. Select the first timeslot among
available timeslots.
2. Compute the timeslot loads for the original cell and neighboring cells, as explained
before. Compute the optimization metric for this timeslot.
3. Repeat Step 2 for all available timeslots. Select the timeslot t for which the optimization
metric is the smallest.
4. Repeat Steps 1–3 for the remaining Codes.
In the downlink, a similar scheme is possible, which uses the transmit carrier power of
the original cell and neighboring cells in order to allocate codes to timeslots.
206 Radio Resource Management
The DL ISCP in timeslot t of a UE located in cell i, I
DL
(i, t), can be expressed as:
I
DL
(i, t) = N
O
+
j∈
1
P
T
(j, t)
A(j )
where N
O
, A(j ) and P
T
(j, t) represent respectively the receiver noise level, the attenu-
ation or the pathloss between the UE and cell j, and the total DL transmit power of cell
j in timeslot t. Note that all quantities are expressed using a linear scale.
1
defines the
set of neighboring cells to be included in the interference prediction.
Since the pathloss from the UE to neighboring cells is unavailable, a statistical average
may be used:
E[I
DL
(i, t)] = N
O
+ µ
1
j∈
1
P
T
(j, t),
where µ
1
represents the mean of the link gains (i.e. the inverse of the pathloss) between the
UE and Node Bs serving the neighboring cells. The mean link gains are cell deployment-
specific parameters.
Once the expected interference level is calculated, the interference resulting from the
addition of one or multiple codes in timeslot t of cell i is predicted using the Noise
Rise function:
I
PRED
DL
(i, t) = E[I
DL
(i, t)] × R(E[I
DL
(i, t)], A(i), SI R)
where A(i) and SIR represent respectively the pathloss to the target cell and the sum
of the chip-level SIR targets of the added codes. R(·) represents the predicted increase
in interference. When available, the UE pathloss measurement is used as an input to the
Noise Rise function (e.g. during Handovers). Otherwise, the pathloss value parameter may
be used, which is determined from the distribution of pathlosses measured throughout the
cell. I
PRED
DL
(i, t), expressed in units of Watts, represents the predicted interference level
following the addition of one or multiple codes in the candidate timeslot.
We can now define an optimization metric in terms of Interference and Timeslot Frag-
mentation. An example is the following:
I
W
DL
(i, t) =
I
PRED
DL
(i, t)
1 + γN(t)
The denominator, 1 + γN(t), is a fragmentation adjustment factor, where γ corresponds
to the fragmentation adjustment parameter and N(t) corresponds to the number of codes
already assigned to this timeslot.
The allocation of codes to timeslots is now carried out as follows:
1. Select the first code in the codes to be allocated. (Note that in DL, all codes have the
same SF = 16.)
2. Consider a candidate timeslot for allocation and compute the predicted DL interference
and the optimization metric.
3. Repeat Step 2 for all available timeslots. Select the timeslot t for which the optimization
metric is the smallest.
4. Repeat Steps 1–3 for the remaining Codes.
References 207
REFERENCES
[1] 3GPP TR 25.102 v4.4.0, ‘3GPP; TSG RAN; UE Radio Transmission and Reception (TDD) (Release 4)’,
2002–03.
[2] 3GPP TR 25.105 v4.4.0,‘3GPP; TSG RAN; BS Radio Transmission and Reception (TDD) (Release 4)’,
2002–03.
[3] G. Zhang and E. Ziera ‘Fast Permutation Based Time Slot Allocation for 3G WCDMA TDD Systems’,
VTC 2003, Spring, Chjeju, South Korea.
[4] H. Yomo, A. Nakata and S. Hara, ‘An Efficient Slot Allocation Algorithm to Accommodate Multimedia
Traffic in CDMA/TDD-Based Wireless Communications Systems’, VTC 2001 Fall, Atlantic City, New
Jersey, USA.
8
Deployment Scenarios
8.1 TYPES OF DEPLOYMENT
TDD-based networks exhibit a great deal of flexibility in that they can be deployed in
a number of commercially interesting scenarios. Broadly speaking, these can be clas-
sified into three categories: (1) Wide Area Broadband Data deployment; (2) Hot Zone
deployment; and (3) Capacity Enhancement deployments.
Wide Area Broadband Data deployment scenario is characterized by a stand-alone
(without FDD network) contiguous network over a wide area with nomadic broadband
data services. Typical data rates are expected to be 384/144 (DL/UL) kbps. The coverage
could be provided by co-siting the TDD antennas with GSM/GPRS sites. Both Circuit-
switched and Packet-Switched connectivity is provided. Multiple RNCs are envisaged for
the wide area coverage. It is estimated that some 35% CAPEX savings may be reaped
by the radio network deployment compared to FDD-based coverage for similar services.
For a detailed account of the assumptions and the analysis, see [1].
Capacity Enhancement deployment refers to an integrated FDD and TDD deployment,
where TDD provides capacity relief. In this case, TDD provides all the services of FDD
and supports full mobility of the user. It also avoids the need for cell splitting in case of
traffic overload. The User Terminals are expected to be dual mode FDD-TDD devices.
Compared to the FDD-based capacity solution, the TDD approach can provide up to 43%
savings on CAPEX under certain conditions. For a detailed account of the assumptions
and the analysis, see [1].
The Hot Zone deployment refers to providing WLAN-like services over a zonal cover-
age region. There are many intrinsic attributes of TDD that make such a zonal deployment
attractive relative to WLAN. For example, the range, the radio resource management,
interference mitigation, mobility, etc. These are discussed in the next chapter in compari-
son to other technologies. For now, it suffices to state that urban zonal coverage by TDD
can provide upto 40% savings over WLAN-based deployment. For a detailed account of
the assumptions and the analysis, see [1].
While the above discussion represents various ‘commercial’ deployment scenarios, the
following types are distinguished from a site engineering point of view, which is deter-
mined by the location of the base station and users:
• over-the-rooftop macro or micro-cell deployment;
• street level deployment;
• indoor pico cells.
Wideband TDD: WCDMA for the Unpaired Spectrum P.R. Chitrapu
2004 John Wiley & Sons, Ltd ISBN: 0-470-86104-5
210 Deployment Scenarios
The first type of deployment uses sectorized antennas over the rooftop with users indoors
and outdoors. This type of deployment could be considered as microcellular or macrocellu-
lar depending on the site-to-site distance. It is also referred to as the vehicular environment
deployment [2]. The second type of deployment refers to microcells deployed in a rela-
tively dense manner in the streets at 3–6 meters from the ground. In [2], this is referred
to as the Manhattan-like deployment or Outdoor To Indoor and Pedestrian deployment.
The last type of deployment considers indoor deployment where so-called pico-base sta-
tions are deployed inside buildings. It should be noted that the power used by the base
stations and the size of the cells tend to be the largest in the vehicular environment and
the smallest in the indoor office environment.
Of these, we shall concentrate on the over-the-rooftop deployment, which is the most
challenging from coverage, capacity and coexistence points of view.
8.2 CAPACITY AND COVERAGE
8.2.1 Network Capacity
The revenues that an operator may obtain from the deployment of a network depend on
the number of subscribers that can be supported. Therefore it is useful to define network
capacity as the number of subscribers that can be supported by the network for a given
application or a set of applications, assuming an acceptable level of service. The level of
service is usually determined in terms of blocking (for circuit-switched calls, e.g. voice)
or latency (for packet-switched calls, e.g. web browsing).
A related concept is that of the cell capacity, defined as the number of users that can
be instantaneously supported by the cell. Several factors affect the cell capacity:
• The nature of the deployment and the physical environment (Section 8.1)
• Operator preferences with regards to possible trade-offs between capacity, coverage and
data rates, between uniform coverage through the cell area, on one hand, to gradual
decrease in data rates, on the other. The former will result in reduced cell capacity
but may well be suited to high end services while the latter maximizes capacity at the
expense of reducing user expectations.
• Features unique to TDD that, if employed, increase cell capacity and coverage. These
features include the Multi-User Detection (MUD) and Dynamic Channel Allocation
(DCA).
As discussed in Chapter 6, MUD is a standard TDD receiver technique that effectively
cancels a large fraction of the intra-cell interference. Due to the usage of short codes, the
implementation of MUD can be done in a cost-effective manner in both the handset and
the base station. As explained in Chapter 7, DCA is a procedure of dynamically allocating
slots to users according to measurements. In particular, interference measurement is one
of the factors used to select suitable slots. The outcome of the usage of the procedure
is that users that transmit at high power or that require high downlink power tend to be
segregated in different slots. This outcome effectively reduces the inter-cell interference,
which in turn improves the efficiency of the MUD in removing intra-cell interference.
Combined, they effectively provide full coverage at high data rates and high capacity, in
some cases limited only by the code capacity.
Capacity and Coverage 211
8.2.2 Analysis
For the sake of analysis, the cell capacity is defined as the number of users that can
simultaneously transmit (uplink) or receive (downlink) when the outage is 5% (percentage
of non-served users). An outage can be a user blocked due to lack of code resources or
a user dropped due to its inability to maintain an acceptable signal-to-interference ratio.
It is to be kept in mind that the capacity is directly dependent upon the number of
Resource Units (RUs) per timeslot (TS) as well as the mapping of various services in
terms of RUs. This relationship is non-linear and radio channel allocation algorithms
significantly affect the capacity results.
8.2.2.1 Models for Deployment
For the sake of analysis, the usually irregular pattern of site placement is generally mod-
eled with regular geometry with implied propagation laws:
• Over-the-rooftop deployment is assumed to occur in hexagonal, sometimes sectorized
cells. Pedestrian, outdoor to indoor or vehicular propagation models or their combina-
tions are used [2].
• Street-level deployment is assumed to occur in regularly placed base stations in streets
arranged in a Manhattan-like grid [2]. Outdoor to indoor or pedestrian propagation
models are used.
• Pico deployment assumes office environment. Indoor propagation models are used.
Results in this chapter will focus on the over-the-rooftop deployment.
8.2.2.2 Models for Analysis
In TDD, traffic channels are assigned to different slots, which may be code or resource
limited. Moreover, a typical load is not uniform, because the number of users per timeslot
is small and the law of large numbers does not apply (as it does in FDD). Thus, theoretical
capacity assessments are not straightforward. Therefore, unlike FDD, either the pseudo-
analytic method or a static simulator must be used to determine capacity.
8.2.2.2.1 Pseudo-Analytic Approach
This method is based on computing the achievable signal to interference ratio based on
propagation laws and comparing to the requirements derived from link level simulations.
This is a quick method particularly applicable to downlink coverage estimates in an
arbitrary geometry. Its capacity results are not, however, very accurate and calibration by
other means may be necessary.
The incoming signal from the base stations varies according to the sum of lognormal
random variables arising from the slow fading. Since the sum of these lognormal random
variables is not amenable to closed-form solution, the SIR for each x-y coordinate is
averaged over a large number of trials. The SIR or, more accurately, I
or
/I
oc
, is compared
212 Deployment Scenarios
against the required I
or
/I
oc
to determine whether or not there is a sufficient signal-to-
interference ratio to support communications. Ior and Ioc are defined as:
I
or
= Total transmit power at the Node B antenna connector,
I
oc
= Total noise power at the UE antenna connector.
If the probability is at least 0.9 that I
or
/I
oc
at a given x-y coordinate exceeds its require-
ment, then that point is considered to be ‘covered’. The required level is determined
through link level simulations and is affected by things like FEC, transmit diversity,
power control etc.
The capacity (in terms of number of users that can be supported) may be determined
in one of the following ways.
First, using the (I
or
/I
oc
)
available
-(I
or
/I
oc
)
required
criterion employed to determine coverage,
the number of simultaneous services (of a single type) that can be supported at a given
x-y coordinate is as shown below:
N
users
= 10
(I
or
/I
oc
)
available
− (I
or
/I
oc
)
required
10
; ∀(
ˆ
I
or
/I
oc
)
available
≥ (
ˆ
I
or
/I
oc
)
required
(8.1)
where Ior and Ioc are defined earlier and
ˆ
I
or
= Received power at the UE antenna connector.
The available I
or
/I
oc
may be taken as the 50th percentile level, which provides a more
realistic estimate of the average capacity. The overall capacity within the cell is the
weighted average (by area) of N
users
across the cell.
Alternatively, the available SIR or E
b
/N
0
can be calculated and the number of users
can be determined as shown below:
E
b
N
0
=
G
p
E
c
α(
ˆ
I
or
− E
c
) + I
oc
=
G
p
E
c
I
or
α
1 −
E
c
I
or
+
I
oc
ˆ
I
or
(8.2)
where:
G
p
= Processing Gain (number of chips per bit),
E
c
= Received total energy per chip,
α = Average Orthogonality Factor of Radio links 0 ≤ α ≤ 1.
For cases in which all users are in the same location, N
users
is simply the reciprocal of
E
c
/I
or
and is given by:
N
users
=
G
p
/(E
b
/N
0
)
req
+ α
α + (
ˆ
I
or
/I
oc
)
−1
(8.3)
Example: Consider a downlink utility in which the calculated signal-to-interference levels
are compared against SIR requirements at various points in a grid (which represent pos-
sible UE locations). The network considered is a seven-cell deployment (one sector per
Capacity and Coverage 213
3
4
5
2
1
7
6
UE
Figure 8.1 Example of Cell Layout
−300
−300
−200
−100
0
100
200
300
−200 −100 0 100 200 300
TDD, Site separation = 600 m, Cells utilized = 100%, lor/loc = 6.1 dB
Figure 8.2 Example Coverage at 12.2 kbps
cell) in which the cell of interest is located in the center. The cell radii are set to 300 m,
which is equivalent to the site separation distance of 600 meters. Figures 8.1 and 8.2
depict the cell layout and resulting coverage map.
8.2.2.2.2 Static Simulator Approach
An empirical approach to estimating capacity is to use a Static Simulator. Instead of
attempting to accurately model the time sequence of events occurring in a wireless mobile
system, a static simulator models and captures the stochastic nature of events by creating
a multitude of uncorrelated instantaneous pictures (often referred to as ‘snapshots’) of the
system. By simulating different users in different positions and propagation conditions,
214 Deployment Scenarios
each snapshot depicts a unique realization of the state of the system in regards to received
signal, perceived interference, outage, etc. The results are then averaged to provide useful
statistics. This allows the static simulator to estimate the performance of the system over
a very large number of realizations without having to systematically simulate the whole
chain of events that would have led to them.
The static simulator used for TDD analysis is more complex than its other counterparts.
As TDD slot allocation depends on the interference in the slots, slot allocation can only
be performed one user at a time, allowing the interference to be estimated between user
allocations. Thus the TDD static simulator is designed to conserve the causality of events.
8.2.3 TDD Capacity: Over-the-Rooftop Deployment
The results below have been obtained using the static simulator approach.
8.2.3.1 Assumptions
Figure 8.3 shows the cell layout, including the location of the base stations, which was
used to obtain a set of simulation results. In the simulations, 12 cells are used, with 600 m
distance between base stations. The maximum BS and UE transmit powers are assumed
to be 33 and 22 dBm respectively. The BLER (Block Error Rate) target is assumed to
be 1% for speech and 10% for data (64, 144 or 384 kbps). The maximum number of
resource units per timeslot was assumed to be 16 for uplink and 14 for downlink. The
capacity of the whole of the 12-cell network is analyzed.
Figure 8.4 shows the ‘traffic capacity’ of the above system, in terms of the number of
traffic channels of varying data rates that can be supported in the uplink and downlink.
Eight timeslots were allocated for downlink and 4 timeslots were allocated for uplink.
11
12
3
4
5
2
1
7
6
10
9
8
D = 600 m
Figure 8.3 Example of Cell Layout
Capacity and Coverage 215
0
50
100
150
200
250
300
350
400
Capacity (users)
12.2 64 144 384
Ped-A: DL; 8 TS
Ped-A: UL; 4 TS
Figure 8.4 Example Capacity Numbers for Various Services
The total number of traffic channels that can be supported is determined for 12.2, 64, 144
and 384 kbps in uplink and downlink separately. A pedestrian channel is assumed with a
user speed of 3 km/hr.
Based on the above results, we now estimate the cell capacity in terms of number
of voice and data users, with various combinations of simultaneous uplink and down-
link traffic.
8.2.3.1.1 Voice Capacity
It follows from the data shown in Figure 8.4 that approximately 330 voice users are served
by a 5 MHz TDD carrier, with 8 timeslots being used for downlink and 4 timeslots for
uplink. It is interesting to note that even though voice traffic is symmetric in the uplink
and downlink directions, the number of timeslots needed is not equal in the two direc-
tions due to the higher UL capacity. This is because BS receivers have, in general, better
performance compared to UE receivers. For example, the noise figure of BS receivers
can be 4 dB better, leading to higher capacity in the uplink direction per timeslot. Fur-
thermore, Base Stations typically have receive antenna diversity, which offers significant
capacity benefits.
The unequal allocation of timeslots for a symmetric traffic class (e.g. voice) under-
scores the importance of the flexibility that the WTDD air interface offers in service
implementation. The ability to dynamically allocate UL and DL timeslots allows TDD
to more efficiently support a wide variety of voice and data services. In a symmetric air
interface, such as FDD, one is forced to use an equal number of radio resources in the
uplink and downlink directions. This results in unused (and hence wasted) resources on
the uplink.
8.2.3.1.2 Data Capacity
Data traffic is typically asymmetric, whether the applications are Internet Browsing,
Music/Video Streaming or Image Uploads. Given TDD’s ability to allocate its radio
resources according to the traffic demands, it is illustrative to analyze TDD’s capacity
as a function of traffic asymmetry. Table 8.1 shows the system capacity in the simulated
12-cell system for different traffic asymmetries. The system is deployed over-the-rooftop,
and assumes Pedestrian A – 3 km/h multipath channel profile.
216 Deployment Scenarios
Table 8.1 TDD Capacity vs Traffic Asymmetry
Traffic asymmetry Timeslot allocation Capacity
64 kbps DL/12.2 kbps UL 9/3 200
144 kbps DL/12.2 kbps UL 10/2 115
144 kbps DL/64 kbps UL 8/4 89
384 kbps DL/64 kbps UL 10/2 31
Table 8.2 Robustness of Capacity Relative to Cell Size
Site-to-Site
Distance (m)
DL/UL Rates: 144/64 kbps
DL/UL Timeslots: 8/4
DL/UL Rates: 384/64 kbps
DL/UL Timeslots: 10/2
600 89 31
1200 87 31
1800 76 28
Table 8.3 Robustness of Capacity Relative to Indoor/Outdoor Users
Indoor
Users (%)
DL/UL Rates: 144/64 kbps
DL/UL Timeslots: 8/4
DL/UL Rates: 384/64 kbps
DL/UL Timeslots: 10/2
089 31
80 85 31
8.2.3.1.3 Sensitivity to Cell Separation
The above results were based on a 600-meter Cell Separation. Simulations reveal that
capacity numbers are quite insensitive to increasing the cell separation to 1200 meters,
while suffering only a small decrease till about 1800 meters. Table 8.2 shows the 5%
outage capacity figures for a 12-cell system, using 39 dBm BS and 27 dBm mobiles.
8.2.3.1.4 Sensitivity to Indoor vs Outdoor Users
The above results assumed that all the users were outdoor users. If some of the users were
indoors, they would experience higher pathloss. It was determined by simulations that the
capacity figures do not change significantly even if 30% of all the users were indoors.
Table 8.3 shows the 5% outage capacity figures for a 12-cell system, using 39 dBm BS
and 27 dBm mobiles.
8.3 COEXISTENCE
All cellular wireless systems can suffer from interference between base stations and hand-
sets in adjacent bands and TDD is no exception. In addition to the above, TDD operation
can give rise to two more interference mechanisms, between base station to base sta-
tion (BS-BS) and between mobile and mobile (MS-MS). Depending on the frequency
Coexistence 217
TDD
UL and DL
FDD
UL
1900
MHz
1980
MHz
1920
MHz
5 MHz
10 MHz
15 MHz
Carrier
Separation
Figure 8.5 TDD and FDD UL Carriers
arrangements, these may occur between two or more TDD systems or between TDD and
FDD systems.
Recall that current frequency arrangement in Europe and elsewhere is for the TDD
(Uplink and Downlink) and FDD Uplink to operate in adjacent bands, namely 1900–
1920 MHz and 1920–1980 MHz respectively. This frequency arrangement is depicted in
Figure 8.5. As such, the signals transmitted by the TDD Transmitters could leak into the
FDD receiver and vice-versa. The amount of leakage depends, among other factors to be
discussed later in this section, on the frequency separation of the TDD and FDD carriers.
Clearly, the smallest separation is approximately 5 MHz, between the highest frequency
TDD carrier and the lowest frequency FDD carrier.
The four interference mechanisms between TDD and FDD are depicted in the figure
below (Figure 8.6).
Similarly, TDD systems using different carriers can also interfere with each other.
Figure 8.7 shows the situation where a TDD BS and TDD UE cause interference to other
TDD BS and TDD UE respectively.
Of all the interference scenarios described, the scenarios where the interference between
a UE and a B S operating in adjacent bands do not cause significant concerns are interesting
for a number of reasons. First, the Coupling Loss between the UE and the BS is high
(approximately 70 dB). Second, the interference is of a stochastic nature, due to the
mobility of the UE. This interference mechanism is after all no different from the near–far
interference that is common to all cellular systems and is dealt with in the same manner.
As such, we will only concentrate on the BS → BS and UE → UE interference scenarios.
8.3.1 BS to BS Interference
The amount of interference experienced by a victim Base Station depends upon the amount
of Signal Leakage from the attacking or interfering Transmitter (Adjacent Channel Leak-
age), the amount of signal loss between the two base stations (coupling loss) and the ability
of the receiver to suppress the out of band interference (Adjacent Channel Selectivity).
Figure 8.8 defines relevant quantities.
The adjacent channel leakage is measured in terms of Adjacent Channel Leakage Ratio
(ACLR), which is defined as the ratio of the desired signal power in its channel to the
218 Deployment Scenarios
TDD
BS
FDD
BS
TDD
UE
FDD
UE
TDD
BS
FDD
BS
TDD
UE
FDD
UE
Interference
UL
UL
FDD UE → TDD BS
TDD UE → FDD BS
Interference
TDD BS → FDD BS
Interference
FDD UE → TDD UE
DL
UL
Figure 8.6 TDD–FDD Interference Scenarios
power measured in an adjacent channel. Both the transmitted and the adjacent channel
power are measured through a matched filter (raised root cosine with a roll-off 0.22) with
a noise power bandwidth equal to the chip rate.
A related quantity, the Adjacent Channel Leakage Power (ACLP), is defined as the
absolute amount of power in the adjacent band. That is:
ACLP (dBm) = Tx Power (dBm) − ACLR (dB)
Similarly, the Adjacent Channel Selectivity (ACS) of the receiver is a measure of the
ability of a receiver to filter and reject the signal from adjacent channels. Formally, ACS
is defined as the ratio of the receive filter attenuation on the desired channel frequency to
the receive filter attenuation on the adjacent channel(s) as is illustrated in Figure 8.8. It is,
however, often specified in terms of the maximum interfering signal that can be present
when a desired signal of certain level and data rate is received without degradation.
Other quantities that are related to ACLR are the ACLR2 and spurious emissions which
define the emissions in 10 MHz or more of separation and the blocker requirements which
measure a value equivalent to ACS for the receiver in 10 MHz or more of separation.
8.3.1.1 Coupling Loss and Minimum Coupling Loss
Coupling loss is simply the amount of signal attenuation as measured between the trans-
mitter and receiver and is the sum of the path attenuation and any antenna gain or loss
and cabling losses.
Base stations that interfere with each other may be deployed in the same site or in
different sites in the same area, see Figure 8.9 and Figure 8.10.
Coexistence 219
UL
DL
DL
DL
TDD
BS
TDD
BS
TDD
UE
TDD
UE
TDD
BS
TDD
BS
TDD
UE
TDD
UE
TDD
BS
TDD
BS
TDD
UE
TDD
UE
TDD
BS
TDD
BS
TDD
UE
TDD
UE
Interference
UL
UL
TDD UE → TDD BS
Interference
TDD BS → TDD UE
Interference
TDD BS → TDD BS
Interference
TDD UE → TDD UE
Interference
TDD BS → TDD BS
Interference
TDD UE → TDD UE
DL
UL
Figure 8.7 Interference Scenarios between TDD Systems in Adjacent Bands
Minimum coupling loss is, on the other hand, an agreed number that represents the
lowest reasonable propagation losses between any two transceivers. MCL is related to the
type of deployment.
Within the 3GPP standards, there are two basic deployment categories: (1) co-sited and
(2) same geographic area.
Irrespective of the physical layout implied by the terms, the actual distinction between
the two categories is the minimum coupling loss (MCL) between base stations. Co-sited is
220 Deployment Scenarios
Transmit Filter Receive Filter
Coupling
Loss
TDD Band FDD Band
1915 1920 1925 1915 1920 1925
MHz
MHz
Tx Signal After Filtering
Adjacent Channel
Leakage Power
Adjacent
Channel
Selectivity
Rx Filter Response
Figure 8.8 Three Factors Affecting Interference
TDD System2
TDD System1
600 m
200 m
Figure 8.9 Same-Site TDD Networks
meant to imply an MCL of 30 dB. This MCL may occur for example when two operators
share the same rooftop and do not take any special measures to reduce BS-BS interfer-
ence, i.e. each operator deploys and operates the equipment as though the other operator
does not exist. It must be noted that well-established site-engineering techniques, e.g.
vertical separation of antennas on the same pole, can be applied to co-sited deployments
to significantly increase MCL. In fact, it is possible through site engineering to increase
co-sited MCL to the level of same area MCL. This can be thought of as cooperative
co-siting. Same area deployment is defined, in the context of TDD-FDD coexistence, as
an MCL of 74 dB. This may happen with two base stations that are in proximity to one
Coexistence 221
300 m
TDD System2
TDD System1
Figure 8.10 Same-Area TDD Networks
another but not co-sited (for example, on adjacent roofs) or co-sited in conjunction with
site engineering techniques.
8.3.1.2 ACLP and ACLR
The 3GPP requirements for the level of adjacent channel signal power for TDD and FDD
receivers are shown in Table 8.4 for same area and co-sited deployments.
If the TDD BS is transmitting 34 dBm power, then ACLR is given by (34 – ACLP),
see Table 8.5.
These ACLR requirements can be met by a combination of six or eight section cavity
filters in conjunction with a ‘linearized’ power amplifier at the TDD transmitter.
Table 8.4 TDD and FDD Adjacent Channel Leakage Power Requirements
Scenario Same Area Non-cooperative Co-sited
TDD → FDD −36 dBm −80 dBm
TDD → TDD −29 dBm −73 dBm
Table 8.5 TDD Transmitter ACLR Requirements
Technology Same Area Non-cooperative Co-sited
TDD → FDD 70 dB 114 dB
TDD → TDD 63 dB 107 dB
222 Deployment Scenarios
Table 8.6 FDD and TDD BS ACS
Carrier separation MHz FDD/TDD BS ACS dB
546
10 58
15 66
8.3.1.3 ACS
The values of ACS requirements for TDD and FDD are listed in Table 8.6. (These were
indirectly derived by the ITU from 3GPP TS 25.104 and 3GPP TS 25.105.)
8.3.1.4 Overall Interference
The overall interference experienced by a victim BS receiver consists of two components.
The first is the amount of signal that has leaked into the passband of the BS receive filter
from the adjacent transmitter. Expressed in dB, this is given by (Tx Power of the Adjacent
Transmitter − MCL − ACLR of the Transmitter). The second is the amount of adjacent
transmitter signal that has leaked through the stopband of the receiver filter. Expressed
in dB, this is given by (Tx Power of the Adjacent Transmitter − MCL − ACS). Thus the
overall interference experienced by the victim BS is a c ombination of the ACLR and
ACS according to the equation below:
1
ACIR
=
1
ACLR
+
1
ACS
All quantities expressed as natural numbers (not dB)
8.3.1.5 Effects of Interference
The interference from an aggressing network on the base station is usually called external
interference, to distinguish it from internal interference (sum of inter-cell and intra-cell
interference) and thermal noise. The maximum range of the network is dependent on the
total interference (external and internal) as is limited by the maximum MS power. An
increased external interference would imply either the reduction of range or reduction
of capacity.
For low user density deployment, maximum range must be reached. For this type of
deployment very little noise rise (typically 1 dB) is tolerated. As the user density increases,
the range is reduced while the capacity is constant, thus higher noise rise can be tolerated,
up to 18 dB for pico deployment.
These numbers are relaxed (by 7 dB) for TDD to account for the slotted nature of
TDD, i.e. a TDD BS will not transmit in each timeslot.
Thus, as long as the interference caused by noise rise is below the allowance, the degra-
dation in the victim’s system performance is considered negligible and acceptable. The
interference may also be specified in terms of maximum power at the receiver terminals,
instead of a noise rise at the Base Station.