báo cáo hóa học:" Deriving health state utilities for the numerical pain rating scale" pptx
Bạn đang xem bản rút gọn của tài liệu. Xem và tải ngay bản đầy đủ của tài liệu tại đây (301.66 KB, 9 trang )
RESEARCH Open Access
Deriving health state utilities for the numerical
pain rating scale
Simon Dixon
1*
, Chris D Poole
2
, Isaac Odeyemi
3
, Peny Retsa
3
, Colette Chambers
3
and Craig J Currie
4
Abstract
Background: The use of patient reported outcome measures within cost-effectiveness analysis has become
commonplace. However, specific measures are required that produce values, referred to as ‘utilities’, that are
capable of generating quality adjusted life years. One such measure - the EQ-5D - has come under criticism due to
the inherent limitations of its three-level response scales. In evaluations of chronic pain, the numerical pain rating
scale (NPRS) which has eleven levels is routinely used which has a greater measurement range, but which can not
be used in cost-effetiveness analyses. This study derived utility values for a series of EQ-5D health states that
replace the pain dimensions with the NPRS, thereby allowing a potentially greater range of pain intensities to be
captured and included in economic analyses.
Methods: Interviews were undertaken with 100 member of the general population. Health state valuations were
elicited using the time trade-off approach with a ten year time horizon. Additionally, respondents were asked
where the EQ-5D response scale descriptors of moderate and extreme pain lay on the 11-point NPRS scale.
Results: 625 valuations were undertaken across the study sample with the crude me an health state utilities
showing a negative no n-linear relationship with respect to increasing pain intensity. Relative to a NPRS of zero
(NPRS0), the successive pain levels (NPRS1-10) had mean decrements in utility of 0.034, 0.043, 0.061, 0.121, 0.144,
0.252, 0.404, 0.575, 0.771 and 0.793, respectively. When respondents were asked to mark on the NPRS scale the EQ-
5D pain descriptors of moderate and extreme pain, the median responses were ‘4’ and ‘8’, respectively.
Conclusions: These results demonstrate the potential floor effect of the EQ-5D with respect to pain and provide
estimates of health reduction associated with pain intensity described by the NPRS. These estimates are in excess
of the decrements produced by an application of the EQ-5D scoring tariff for both the United States and the
United Kingdom.
Keywords: health economics, pain measurement, cost-effectiveness, qu ality of life
Background
The use of cost-effectiveness analysis has become an
important part of the health technology assessment pro-
cess [1]. Integral to this is the accurate measurement
and valuation of quality of life. Whilst the problems
associated with defining, describi ng and measuring
health have been long known, additional problems are
created when values capable of being incorporated into
cost-effectiveness analysis are derived. These values,
referred to as ‘utilities’, require specific properties, most
notable of which is that they are anchored on tw o
values; one and zero, representing full health and death
(or a health state considered to be equally preferable to
death). Only with this property can the utility values be
multiplied against lengt h of life to produce quali ty
adjusted life years (QALYs). Intended to be a generic
measure o f health effects, QALYs allow a fuller assess-
ment of cost-effectiveness through comparability across
health care programs [2].
Health state utilities are produced in a number of dif-
ferent ways, but the most common is the use of generic
preference based measures (PBMs). PBMs are a specific
type of patient reported outcome measure; so question-
naires such as the EQ-5D are completed by patients and
* Correspondence:
1
School of Health and Related Research (ScHARR), University of Sheffield,
Sheffield, UK
Full list of author information is available at the end of the article
Dixon et al . Health and Quality of Life Outcomes 2011, 9:96
/>© 2011 Dixon et al; licensee BioMed Central Ltd. This is an Open Access article distributed under the terms of the Creative Commons
Attribution License ( which permits unrestricted use, distribution, and reprodu ction in
any medium, pro vided the original work is properly cited.
then a pre-existing tariff is applied to generate utility
values [2]. However, the relevance of PBMs to all condi-
tions has been called into question with evidence of
poor measurement properties for some patient popula-
tions, including insensitivity to change and floor effects
[3]. Floor effects e xist when the lowest values of ill
health or functioning are not represented by a patient
reported outcome measure. As such, some respondents
would actually describe their health or functioning as
worse that the lowest category. This h as two effects;
firstly, the score fo r these respondents is biased upwards
(on a scale where higher scores represent better health
or functioning) and secondly,anychangeinhealthor
functioning for these respondents is underestimated,
thereby contributing to insensitivity to change.
Pain is a domain in all the main generic PBM descrip-
tive systems, including the EQ-5D [4], SF-6D [5] and
HUI -III [6]. Howev er, there are concerns with the mea-
surement properties of these instruments with respect
to pain [7-10]. In purely descriptive validity terms, the
EQ-5D is particularly open to criticism with only three
levels o f pain; none, moderate and extreme. The SF-6D
and HUI-III offer greater sensitivity to changes due to
the use of 6 and 5 levels, respectively. However, it
unclear whether better descri ptions are offered for their
most severe levels. The severest level of pain as
described within the SF-6D is, “You have pain that
interferes with your normal work (both outside the
home and housework) extremely” and the description
within the HUI-III is “ Severe pain that prevents most
activities”. It should be noted that the SF-6 D descriptive
system that forms the basis of its scoring algorithm is
derivedfromthatoftheSF-36[11]andisformedby
combining both of the pain items from the SF-36 into a
single domain. As such, the SF-6D de scriptive system, is
a simplification of the underlying SF-36.
A systematic review and meta-analysis of utilities in
patients with neuropathic pain has been undertaken
which showed that utilities varied across conditions, and
was correlated with pain intensity as measured by the
NPRS [8]. However, analyses were not provided that
examined potential floor effects or sensitivity to change
relating to any of the PBMs.
Whilst PBMs may have problems describing the full
range of pain intensity, several clinical measures do not
suffer from this problem. Studies evaluating the measure-
ment properties of the NPRS, for example, show that it is
sensitive to changes in pain intensity with hi gh response
rates [12]. From this we conclude that the measurement
range of the NPRS is valuable in describing even the
most severe levels of pain, and the number of levels
makes it sensitive to clinically relevant changes in pain.
In this study we attempt to address the perceived floor
effects and lack of sensitivity of the pain dimension of
the EQ-5D by replacing its three point scale with the
eleven point NPRS. The objectives of the study are to
value a series of health states that incorporate the NPRS
as a description of pain intensity and to calculate decre-
ments in health utility associated with increasing sever-
ity of pain.
Methods
Interview schedule
An interview schedule was constructed that co nsisted of
5 sections. In the first, the re spondent was asked to
complete the EQ-5D to help the m become accustomed
to the idea of describing health in short statements
using the EQ-5D descriptive system. In the second, four
health states that re placed the EQ-5D pain dimension
with the NPRS scale were presented and the respondent
asked to rank the four health states from one to four,
with ‘1’ meaning the best health state and ‘4’ the worst
health state. In section three, a series of ten valuation
tasks using a time trade-off (TTO) approach was pre-
sented (see ‘ TTO tasks’ ). Section four examined the
relationship between the EQ-5D description of pain
levels with the NPRS descriptive approach. In the first
question the respondent was asked to mark on the
NPRS where they felt ‘moderate pain or discomfort’ fell.
In the second question the respondent was asked to
mark on the NPRS where they felt ‘extreme pain or dis-
comfort’ fell. Section five consisted of sociodemographic
questions.
TTO tasks
The TTO approach is used to produce utility values by
asking resondents to identify a length of time (x) in full
health that is equivalent to a longer duration (t) in a
particular health state that is less than full health. The
more an individual is willing to gi ve up length of life in
the health state, in exchange for full health, the less that
health state is valued. The value x/t is the utility [13].
The duration o f the health states was set at 10 y ears
for all valuation tasks which is in line with the methods
that underpin the EQ-5D valuation tariff [4]. Ten years
in the selected health state w as compared to varying
durations of full health in tabular format on the ques-
tionnaire. The first line of the table stated that ‘the [cho-
sen] health state for 10 years followed by death is better
than 0 years in full health followed by death’ after which
the respondent would place a tick, a cross or a question
mark, depending on whether they agreed, disagreed or
were uncertain, respectively. Subsequent lines increased
the time in full health in increments of half a year, until
the final line which stated that ‘the (chosen) health state
for 10 years followed by death is better than 10 years in
full health followed by death’ ,followedbytherespon-
dent’s assessment.
Dixon et al . Health and Quality of Life Outcomes 2011, 9:96
/>Page 2 of 9
In t erms of Torrance’ s notation, the 10 years is t, the
amount of time varied is x. The precise value of x used
to calculate the utility of the selected health state was
the mid-point between the values in the two statements
where the ‘ cross’ and ‘tick’ were closest together. In
other words, when th e respondent switched from agree-
ing to disagreeing with the statements.
In line with Torrance [13], i f respondents considered
the health state to be worse than death, which was
indicated by a cross in the first row of the table
described above, a further valuation task was underta-
ken to derive the necessary data to produce a health
state value. This requires a more complex trade-off
and different calculation to arrive at the utility, but in
essence, it was formatted in the same way as before. A
sequence of fu ll health follo wed by the selected health
state was compared to immediate death. The length o f
time in full health (x) plus the length of time in
selected health state summed to t en years (t), with the
length of time in the two component parts varied
until it was considered of equal value to immediate
death.
The valuation tasks examined 11 health states with
each containing one level of the NPRS, plus a further 7
health states that also included a further dimension
describing other symptoms relating to common side-
effects of medicat ions. These additional 7 valuatio ns are
not used in the results presented in this paper and so
are not described any further. A single EQ-5D health
state was used as the basis for the NPRS valuations; no
problems with mobility or self-care, some problems
associated with usual activities but with no anxiety/
depression (which can be abbreviated to ‘1121’ using the
convention of summarising the levels as numbers ran-
ging from 1 to 3). An example of one of the health
states valued is given in Figure 1.
The purpose of the valuation exercise was to produce
utility decrements for the different levels of pain, and
therefore, values were required for “no pain” plus the 10
pain levels of the NPRS (there are henceforth referred
to as “ nprs0” through to “ nprs10” ). When combined
with the seven symptom states mentioned earlier, this
required 18 health state v aluation tasks, which was con-
sidered too cognitively demanding for respondents. Con-
sequently, two interview schedules (marked ‘A’ and ‘ B’)
were constructed that were identical in structure and
formatting, but differed only in the health states pre-
sented. One health state was replicated in both inter-
views to allow a test of consistency.
Sample and interviewing
100 interviews with members of the general public were
planned. The participants were approached in their own
home, with houses (identified by their number and
street) sampled at random from a list of addresses
within three post al districts of the city of Cardiff. The
postal districts were select ed to reflect a ran ge of socio-
demographic characteristics, although no formal selec-
tion process was used for this.
All interviews were undertaken by a single trained
interviewer. The precise formatting of the interview
schedule was arrived at through a pilot study of seven-
teen members of the public. This also allowed the inter-
viewer to familiarise themselves with the structure and
routing of the interview schedule.
Analysis
Health state values were calculated using the approach
of Torrance [13]. For health states considered better
than being dead, the time i n full health considered to be
equivalent to ten years (’t’) in the target health state (’x’)
was divided by ten, i.e. utility = x/10. For health states
Figure 1 Example of one of the health states used within the survey.
Dixon et al . Health and Quality of Life Outcomes 2011, 9:96
/>Page 3 of 9
considered to be worse than dead, the utility value is
calculated as x/(x-t). All values were included in the
analysis.
In the first of the analyses, means and incremental dif-
ferences in means were described for each of the eleven
NPRS levels. However, this ignores possible differences
in values attributable to the different samples that
received the two alternative interview packs. A multivari-
ate analysis is therefore required to adjust for these dif-
ferences, however, account also needs to be taken of the
correlation between responses from the same individual.
Therefore, coefficients were estimated using generalised
estimating equations with robust standard errors and an
exchangeable autocorrelation matrix in STATA v9.
Additionally, checks of validity and consistency that
had been built into the study design were undertaken.
The first of these compared the rankings within Section
two and the TTO values generated from the responses
in Section three. Convergent validity would be shown if
the direct ranking matched the implied ranking using
the derived TTO values. The second test compared the
values of the health state that was valued in both ver-
sions of the interview schedule. No statistically signifi-
cant d ifferences between the values would suggest that
the different contents of the schedu les did not influence
responses unduly.
Finally, the NPRS ratings of the EQ-5D pain descrip-
tors were calculated. This would give an indica tion of
the extent to which the descriptors covered the range of
pain represented by the NPRS.
Results
Some differences were apparent between the sample
interviewed with the two packs, with slightly more men
and people with lower levels of formal education being
interviewed with pack B (Table 1). When the crude uti-
lities are calculated for all NPRS levels, a monotonically
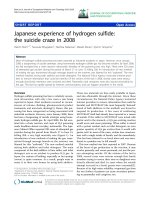
decreasing relationship is seen(Table2).Therelation-
ship between utility and pain intensity appears to be
non-linear and the distribution of values skew toward
lower values except for NPRS levels 8, 9, 10 which
appear approximately normally distributed (Figure 2).
For the multivariate analysis, 625 observations were
available, with the mean number of observations per
respondent being 6.3. The intraclass correlation was
0.033 (95% confidence interval, 0.000 to 0.089). The
coefficients for the decrements in utility from full health
(i.e. one) are consistent with the crude means, with only
two respondent characteristics - interview length and
job type - having a statistically significant influence on
responses (Table 3). Only nprs6 through to nprs1 0 have
statistically significant coefficients. The 95% confidence
intervals for nprs9 and nprs10 incorporated health state
values of less than zero.
A test of the trend in utility values in relation to the
NPRS levels was undertaken by fitting curves to the esti-
mated mean values from the multivariate analysis
described above. A quadr atic curve, estimated as U=
0.957 +0.015 NPRS - 0.10 NPRS
2
,wasfoundtofitthe
data very well with an R-squared of 0.980 and a p-value
of less than 0.001.
When respondents were asked to mark on the NPRS
scale the EQ-5D pain descriptors of moderate and extreme
pain, the median responses were ‘4’ and ‘8’ , respectively
(Table 4). A comparison of values for nprs2 from each of
the two interview packs, using an independent samples t-
test, showed a statistically significant difference of 0.061 (p
< 0.001). This indicates that either the sample characteris-
tics impacted on the values, or the ordering of the health
state value had an effect. An ordering effect is possible as
nprs 2 health state was positioned fourth and 1
st
in the A
and B packs, respectively. A comparison of nprs0, which
was added to both packs part way through the interviews
(n = 73), showed no statistically significant difference in
values (p = 0.486). An ordering effect is not possible with
this comparison as the nprs0 health state was the final
question in both Pack A and Pack B.
A validity check between rankings (Section two) and
valuations (Section three) was possible for Pack A for the
Table 1 Sociodemographic characteristics of the sample
split by survey
Characteristic Survey A Survey B
Number of respondents 48 52
Age (SD) 40.5
(16.1)
41.8
(15.3)
Gender (% female) 58.3 50.0
Highest qualification
GCSE or equivalent 31.8 39.6
HND/BTEC or equivalent 6.8 8.3
A level or equivalent 22.7 10.4
Degree or PhD 38.6 41.7
Occupation
Professional 27.1 30.8
Managerial or technical 20.8 19.2
Manual skilled 16.7 13.5
Non-manual skilled 8.3 15.4
Partly skilled 18.8 17.3
Unskilled 4.2 1.9
Never had a job 4.2 1.9
Dixon et al . Health and Quality of Life Outcomes 2011, 9:96
/>Page 4 of 9
Table 2 Crude means for different NPRS health states
Health state N* Minimum Maximum Mean Std. Deviation Deviation from full health Deviation from nprs0
nprs0 73 0.875 0.975 0.973 0.012 0.027
nprs1 48 0.725 0.975 0.939 0.065 0.061 0.034
nprs2 100 0.475 0.975 0.931 0.085 0.069 0.043
nprs3 52 0.45 0.975 0.912 0.115 0.088 0.061
nprs4 52 0.325 0.975 0.852 0.153 0.148 0.121
nprs5 52 0.375 0.975 0.829 0.157 0.171 0.144
nprs6 48 0.275 0.975 0.721 0.217 0.279 0.252
nprs7 52 -0.379 0.975 0.569 0.319 0.431 0.404
nprs8 48 -0.379 0.975 0.398 0.349 0.602 0.575
nprs9 48 -1.667 0.975 0.202 0.449 0.798 0.771
nprs10 52 -0.379 0.975 0.180 0.327 0.820 0.793
* Pack A had 48 respondents, and pack B had 52 respondents. NPRS2 was in both packs. NPRS 0 was missing from both packs but added part way through the
project to both packs.
Figure 2 Crude values and distributions for health states.
Dixon et al . Health and Quality of Life Outcomes 2011, 9:96
/>Page 5 of 9
nprs2 and nprs6 health states. Other checks within Pack A
and all checks within Pack B involved health states with
an additional symptom domain and so is outside the remit
of this paper. For 34 of the 48 respondents, the ranking
was consistent with the TTO valuation (i.e. nprs2 was
ranked better than nprs6, and the TTO valuation of nprs2
was higher than that for nprs6). For 5 out of 48, nprs2 was
ranked lower than nprs6, and for 9 out of 48, the TTO
value for nprs2 and nprs6 was the same.
Overall 37% of the sample rated the difficulty of t he
valuation exercises as ‘difficult’ or ‘very difficult’ .Only
6% rated them as ‘very difficult’.
Discussion
This study used a novel approach to elicit utility values
ass ociated with different intensities of pain as measured
by the NPRS. The approach adopted involved replacing
the three point verbal pain scale that is integral to the
EQ-5D, with the 11-point NPRS, which is recommended
for clinical research of chronic pain [14]. A series of
health states were then constructed around a fixed state
defined in terms of mobility, self-care, usual activities
and anxiety/depression, but with pain intensity varying
from zero (’no pain’ )to10(’ worst imaginable pain’).
This appro ach was adopted in an attempt to use a vali-
dated descriptive system, but enhance its sensitivity and
range of measurement with respect to pain.
The valuations were completed by all participants,
albeit, with a small number of responses that were
counter intuitive. The sample mean utilities were mono-
tonically decreasing with respect to pain intensity, with
increasing utility decrements as pain intensity increased.
The multivariate analysis showed a very similar pattern
with respect to utility decrements and showed that
those decrements for nprs6 through to nprs10 were sta-
tistically significantly different from zero.
The r esults allow for a much greater range of pain to
be valued in economic evaluations of interventions relat-
ing to pain management. 50% of respondents considered
the most intense level of pain on the EQ-5D to be either
NPRS8 or lower, which reinforces previous fin dings of
Table 3 Decrements from full health adjusted for correlations and respondent characteristics
Independent variables Coefficient (decrements from full health) 95% confidence interval of coefficient
nprs0 0.030 (-0.180 - 0.240)
nprs1 0.066 (-0.140 - 0.272)
nprs2 0.073 (-0.133 - 0.279)
nprs3 0.090 (-0.123 - 0.304)
nprs4 0.150 (-0.065 - 0.365)
nprs5 0.174 (-0.042 - 0.389)
nprs6 0.283 (0.077 - 0.490)**
nprs7 0.434 (0.207 - 0.660)**
nprs8 0.607 (0.397 - 0.817)**
nprs9 0.803 (0.598 - 1.008)**
nprs10 0.822 (0.602 - 1.043)**
Own nprs level -0.013 (-0.028 - 0.002)
gender 0.023 (-0.048 - 0.094)
age -0.001 (-0.002 - 0.001)
ed2-4
+
-
job2-7
++
-*
Self-assessed difficulty -0.022 (-0.056 - 0.011)
Length of interview 0.005 (0.002 - 0.007)**
Key
* significant at 5%
** significant at 1%
+
four education levels were possible. These have been presented as a single variable with the significance tested on all coefficients being zero.
++
seven job types were possible. These have been presented as a single variable with the significance tested on all coefficients being zero.
Table 4 Comparison of EQ-5D and NPRS pain levels
EQ-5D level NPRS level (n = 100)
Mean
(SD)
Median
(25
th
centile, 75
th
centile)
Moderate pain 3.76
(1.138)
4.00
(3.00, 5.00)
Extreme pain 8.13
(1.012)
8.00
(8.00, 9.00)
Dixon et al . Health and Quality of Life Outcomes 2011, 9:96
/>Page 6 of 9
floor effects with respect to the pain dimension of the
EQ-5D. Likewise, the maximum decrement relating to
pain using the United Kingdom tariff [15] is 0.269 (or
0.655 if the n3 term is also attributed solely to extreme
pain)] and 0.537 for the United States tariff [16] (exclud-
ing any D1, I3 or I3-squared effects), compared to 0.822
in this valuation study. These differences suggest that
the EQ-5D underes timates the benefits of the treatment
of higher pain intensities, and as such, the associated
economic evaluations potentially underestimate the
cost-effectivene ss of these pain man agement
interventions.
Despite the innovative approach, there are weakness
to the study. The first problem to consid er is the use of
a single health state on which to add the NPRS. This
design feature was used so that simple, additive decre-
ments related to the intensity of pain could be easily
constructed. At this moment in time, we do not know
to what extent the results are generalisable to other
health states.
A second problem is the design of the health states
tha t were presented to the respondents. Whilst the pre-
sentation of EQ-5D descriptors is straightforward within
valuation studies, w ith the format for each dimension
being the same, the NPRS is a marked deviation from
this (Figure 1). The added prominence of the scale lent
to it by being different, may have caused re spondents to
give additional weight to this dimension of health. This
may have been exaggerated further by moving the NPRS
to the end of the health state , whereas if it had been a
straight replacement for the E Q-5D pain dimension, it
would have been fourth. The need for this formatting
change, h owever, was strongly indicated in the piloting
work as several respond ents found the switching
between narrative and numeric scaling to be distracting.
A further deviation from the EQ-5D descriptive system
is that the NPRS refers only to pain, whilst the dimen-
sion that it replaced refers to ‘pain or discomfort’.
Whilst we are unable to test whether the prominence
of the NPRS could have contributed to greater weight
being given to pain ratings, we can compare the mean
utility value for the NPRS0 health state and the corre-
sponding EQ-5D health state tariff value (11211). This is
perhaps a narrower test of the impact of formatting dif-
ferences on response s as any added prominence of ‘no
pain’ should have no effect. This shows the EQ-5D tariff
value to be 0.883 compared to the estimated value from
our multivariate analysis of 0.970, which indicates a pos-
sible impact of the design on utility values. However,
differences between the sample, and the format of the
elicitation techniques would also be expected to contri-
bute to differences in responses.
Most studies that have examined utilities in patient
populations with pain have typically used PBMs [8].
McDermott [17], for example, reported EQ-5D values in
602 patients with neuropathic pain. Using the Brief Pai n
Inventory (BPI) Pain Sev erity score (which ranges from
0-10) to categorise pain as either ‘mild’ (1-3), moderate
(4-6) or severe (7-10), Mc Dermott and colleagues cal-
culated mean utilities of 0.67, 0.46 and 0.16, respectively.
Comparing these utilities to those in this study is diffi-
cult, because, although the BPI Pain Severity score has
the same numerical scoring, the descriptor for point 10
on the scal e is differ ent to that for the NPRS, and addi-
tionally, the score used by McDermott was an average
of four estimates; current pain, worst pain in the past 24
hours, least pain in the past 24 and average pain in the
past 24 hours. However, the ‘equivalent’ mean utilities
assuming an equal w eighting for each level for NPRS1-
3, NPRS 4-6 and NPRS7-10 are 0.93, 0.80 and 0.34.
Even with the differences in the scales, and potential dif-
ferences in the weighting for each level, these are quite
stark discrepancies.
We expect th at this is due to t he patients within the
McDermott study experiencing other pain-related
impacts on the ir health, f or example, their sample had
higher rates of depression/anxiety and reduced working
time. As such, our utility decrements associated with
pain tend to underestimate the overall effect of pain on
health related quality of life. How these additional
effects can be combined with our NPRS based utility
values is discussed later in this article.
Eldabe et al [18] took a different approach to estimat-
ing utilities for health states relating to severe chronic
pain. Their approach was to develop bespoke health
states describing in tensity of p ain in narrative format,
together with other health impacts that were considered
to be associated with the particular intensity of pain
described. Each narrative description was supposed to
indicate a different range of pai n intensity as measured
by the VAS-PI, so for example, VAS-PI 61-80 was
described as “moderately severe pain that is hard to tol-
erate even with treatment”. These pairings were devised
through clinician interviews and piloting. Four levels of
pain were described and valued using a TTO approach
with health states having a duration of 5 years.
Comparisons with our study are again difficult, but
suggest decrements compared to VAS-PI 0-40 of 0.12,
0.69 and 1.03 for VAS-PI 41-60, VAS-PI 61-80 and
VAS-PI 81-100, respectively. These much greater differ-
ences to the results presented here are again thought to
be primarily due to the co-morbid effect of pain on
other aspects of daily life. These decrements are also
noticeably greater than those reported by McDermott.
The simplest approach to using the NPRS utility
decrements described in this paper is to apply them to
NPRS data within trials to calculate a utility difference
between a control and intervention group. However, as
Dixon et al . Health and Quality of Life Outcomes 2011, 9:96
/>Page 7 of 9
noted previously, this does not take into account the co-
morbid effects of pain on other aspects of health related
quality of life. A direct consequence o f this is that the
utility gain of reductions in pain may be underestimated.
Therefore, the NPRS decrements should be used in
tandem with EQ-5D data collected from patients within
the clinical trials. For any set of EQ-5D from a question-
naire, the EQ-5D scor ing algorithm can be applied to
the four non-pain dimensions, then the decrement with
respect to their NPRS should then be applied. In this
way, any improvement in mobility, self-care, usual activ-
ities and depression/anxiety related to improvements in
pain control would also be captured.
In terms of pain utility values, our approach needs
further work. Firstly, an examination of the effect that
formatting has on responses needs to be undertaken as
the possibility of a ‘prominence effect’ may lead to
biases in the utility values produced. Secondly, explora-
tory work needs to be undertaken to see the extent to
which the NPRS may precipitate other alterations to the
EQ-5D tariff. Only if pain, as measured by the NPRS
remains independent of the other domains, and does
not affect their weighting, can the NPRS utility decre-
ments be legitimately combined with EQ-5D tariff based
scores in the way suggested above. T he easiest way to
examine this is to undertake valuation studies of a selec-
tion of EQ-5D health states and analogous ‘ EQ-5D-
NPRS’ health states within the same study sample, then
test for differences in the values produced. A more com-
plex approach would be to re-estimate a completely new
tariff for the ‘EQ-5D-NPRS’ and test for differences with
the existing EQ-5D tariff (or a new tariff based on a
new valuation study).
The approach reported here was found to produce a
set of values that had face validity - non-linear relation-
ship with respect to pain intensity - and which had a
high level of internal consistency among respondents.
However, the valuations produced in this paper are lim-
ited by their exclusion of the co-morbid effects of pain
on other dimensions. As such, they need to be com-
bined with PBM data in order to fully estimate the
health related quality of life impacts of p ain. In order to
assess the validity of this ‘ mix and match’ approach,
further research is needed to assess the independence of
other scales when incorporated within health states
based on the EQ-5D using the approaches highlighted
above
Conclusions
These results demonstrate the floor effect of the EQ-5D
with respect to pain and provide estimates of health
reduction associated with pain intensity described by the
NPRS. These estimates are in excess of the decrements
produced by an application of the EQ-5D scoring tariff
for both the United States and the United Kingdom.
However, their use in technology assessment is not
straightforward as they do not capture the co-morbid
effects of pain. Consequently, our estimates would have
to be used in tandem with existing scoring algorithms
to capture the full health effects of pain. Combining two
validated measures in this way represents a valuable way
of linking clinical and economic outcome measures, but
further work is required in order to produce more
robust utility estimates that can be used in technology
assessment.
List of abbreviations
NPRS: Numerical pain rating scale; PBM: Preference based measure; QALY:
Quality adjusted life year; TTO: Time trade-off; VAS-PI: Visual analogue scale
for pain intensity
Author details
1
School of Health and Related Research (ScHARR), University of Sheffield,
Sheffield, UK.
2
Global Epidemiology, Pharmatelligence, Cardiff, UK.
3
Health
Economics and Outcomes Research, Astellas Pharma Europe Ltd, Staines, UK.
4
Department of Medicine, School of Medicine, Cardiff University, Cardiff, UK.
Authors’ contributions
SD led the design and analysis of the project and drafting of the
manuscript. CP, CJC, IO, PS and CC contributed to the design and
interpretation of the project and the drafting of the manuscript. All authors
have read and approved the manuscript.
Competing interests
The study was funded by Astellas Pharma Ltd. Isaac Odeyemi, Peny Retsa
and Colette Chambers are currently an employee of Astellas Pharma Ltd.
Astellas manufacture products for pain relief.
Received: 12 July 2011 Accepted: 3 November 2011
Published: 3 November 2011
References
1. National Institute for Health and Clinical Excellence: Guide to the Methods of
Technology Appraisal London: NICE; 2008.
2. Drummond MF, Sculpher MJ, Torrance GW, O’Brien BJ, Stoddart GL:
Methods for the economic evaluation of health care programmes Oxford:
Oxford University Press; 2007.
3. Brazier J, Deverill M, Green C, Harper C, Booth A: A review of the use of
health status measures in economic evaluation. Health Technol Assess
1999, 3(9):1-164.
4. Rabin R, de Charro F: EQ-5D: a measure of health status from the
EuroQol Group. Ann Med 2001, 33:337-43.
5. Brazier J, Roberts J, Deverill M: The estimation of a preference-based
measure of health from the SF-36. J Health Econ 2002, 21:271-292.
6. Feeny D, Furlong W, Boyle M, Torrance GW: Multiattribute health status
classification systems. Health Utilities Index. Pharmacoeconomics 1995,
7:490-502.
7. Brazier J, Roberts J, Tsuchiya A, Busschbach J: A comparison of the EQ-5D
and SF-6D across seven patient groups. Health Econ 2004, 13:873-84.
8. Doth AH, Hansson PT, Jensen MP, Taylor RS: The burden of neuropathic
pain: a systematic review and meta-analysis of health utilities. Pain 2010,
149:338-44.
9. McDonough CM, Grove MR, Tosteson TD, Lurie JD, Hilibrand AS,
Tosteson ANA: Comparison of EQ-5D, HUI, and SF-36-derived societal
health state values among spine patient outcomes research trial
(SPORT) participants. Qual Life Res 2005, 14:1321-1332.
10. Suarez-Almazor ME, Kendall C, Johnson JA, Skeith K, Vincent D: Use of
health status measures in patients with low back pain in clinical
settings. Comparison of specific, generic and preference-based
instruments. Rheumatology 2000, 39:783-790.
Dixon et al . Health and Quality of Life Outcomes 2011, 9:96
/>Page 8 of 9
11. Ware J, Sherbourne CD: The MOS 36-Item Short-Form Health Survey (SF-
36): I. Conceptual Framework and Item Selection. Med Care 1992,
30:473-483.
12. Williamson A, Hoggart B: Pain: a review of three commonly used pain
rating scales. J Clin Nurs 2005, 14:798-804.
13. Torrance GW: Measurement of health state utilities for economic
appraisal. J Health Econ 1986, 5:1-30.
14. Dworking RH, Turk DC, Farrar JT, Haythornwaite JA, Jensen MP, Katz NP,
Kerns RD, Stucki G, Allen RR, Bellamy N, Carr DB, Chandler J, Cowan P,
Dionne R, Galer BS, Hertz S, Jadad AR, Kramer LDq, Manning DC, Martin S,
McCormick CG, McDermott MP, McGrath P, Quessy S, Rappaport BA,
Robbins W, Robinson JP, Rothman M, Royal MA, Simon L, Stauffer JW,
Stein W, Tollett J, Wernicke J, Witter J: Core outcome measures for chronic
pain clinical trials: IMMPACT recommendations. Pain 2005, 113:9-19.
15. Dolan P: Modeling valuations for EuroQol health states. Med Care 1997,
35:1095-1108.
16. Shaw JW, Johnson JA, Coons SJ: US valuation of the EQ-5D health states:
development and testing of the D1 valuation model. Med Care 2005,
43:203-220.
17. McDermott AM, Toelle TR, Rowbotham DJ, Schaefer CP, Dukes EM: The
burden of neuropathic pain: results from a cross-sectional survey. Eur J
Pain 2006, 10:127-135.
18. Eldabe S, Lloyd A, Verdian L, Meduro M, Maclaine G, Dewilde S: Eliciting
health state utilities from the general public for severe chronic pain. Eur
J Health Econ 2010, 11:323-330.
doi:10.1186/1477-7525-9-96
Cite this article as: Dixon et al.: Deriving health state utilities for the
numerical pain rating scale. Health and Quality of Life Outcomes 2011 9:96.
Submit your next manuscript to BioMed Central
and take full advantage of:
• Convenient online submission
• Thorough peer review
• No space constraints or color figure charges
• Immediate publication on acceptance
• Inclusion in PubMed, CAS, Scopus and Google Scholar
• Research which is freely available for redistribution
Submit your manuscript at
www.biomedcentral.com/submit
Dixon et al . Health and Quality of Life Outcomes 2011, 9:96
/>Page 9 of 9