Skills Development in Sub-Saharan Africa phần 3 pot
Bạn đang xem bản rút gọn của tài liệu. Xem và tải ngay bản đầy đủ của tài liệu tại đây (148.32 KB, 27 trang )
paid in current and in future employment can produce underinvestments in
general skills training.
The presence of imperfectly competitive labor markets in many coun-
tries within Sub-Saharan Africa, joined by weak capital and information
markets, raises the risk of market failure and strengthens the case for public
intervention in training markets. The presence of these conditions, however,
has to be assessed on a country-by-country basis.
Determinants of Training
Over the past decade, new information has emerged in micro data sets that
enables the study of individual and employer characteristics that influence
training decisions; however, the majority of these studies refer to experience
in industrial countries. This type of analysis has been largely missing in
many developing countries, and in particular, in Sub-Saharan Africa. Tan
and Batra provide one of the few empirical studies of training in developing
countries. Their study covered Colombia, Indonesia, Malaysia, Mexico, and
Taiwan and focused on manufacturing. They found that 50 to 80 percent of
small firms and 20 to 70 percent of large firms did not provide formal struc-
tured training for employees. Informal on-the-job training by coworkers and
supervisors was more common, but even then more than 20 percent of the
smaller enterprises and 8 to 13 percent of the larger enterprises did not train.
The top three reasons given for the lack of training, especially by micro and
small enterprises, were limited resources, imperfect information on the ben-
efits of training, and potential loss of the investment through turnover.
The benefits that provide incentives for training come from increased pro-
ductivity translated into higher earnings for workers and profits for firms. In
a global survey of training, Middleton, Ziderman, and Adams (1993) found
considerable variance in these benefits in developing countries, with in-
service training generally producing more benefits than preservice training.
Good preservice training can be found, however. In a recent study by
Gill (2003, vol. 2, ch. 3, p. 29), using household labor force and tracer sur-
veys in Mexico for the CONALEP (Colegio Nacional de Educación Profe-
sional Técnica) program, significant economic returns on preservice
vocational training are attributed to an autonomous national organizational
structure, decentralized operations, strong links to industry, industry-expe-
rienced instructors, and modular courses. Tan and Batra find in-service
training associated with higher firm-level productivity in all five economies
they study. In a more detailed examination in three of these economies,
training is associated with higher relative pay.
Evidence exists to connect in-service training in Sub-Saharan Africa with the
payment of higher wages. Bigsten and others (2000) examine rates of return on
physical and human capital in Africa’s manufacturing sector in a survey of
small and large enterprises in five countries: Cameroon, Ghana, Kenya, Zam-
bia, and Zimbabwe. Although the primary focus is on education, earnings func-
tions are estimated that include measures of experience based on age and
30 Skills Development in Sub-Saharan Africa
firm-specific learning measured by tenure of the worker on the current job. The
findings confirm the impact on earnings of learning through experience, but
with differences across countries. Cameroon, Zambia, and Zimbabwe show
similar returns, while Ghana’s returns are higher than average and Kenya’s
lower. The limited evidence available on the impact of training in Sub-Saharan
Africa demonstrates the presence of economic incentives for investments in
training by individuals and enterprises but suggests that the results may vary.
The impact of technological change on training decisions is ambiguous.
One hypothesis holds that by making past education and training obsolete,
technological change encourages workers to invest in on-the-job skills
training to accommodate each new wave of innovation. An alternative
hypothesis contends that general education better enables workers to
adjust to and benefit from technological change and that workers will sub-
stitute general education for specific skills training. Using longitudinal
data from the United States for young men in manufacturing to examine
these hypotheses, Bartel and Sicherman (1998) find that technological
change increases the likelihood of formal company training, narrows the
training gap between educated and less educated workers, and extends
training to those previously lacking it. Tan and Batra (1995) show similar
findings for their sample, with enterprises that invest in technology and
new production methods more likely to offer in-house training.
The innate and acquired abilities of workers are potentially important
determinants of training through their impact on the efficiency with which
workers can acquire new skills (Mincer 1962, Rosen 1976). However, these
abilities can also reduce the incentive to acquire subsequent skills by raising
the value of time spent in work. Using data from the U.S. National Longitu-
dinal Survey of the High School Class of 1972, Altonji and Spletzer (1991)
demonstrate that those who have more education and higher skills are more
likely to engage in training. Curriculum differences seem to have little
impact on subsequent training. Postsecondary education has a particularly
strong positive relationship with training. A significant part of the linkage
reflects differences in aptitude and achievement measured at the end of sec-
ondary school. Tan and Batra (1995) refer to the interaction of education
with technological change. Employers in their sample who invested in new
technologies were more likely to use highly educated workers adept at
working with these technologies and to provide them with training.
Characteristics of the enterprise and the employment also influence training
decisions. Tan and Batra (1995) show that firms are more likely to train when
they are large, employ an educated work force, invest in research and develop-
ment, possess technology or licenses, have foreign capital participation, use
quality control methods, and export to foreign markets. Velenchik (1997) uses a
1993 survey of manufacturing firms in Zimbabwe to investigate the presence of
wage premiums associated with working for larger firms. The breakdown of
these premiums supports the idea that larger firms use higher wages to increase
the quality of their applicant pools, reduce employee turnover, and enhance
worker loyalty. Training plays a role in achieving these ends.
Introduction and Background 31
Occupational requirements linked to the technology of the firm also
shape demands for training. Altonji and Spletzer (1991) demonstrate that
the incidence of training varies directly with the verbal, math, and clerical
skills requirements of an occupation but inversely with the manual skill
requirements.
The growing body of evidence on training provided by micro data thus
confirms the active role of enterprises in training, but shows that it is a role
that is selective, favoring certain firms and workers over others. Smaller
firms train less. Tan and Batra (1995) note in their sample of five developing
countries that small and medium enterprises operate at lower average effi-
ciency levels than their larger counterparts, but that a significant number of
these smaller enterprises are actually more productive than many larger
firms. This is an important finding since it indicates that smaller firms are
not inherently inefficient and that there is a potential for many to become
more productive and competitive. The high returns on training observed
suggest the value of training in achieving this objective.
A second important policy conclusion emerging from this review is the
importance of early schooling as an influence on future access to skills training.
Those who acquire an early foundation of education are more likely to continue
adding to this foundation through training at later stages of the life cycle.
Questions of Particular Relevance to Sub-Saharan Africa
Against this backdrop, several basic questions remain of vital interest for
skills development in Sub-Saharan Africa:
• What should be the role of training when there is not enough modern
sector employment?
• Given the widespread decay in public training systems, what should
be the role of the public sector in training?
• Are private training providers more cost-effective than public sector
training providers? What is the capacity of private training providers
to fill the gap left by declining public investment in training?
• What is the relative importance of training within enterprises and
does the state need to intervene to stimulate it?
• In view of shortages of public financing, how can needed skills devel-
opment be financed?
• What role can financing mechanisms play in improving the effective-
ness and efficiency of training?
The Africa Regional Review of Skills Development
With the passing of a decade since publication of the World Bank’s policy
paper on TVET, a review of reforms and experience is timely. The review,
focused on Sub-Saharan Africa, sets out to capture this experience and the
lessons that can be derived from it in response to the questions posed above.
32 Skills Development in Sub-Saharan Africa
Objectives and Target Audiences
This review of skills development in Sub-Saharan Africa was undertaken to
help answer the questions above and to fill gaps in the knowledge base on
training in the region. Specifically, the review seeks to update knowledge
about TVET in the region; explore issues and recent developments; and dis-
till lessons as a guide to future skills development in the region. The aims
are to inform clients about best practices, build consensus among donors
and clients on these practices, and create Bank staff capacity to assist in
TVET. Therefore, the main target audiences are policymakers and leaders
concerned with skills development in Sub-Saharan Africa, donors to skills
development, and, in particular, Bank staff members.
The review is not intended to be a policy paper offering prescriptions for
country policies. Instead, it is a knowledge product that analyzes recent
trends and practices and identifies possible lessons and guidelines for
future action. It cannot substitute for in-depth analysis of skills develop-
ment within countries. It provides some guidance for country analyses but
cannot replace them.
S
COPE
This review considers skills development by youth and adults
broadly over the life cycle. A decision was made to focus on urban and rural
nonfarm employment and skills development, while recognizing the
importance of employment in agriculture. Agricultural training is vitally
important, particularly in view of the high proportion of people working in
the sector (chapter 2). In fact, agriculture was regarded from the beginning
as so vast and so important a subject that it should be dealt with in a sepa-
rate study. Pre-employment training for agriculture is done mainly through
higher education. Training for farmers is done largely through agricultural
extension services or by suppliers. Coverage of these means is beyond the
scope of this review.
The central issue, then, is how to manage and promote growth in the non-
farm sector. The importance of diversifying into nonfarm skills was also stated
in ILO’s “Jobs for Africa” Program: “As well as increasing output of tradi-
tional crops, rural African economies will have to aim for greater diversity.
This will mean not just producing more crops for export, such as vegetables or
flowers, but also developing a greater range of nonfarm activities. Many of the
poorest workers will need assistance to move in this direction—with greater
access to technology, skills and training” (ILO 1999, p. 14).
A
PPROACH
The review seeks to consolidate information about what
has—and has not—worked in skills development under various circum-
stances. It is based on a general literature review, a review of the Bank’s
operational experience in TVET in the 1990s, and in-depth investigations of
specific thematic issues and case studies.
The review has been conducted in three phases. The first phase encom-
passed a literature review, nine thematic studies, and an initial synthesis of
Introduction and Background 33
findings. The second phase included five additional thematic studies
designed to deepen the analysis and fill gaps in knowledge identified in the
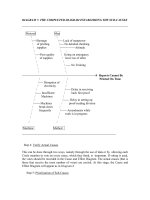
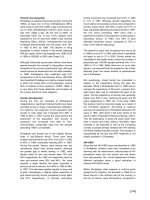
first phase, plus a synthesis. Overall, the 14 thematic studies produced 20
country reviews and 70 case studies. (figure 1.4). The distribution of the
countries and case studies is shown in table 1.1.
The third phase involved extensive consultations and dissemination of
the completed synthesis of findings, first with donors in Edinburgh under
the auspices of the Working Group for International Cooperation in Skills
Development and subsequently with African policymakers and practition-
ers in Turin under the aegis of the International Training Center of the ILO.
The final synthesis report, produced in early 2003, takes into account the
views of clients and partners.
The review has been jointly financed by the World Bank, the Norwegian
government, and the DfID. Partner agencies have made important contribu-
tions. Several studies have been contributed by the International Training
Center of the ILO and the International Institute of Educational Planning of
the United Nations Educational, Scientific, and Cultural Organization
(UNESCO). In addition, the Institute for International Cooperation of the
German Adult Education Association (IIZ/DVV) has collaborated with the
Bank on one study. These organizations provided additional financing for
their studies.
Training serves economic, social, and political objectives. This review
follows the approach taken by the 1991 World Bank study, namely that eco-
nomic and equity objectives are paramount and must be related to actual
prospects for employment and income generation. In other words, the eval-
uation of training programs must be rooted in real possibilities for wage or
self-employment. On the issue of social objectives for training, the Policy
Study noted that pre-employment training generally had not been cost-
effective when used as a supply policy to stimulate industrial growth, to
reduce youth unemployment, to serve academically less able students, or to
34 Skills Development in Sub-Saharan Africa
Figure 1.4. Studies Included in the Review
1. Literature review
2. Labor market developments
(ILO)
3. Review of Bank TVET
lending
4. Financing TVET
5. Public sector training (IIEP)
6, 7. Private sector training—
2 (IIEP)
8, 9. Enterprise training—2 (ILO)
10, 11. Informal sector training—
2 (ILO)
12. Distance learning
13. Literacy and livelihood
skills (IZZ)
14. Vocationalizing secondary
education
15. Entrepreneurship education
and training
16. Synthesis
Total: 14 thematic studies, 20
country reviews, 70 case
studies
change youth aspirations (Middleton, Ziderman, and Adams 1993, pp.
38–39, 70). Instead, it recommended that skills development be focused
exclusively on wage employment and self-employment. Thus, training is
treated throughout this review from an economic perspective, with equity
as a parallel concern. Other political and social objectives of training, such
as human rights of youth, have their valid uses, but are not a primary focus
of this review.
Introduction and Background 35
Table 1.1. Distribution of Country and Case Studies
Countries
Study
Country
reviews
IST I 1 1111 5
IST II 1 1 1 1 1 5
Public sector
training 1 1 1 1 1111 11 10
Total 111112 21111211111 20
Case studies
EBT I 1 1 2
EBT II 1 1 2
IST I 4 3542 18
IST II 4 4 3 3 4 18
Private VET I 1 1 2
Private VET II 1 1 2
Distance
teaching 1 1 1 1 2 6
Entrepreneurship
E&T 1 1 1 1 4
Finance 1 1 1 3
Literacy and
livelihoods 1 1 1 1 1 5
World Bank
lending
review 1 1 1 1 1 5
Vocationalizing
sector 1 1 1 3
Total 524208191103744773270
Notes: IST = informal sector training, EBT = enterprise-based training, E&T = education and
training, VET = vocational education and training. Totals include 20 country reviews, of
which 7 are francophone, and 70 case studies, of which 24 are francophone. Roman numerals
refer to Phase I and Phase II studies.
Benin
Botswana
Cameroon
Côte d’Ivoire
Eritrea
Ghana
Guinea
Kenya
Madagascar
Mali
Mozambique
Niger
Senegal
South Africa
Tanzania
Uganda
Zambia
Zimbabwe
Other
Total
L
IMITATIONS
Weak government capacity for monitoring and evaluation
of TVET in many African settings remains an important constraint on policy
development and reforms. Household data sets for studying the incidence
and impact of training are limited. The review has benefited from the avail-
ability of enterprise data sets covering enterprise training in manufacturing
in eight countries, from the Regional Program on Enterprise Development
(RPED). Against this background, the review has made a substantial invest-
ment in producing additional data on TVET through the thematic and coun-
try case studies.
It is not possible to generalize across a continent of such vastly different
country conditions and circumstances as exist in Sub-Saharan Africa. No
country typologies are developed in the review, apart from some treatment
of differences in anglophone and francophone training systems. Given the
data constraints faced and the diversity of country conditions present, the
findings of this review are offered with a note of caution. On the positive
side, many of the findings appear robust. Extrapolation of these findings,
however, should be limited to economies distinguished by low economic
growth, high population and labor force expansion, and large informal sec-
tors, excluding countries like Mauritius and South Africa.
O
RGANIZATION OF THE
R
EPORT
The report synthesizes 14 thematic
studies and their related case studies. The structure covers the economic set-
ting for skills development with labor market developments (chapter 2),
training provision (chapters 3–6), and training finance (chapter 7). Training
provision covers state-sponsored training (chapter 3), nongovernment
training institutions (chapter 4), enterprise-based training in modern sector
employment (chapter 5), and training for the informal economy and entre-
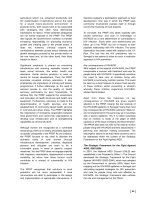
preneurship (chapter 6) (see figure 1.5).
For each provider the emphasis is on issues, recent experiences, innova-
tions, and lessons for future policy and practice. Although the synthesis
36 Skills Development in Sub-Saharan Africa
Institution-
based
providers
Public
(chapter 3)
Private
(chapter 4)
Modern
sector
(chapter 5)
Informal
sector
(chapter 6)
Enterprise-
based
providers
Figure 1.5. Training Provision by Location and Ownership
compiles the main findings from the underlying studies, the views
expressed are those of the authors of this review and not necessarily those of
the authors of the background thematic studies or of the World Bank. All of
the thematic studies have been made available to readers on the external
World Wide Web pages of the World Bank and its Social Protection Network
( Most will subsequently be
published by the World Bank or by partner organizations in this review.
Notes
1. TVET is used in this review to refer to formal and informal sources for skills
acquisition, excluding informal learning on the job. Skills development is used in
referring to the outcome of the learning process without reference to the source of
skills acquisition.
2. With the correct choice of technology, the cotton textile industry can grow
dramatically in African countries because it is a process-based, labor-intensive
activity with limited linkages to other manufacturing sectors. Yet the growth of this
industry can be severely constrained by the absence of 50 to 60 key technicians
(Biggs, Shah, and Srivastava 1995a, pp. 6, 202).
3. Rate-of-return analysis makes the questionable assumptions that observed
wages reflect the marginal productivity of labor and that the content of the addi-
tional years of schooling an individual undertakes is responsible for the marginal
increase in income associated with these years of schooling (Richards and Amjad
1994, pp. 3–4).
4. All dollar amounts are U.S. dollars.
5. “Education for All: Meeting Our Collective Commitments,” Text adopted by
the World Education Forum, Dakar, Senegal, April 26–28, 2000.
6. The New Partnership for Africa’s Development, Abuja, Nigeria, October
2001.
7. African Development Bank, 1999. “Education Sector Policy Paper.” Abidjan:
African Development Bank.
8. The ADB’s statistical information does not isolate TVET or the training com-
ponents included in other sector investments such as agriculture and industry.
9. France has not outlined any cooperation strategy for vocational education
and training. Its efforts derive mainly from local contacts and are related to broader
social objectives rather than economic development targets (Atchoarena and Delluc
2001, pp. 64,169).
10. Featuring close linkages with the macroeconomic framework, the establish-
ment of sectorwide expenditure frameworks, a focus on policy and systems, the har-
monization of donor procedures, and the channeling of resources through existing
government structures and processes and use of coordinated implementation
reviews. See Johanson 2001.
11. See annotated bibliography prepared for this review at http://www.
worldbank.org/labormarkets under the link for “Vocational Education and Train-
ing,” and then for “Special Report on Africa.”
12. See />Introduction and Background 37
2
Labor Market Context and Developments
Labor markets provide incentives for and guide skills development through move-
ments in wages and employment. Labor market outcomes in Sub-Saharan Africa have
been influenced by “environmental” issues ranging from disease and wars to weak
institutions and lack of information on the types of skills needed. Rapid labor force
growth, combined with modest economic expansion and creation of wage employ-
ment, has increased open unemployment. With too few jobs in the modern sector, most
entrants to the labor market have no choice but to work in the informal economy. The
growth of the informal economy poses new challenges to skills development.
Introduction
Rapid expansion of population and the labor force continues in Sub-Saha-
ran Africa, placing considerable pressure on labor markets to absorb new
entrants and provide productive employment for all. Against this back-
ground, economic reforms during the past decade have failed to produce
new wage employment, so that many have pursued self-employment in the
informal sector. This context for skills development is shaped by other labor
market issues, such as open unemployment among youth, gender inequal-
ity, child labor, “brain drain,” and HIV/AIDS.
This chapter establishes the context for skills development in Sub-Saharan
Africa and addresses the following questions:
• What are the characteristics of labor supply and demand and the
major trends in African labor markets?
• What are the structural dimensions of the modern and informal sec-
tors of the economy?
• What challenges are posed by the expansion of the informal sector to
skills development?
• What barriers exist to the use of labor market analysis for guiding
skills development?
39
This chapter is based on Working, But Not Well: Notes on the Nature and Extent of Employment
Problems in Sub-Saharan Africa, by Fred Fluitman, International Training Center of the ILO,
2001. See also Betcherman (2001), Dabalen and others (2000), Haan (2001), and Haan and Ser-
riere (2002).
Income and Poverty
Excluding South Africa, the region’s average income per capita was just
$315 in 1997. Real income in terms of purchasing power parity was one-
third less than in South Asia, making Africa the poorest region in the world
(World Bank 2000, p. 7). GNP per capita in Sub-Saharan Africa decreased by
0.9 percent from 1975 to 1990, and by 0.4 percent from 1990 to 1998.
1
Private
consumption per capita in the region decreased by 1.2 percent per year over
the 1980–1998 period.
2
Gross national product (GNP) in Sub-Saharan Africa stood at $321 bil-
lion in 1999, which represents a mere 1.1 percent of global GNP. Out of a
total population of around 650 million, some 500 million people are esti-
mated to live on less than $2 a day, including some 300 million who live
below the poverty line of $1 a day. Throughout the 1990s, both the number
and the proportion of the poor increased in the region as a whole (Fluitman
2001, p. 24). In Nigeria, which accounts for nearly one-fourth of Sub-
Saharan Africa’s poor, the number of people living in extreme poverty rose
steeply in the 1990s, reaching an estimated 66 percent of the population;
owing to massive migration from rural areas, urban poverty has grown
faster and now matches rural poverty.
3
An array of “environmental” issues constrains the functioning of African
labor markets. Major health issues predominate, such as the high preva-
lence of HIV/AIDS and the fact that nearly 2 million people die of malaria
in the region each year.
HIV/AIDS
According to the United Nations AIDS Prevention Agency (UNAIDS), an
estimated 3.8 million adults and children in Sub-Saharan Africa became
infected with HIV during 2000, bringing the total living with HIV/AIDS to
25.3 million. Over the same period, millions of Africans infected earlier
began experiencing ill health, and 2.4 million people at a more advanced
stage of infection died of HIV-related illnesses. HIV/AIDS differs from
other terminal diseases in that it affects people mainly in their productive
years. Most of the deceased were people of prime working age on whom
others depended for income and care. In the eight African countries in
which at least 15 percent of today’s adults are infected, conservative analy-
ses show that AIDS will claim the lives of one-third of today’s 15-year-olds.
The size of the labor force in high-prevalence countries will be between
10 and 30 percent smaller by 2020 than it would have been without
HIV/AIDS. The number of employees lost to AIDS over the next 10 years
could be the equivalent of 40 to 50 percent of the current work force in some
South African companies (Atchoarena and Delluc 2001, p. 274). For coun-
tries with HIV/AIDS prevalence levels above 20 percent, gross domestic
product (GDP) is estimated to be 2.6 percentage points less per year
(Forsythe 2002, p. 35). The modeling of the impact of HIV/AIDS in Mozam-
40 Skills Development in Sub-Saharan Africa
bique indicates that the economy will be 14–20 percent smaller in 2010
because of reductions in productivity growth, population growth, and
physical and human capital accumulation (Arndt 2003).
Successful business operations require a steady supply of adequately
trained workers. The spread of HIV/AIDS can prevent businesses and
countries from meeting their labor needs, particularly for trained or experi-
enced workers (Forsythe 2002, pp. 31, 35). Unfortunately, empirically well-
grounded studies of the impact of AIDS on rates of productivity growth and
labor force turnover are relatively rare and “patchy” (Bloom, Mahal, and
River Path Associates 2002, p. 13; Simon and others 2000, p. 2). The litera-
ture does suggest the following main points about the skills implications of
HIV/AIDS.
AIDS depletes scarce human capital and magnifies the need to replace
skills lost across a wide range of occupations (World Bank 2000, p. 42). Some
studies have found that HIV infections can be disproportionately concen-
trated among the more skilled and qualified workers at certain stages in the
epidemic (Bloom 2002, p. 6; Simon and others 2000, p. 2; Aventin and Huard
2000, p. 163). These tend to be the hardest categories to replace (Biggs, Shah,
and Srivastava 1995a). Work force turnover does not affect all businesses
equally, but hits especially hard in firms with highly skilled work forces
(Bloom 2002, p. 4). Reductions in the skills of labor force entrants have
potentially serious, but unquantified consequences for business competi-
tiveness (Bloom 2002, p. 10).
HIV/AIDS affects business profitability by increasing production costs
and reducing output. (See Aventin and Huard 2000, p. 171, for a classifica-
tion of direct and indirect costs.) One study divided the economic impact of
work force HIV/AIDS into three categories: (i) the direct costs of pre-
employment training, of in-service and on-the-job training, and of the
salaries paid while new employees become productive; (ii) the indirect costs
of reduced worker performance due to HIV/AIDS sickness on the job; and
(iii) the systemic costs, including the reduction in the average level of skill,
performance, institutional memory, and experience of the work force
(Simon and others 2000). To this should be added the potential cost
increases implicit in the wage inflation that results from skill shortages. The
main costs relate to workdays lost from HIV and AIDS absenteeism. How-
ever, the costs of recruiting and training new staff can also be substantial
(Forsythe 2002, p. 32). A study of firms in Botswana and Kenya early in the
epidemic found that recruitment and training accounted for 16 percent of
the increased labor costs due to HIV/AIDS (Bloom 2002, p. 45).
This early study may have understated the increase in labor costs. The
Africa Competitiveness Report of 1999 showed that business leaders in sev-
eral countries expected moderate to substantial increases in training costs
because of the epidemic (table 2.1).
Apart from direct costs of recruitment and skills training, the loss of
skilled workers affects informal on-the-job training and therefore the overall
stock of knowledge and skills within firms. Socialization and learning
Labor Market Context and Developments 41
within a firm play an important role in the maintenance and renewal of rou-
tines and skills. HIV/AIDS weakens the ability of firms to reconstitute and
renew themselves, an indirect cost that is difficult to quantify. (Aventin and
Huard 2000, pp. 183, 185).
A firm in Zambia described the attrition of key staff to AIDS as a “big
problem” in terms of the loss of key skills, the reduced return on investment
in skills development, and the added challenge of maintaining competitive
levels of consistency and quality (Grierson 2002). As one Kenyan manager
stated, “If you lose someone you have trained for twenty years, that is a
great loss. Condoms and AIDS education cost peanuts” (Bloom 2002, p. 7).
The direct impact on family productivity can be even more devastating with
the loss of skilled, self-employed breadwinners. The death of a breadwinner
cut maize production on a typical small farm in Zimbabwe by more than 60
percent (Fluitman 2001, pp. 30, 34). Entrepreneurs typically manage micro
and small enterprises on their own with family members having little
knowledge of the business. Loss of the owner-manager means the business
closes or is taken over by an inexperienced family member, with associated
lost productivity (ILO 1999).
The full effect of HIV/AIDS has not yet been felt in high-prevalence
countries owing to the long lag between the acquisition of the virus and the
onset of AIDS, but it is clear that productivity growth is bound to suffer.
42 Skills Development in Sub-Saharan Africa
Table 2.1. African Firms That Ranked the AIDS Epidemic as Having a
Moderate or Major Impact on the Costs of Running Their Businesses
(percent)
Reduction in skill level
Country of the work force Increase in training costs
Botswana 45.8 52.5
Burkina Faso 70.0 22.2
Gabon 50.0 25.0
Ghana 14.3 12.9
Kenya 35.2 31.2
Lesotho 50.0 53.3
Malawi 78.0 68.8
Mozambique 45.5 63.6
Namibia 36.7 35.5
South Africa 28.2 34.0
Swaziland 65.4 53.8
Tanzania 28.6 25.6
Uganda 40.0 32.5
Zambia 66.2 56.3
Zimbabwe 50.8 49.6
Source: African Competitiveness Report, as presented in Bloom and others 2000, p. 30.
Among other things, the pandemic will inevitably result in a much younger,
less experienced labor force, with significantly less opportunity for mentoring
or training on the job and reduced incentives for investment in training due to
curtailed life horizons. The supply of skills training (as of other government
services) is also likely to be disrupted. AIDS may have an impact on the qual-
ity or output of training institutions through instructor mortality. Higher
labor force attrition rates will strain already overburdened and inefficient sys-
tems of skills training. Finally, HIV/AIDS not only reduces current levels of
skills but also potentially depresses future investments in skills development.
The mortality of skilled employees reduces company returns on training
investments and discourages additional spending on training (Simon and
others 2000, p. 4). The burden of dealing with HIV/AIDS is also likely to
depress family investments in education and training (DANIDA 2002, p. 88).
Migration
There are long-standing traditions of labor movement across borders such
as between the Sahel and the coast, along the Lagos–Abidjan corridor, and
from Southern to South Africa. In addition, large numbers of people in Sub-
Saharan Africa are being forced to flee their homes and countries as a result
of war and conflict. The U.N. High Commission for Refugees (UNHCR)
estimated that more than 5 million people were affected at the end of 2000,
including 3.4 million refugees, 1.1 million internally displaced persons, and
0.5 million returnees (Fluitman 2001, p. 30). Tanzania alone hosts some
700,000 refugees. These numbers are bound to affect the functioning of both
source and destination labor markets. Moreover, institutions are weak, and
a wide range of structural factors and inequities, including laws, cultural
norms, and access to land, credit, productive inputs, information, and
health care, prevents African women from participating more productively
in their country’s labor markets, (Fluitman 2001, p. 1).
“Brain Drain”
Another aspect of migration also warrants mention: the flow of skilled and
educated workers from the poorer to more advanced countries, or “brain
drain.” Income disparities and a demographic slowdown in industrialized
countries fuel most of the migration. Brain drain occurs not only between
continents, generally from south to north, but also within the region. South
Africa, for example, is able to attract large numbers of the best educated and
skilled workers from its neighbors. Some advanced countries actively
recruit teachers, nurses, or skilled workers in developing countries. Migra-
tion of educated and skilled populations, either intra- or inter-regionally,
can drain resources from poorer countries (DANIDA 2002, p. 83). Not only
do the poorer countries lose their investments in the education and skills of
those who emigrate, but they are also deprived of the emigrants’ contribu-
tions to economic productivity. To an extent, these costs may be offset by
Labor Market Context and Developments 43
repatriation of incomes earned while abroad, but such payments tend to
decline over time. In some instances, return migration may offset the early
losses and bring new skills back to a country.
Labor Supply
Even with recent evidence showing a demographic transition to lower fer-
tility rates in a small group of middle-income countries in Sub-Saharan
Africa (World Bank 2000, p. 16), the region as a whole still has some of the
highest population growth rates in the world. The overall rate was 3 percent
in 1990 and has declined to an estimated 2.4 percent per year only since 1999
(Dabalen and others 2000, p. 4). The population in Sub-Saharan Africa is
expected to increase by 200 million from 653 million in 2000 to 854 million
by 2010 (Fluitman 2001, p. 5).
Rapid population growth foreshadows increases in the size and growth of
the labor force. Between 1990 and 1999 the labor force in Sub-Saharan Africa
is estimated to have grown by 60 million workers, an average of 2.7 percent
per year (Dabalen and others 2000, p. 4). The ILO estimated the total labor
force of the region at 275 million in 1997 and 300 million in 2001, and pro-
jected it would reach 400 million by 2011. The magnitude of Africa’s employ-
ment challenge is stark. On average, every year about 10 million additional
people will seek work and income in one of Africa’s multiple labor markets.
Even if the Sub-Saharan labor force increases at a slower pace, for example,
2.2 percent, the region will have to cope with more than 7 million additional
job seekers each year (Fluitman 2001, pp. 5–6). Hundreds of thousands of
young people enter the labor market every year, mostly from school systems.
They include about 500,000 in Kenya, 700,000 in Tanzania, and 200,000 to
300,000 secondary school-leavers in Zimbabwe (Haan 2001, pp. 51, 92, 147).
Labor force participation rates are comparatively high in Sub-Saharan
Africa. The rates for women are lower than for men, as shown in table 2.2;
however, labor force definitions underestimate the numbers of women
working and their contribution to the gross national product. A detailed
household survey on time use in Benin indicated that, if domestic chores are
taken into account, women work 43 percent more hours per day than men
do (see table 2.3).
The quality of the growing labor force largely reflects past investments in
human capital, especially in education and training. The region’s stock of
human capital is exceedingly low by world standards. Progress has been
achieved in lifting literacy rates in most African countries, but overall levels
are still low, especially for women (see table 2.4).
Enrollment ratios in primary and secondary education are an indicator
of the future quality of human capital. Even with improvements in the late
1990s, Africa is the only region where primary enrollment rates in 1995 fell
below those in 1980 (World Bank 2000, pp. 105–06) Female enrollments were
only about 45 percent of the total at the primary and secondary levels, and
just 35 percent at higher education levels (see table 2.5).
44 Skills Development in Sub-Saharan Africa
Table 2.2. Labor Force Participation Rates, by Gender, 1980 and 1997 (percent)
Labor force Labor force participation rates
Total Annual
(thousand) growth
Country 1997 1980–97 1980 1997 1980 1997 1980 1997
Angola 5,298 2.5 49.4 45.8 53.3 49.7 45.7 41.9
Burkina Faso 5,541 2.3 54.6 50.0 57.7 53.5 51.6 46.5
Cameroon 5,650 2.7 41.8 40.5 53.6 50.8 30.4 30.4
Congo,
Dem. Rep. of 20,074 3.1 44.5 41.8 50.4 47.7 38.8 36.0
Côte d’Ivoire 5,675 3.3 40.0 39.7 53.1 52.2 26.4 26.7
Ethiopia 26,053 2.8 44.9 43.3 52.4 51.0 37.5 35.6
Ghana 8,632 3.1 47.4 47.1 46.8 46.8 47.9 47.3
Kenya 14,376 3.6 47.1 50.6 50.8 54.5 43.3 46.7
Madagascar 7,423 3.1 48.7 46.9 54.0 51.9 43.6 41.8
Mali 5,616 2.8 51.5 48.9 56.2 53.3 47.0 44.6
Mozambique 9,484 2.1 55.3 51.9 57.3 54.3 53.3 49.7
Nigeria 46,791 2.7 41.5 39.5 53.6 50.9 29.7 28.4
South Africa 17,035 2.6 37.5 39.3 48.9 49.4 26.2 29.4
Sudan 10,945 2.8 36.6 39.2 53.4 55.7 19.7 22.7
Tanzania 16,170 3.2 51.2 51.3 52.2 52.6 50.2 50.1
Uganda 10,309 2.5 51.7 49.6 54.3 52.2 49.1 47.0
Zimbabwe 5,383 3.1 44.9 46.1 50.4 51.6 39.5 40.6
Notes: Countries were selected for having a total labor force of more than 5 million each in
1997. The labor force, or economically active population, is defined as all persons of either gender
who furnished the supply of labor for the production of goods and services during a specified
time period. The labor force participation rate is defined here as the ratio of the economically
active population aged 10 years and older, by the population of all ages.
Source: ILO estimates and projections, included in ILO, World Employment Report 1998–99, as
presented in Fluitman 2001, p. 6.
Total Men Women
Table 2.3. Benin: Time Use, by Women and Men
Women Men
Description of activity Urban Rural Urban Rural
Marketed economic activities 13.9 10.5 15.3 11.9
Nonmarketed economic activities 2.4 10.6 1.1 7.8
Domestic activity 13.5 13.6 4.3 4.5
Total work 29.8 34.7 20.7 24.2
Total work and nonwork 100.0 100.0 100.0 100.0
Note: Data are for average time use, by women and men, aged 6 to 65, in urban and rural
areas, 1998, as a percentage of a 24-hour day (1 percentage point equals 15 minutes).
Source: United Nations Development Programme, Rapport sur le développement humain au
Benin 1998, PNUD, Cotonou 1998, as presented in Fluitman 2001, p. 15.
45
Another measure of human capital is the educational attainment of the
population. Levels of primary school completion are exceedingly low in
many countries: just 9 percent in Mauritania, 12 percent in Ethiopia, and 22
percent in Madagascar (the sum of the last three columns in table 2.6).
46 Skills Development in Sub-Saharan Africa
Table 2.4. Adult Literacy Rates, Selected African Countries, 1985 and
1995 (percent)
1985 1995
Country Total Total Men Women
Botswana 63 73 70 75
Burkina Faso 13 20 29 11
Cameroon 55 70 77 62
Côte d’Ivoire 28 40 49 30
Ethiopia 27 36 36 25
Ghana 51 65 75 55
Kenya 64 77 85 69
Mozambique 29 39 55 23
Nigeria 41 56 66 47
South Africa 79 83 84 82
Sudan 35 46 58 35
Tanzania 56 68 79 57
Uganda 51 61 73 50
Note: Rates are percentages of the population, 15 years of age and older.
Source: Based on Association for the Development of Education in Africa:
as quoted in Fluitman 2001, p. 9.
Table 2.5. Gross Enrollment Rates in Africa, 1960–79 (percent)
Level 1960 1970 1980 1990 1997
Primary total 43.2 52.5 79.5 74.8 76.8
Primary female 32.0 42.8 70.2 67.6 69.4
Primary male 54.4 62.3 88.7 81.9 84.1
Primary female as a share of total 37.0 41.0 44.0 45.0 45.0
Secondary total 3.1 7.1 17.5 22.4 26.2
Secondary female 2.0 4.6 12.8 19.2 23.3
Secondary male 4.2 9.6 22.2 25.5 29.1
Secondary female as a share of total 32.0 33.0 36.0 43.0 44.0
Tertiary total 0.2 0.8 1.7 3.0 3.9
Tertiary female 0.1 0.3 0.7 1.9 2.8
Tertiary male 0.4 1.3 2.7 4.1 5.1
Tertiary female as a share of total 20.0 20.0 22.0 32.0 35.0
Source: UNESCO, Statistical Yearbook, 1978–97 and 1998, as presented in World Bank 2000,
p. 106.
Labor Market Context and Developments 47
Table 2.6. Education Levels of Household Heads, Selected African Countries,
1993–97 (percent)
Secondary
Primary Primary Secondary completed/
No not completed, not higher
Country Year education completed no secondary completed education
Côte d’Ivoire 1995 60 5 14 11 10
Ethiopia 1995 75 14 2 6 4
Ghana 1997 41 6 3 36 13
Madagascar 1993 29 49 4 15 3
Mauritania 1995 85 6 2 2 5
Zambia 1996 18 28 19 20 14
Source: Based on data from as
presented in Fluitman 2001, p. 10.
Labor Demand
The question is where do new entrants to the labor market go? The lucky few
find wage employment in the formal sector. Others become openly unem-
ployed. However, the vast majority becomes part of the informal economy
through self-employment. These three destinations are examined further below.
Aggregate labor demand bears no relationship to what is a structural
oversupply of labor in many countries. In other words, there are by far too
few wage jobs for all of the currently un- or under-employed or new
entrants to the labor market (Fluitman 2001, p. 13).
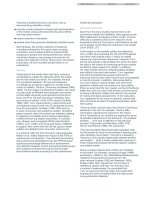
No reliable data are available, but figure 2.1 offers a rough estimate of the
main segments of Sub-Saharan Africa labor markets (excluding South
Africa and Mauritius). Roughly two-thirds of all people employed are
employed in agriculture, mostly in nonwage subsistence agriculture. About
one-third of the labor force is situated in urban areas, of which about 60 per-
cent are self-employed in the informal sector, 20 percent are in wage
employment in the formal sector, and another 20 percent are unemployed.
Employment in the agricultural sector dominates African labor markets.
Except for South Africa and Nigeria, agriculture occupies two-thirds to three-
quarters of the labor force. In contrast, the industrial sector exceeds 10 percent
of employment in only a handful of countries (Ghana and South Africa in fig-
ure 2.2, plus [not shown] Botswana, Côte d’Ivoire, and Mauritius).
The share varies, but wage employment in the formal sector rarely exceeds
20 percent (Fluitman 2001, p. 18). In Uganda, the formal sector is said to absorb
only 10 percent of new labor market entrants (Haan 2001, p. 96). In Zimbabwe,
the formal sector absorbs only 10 percent of the 200,000 to 300,000 secondary
school-leavers (Haan 2001, p. 147). In 1997, in Côte d’Ivoire, only 5 percent of
the labor force was wage-employed in the formal sector, and 43 percent of
these workers were employed by the public sector (Fluitman 2001, p. 19).
The formal economy has been stagnating in most countries in Sub-Saharan
Africa. Zimbabwe had a net addition of about 100,000 wage-employed
workers during the entire decade of the 1990s, less than the number of
annual new entrants to the labor force. Zambia took 20 years to generate
100,000 formal sector jobs. Wage-employment levels in Ghana in the 1990s
fell well below those achieved a decade earlier. Similar contractions
occurred in Côte d’Ivoire and Tanzania (Dabalen and others 2000, p. 6).
Private sector growth has been modest. Employment creation in the pri-
vate sector was either miniscule (except for Botswana and Mauritius) or
negative in the 1990s. The growth of the public sector, which expanded
rapidly in many countries in the 1980s,
4
slowed or contracted with eco-
nomic reforms in the 1990s. In Benin the number of civil servants dropped
from almost 40,000 in 1990 to fewer than 30,000 in 1999 (see table 2.7; Fluit-
man 2001, p. 20) In short, overall formal sector growth, from either private
or public sources, has been minimal.
The formal sector currently does not generate enough jobs to absorb all
labor market entrants. If the formal sector of a given country employed 20
percent of the labor force, then wage employment would have to grow at
12.5 percent per year to absorb the 2.5 percent annual increase in the labor
force (Dabalen and others 2000, p. 4). Allowing for growth in productivity,
formal sector wage employment would need to grow even faster. This
exceeds the realm of feasibility.
48 Skills Development in Sub-Saharan Africa
Urban
unemployed
7%
Urban
formal
sector
7%
Urban
informal
sector
20%
Rural
informal
sector
66%
Figure 2.1. Sub-Saharan Africa: Estimated Proportions of Formal and
Informal Sector Employment
Source: Authors.
IndustryAgriculture
0
10
20
30
40
50
60
70
80
90
Percentage of labor force
Uganda
Tanzania
Sudan
South Africa
Nigeria
Mozambique
Madagascar
Kenya
Ghana
Ethiopia
Figure 2.2. Labor Force Structure, by Major Economic Sector, Selected
African Countries, 1997
Source: ILO, 1998, World Employment Report 1998–99, table 3, ILO, Geneva, as presented in
Fluitman 2001, p. 16.
Table 2.7. Public Sector Wage-Employment, Selected African Countries,
1993–99
Year Benin Côte d’Ivoire Gabon Mauritania Senegal Togo
1993 34,966 123,900 44,794 ——34,130
1994 34,449 120,700 45,694 18,471 66,733 34,736
1995 32,241 118,700 47,247 19,288 67,168 34,467
1996 32,283 116,200 47,386 20,093 67,130 33,855
1997 32,019 117,400 49,476 20,819 65,949 32,931
1998 30,619 110,100 53,620 22,425 66,341 29,753
1999 28,000
a
113,200 52,886 22,950 66,518 32,093
— Not available.
a. From the U.N. Development Programme’s Report on Human Development in Benin, 2000, as
quoted in Fluitman 2001, p. 20.
Source:
49
Increased open unemployment has been one of the consequences of
rapid labor force expansion and minimal economic growth. Officially,
unemployment tends to be low, at 8.1 percent in Ethiopia, 3.9 percent in
Ghana, 8 percent in Cameroon, and 3.2 percent in Madagascar (Fluitman
2001, pp. 22–23). Official rates may be understated because people who are
discouraged from actively seeking employment are not included. However,
as the formal sector stagnates, workers who are not self-employed are
increasingly becoming openly unemployed. South Africa, where 27 percent
of the black labor force is unemployed, is a well-known example but no
longer a special case. A labor force survey in eight major cities in Nigeria put
unemployment at 17 percent. Comparable rates have been observed in
Swaziland (Dabalen and others 2000, p. 13).
Open unemployment is particularly severe among young workers.
Those between the ages of 15 and 24 are disproportionately represented,
making up an estimated 40 percent of all the unemployed. In addition, the
unemployed tend to be relatively better educated, including people edu-
cated at the secondary level. The openly unemployed tend to be concen-
trated in urban areas. In Zambia, the rate in urban areas is three times that in
rural areas. The duration of unemployment is also increasing, compound-
ing the already high social costs of unemployment by further eroding fam-
ily savings and resources (Dabalen and others 2000, p. 14).
Unemployment rates were highest for youths, especially those with
some (primary or secondary) education and those living in urban areas. In
Zambia, Uganda, Malawi, Kenya, and Ghana, unemployment rates for the
age group 15–24 in the mid-1990s were at least two times higher than the
rates for those 40 years and older. This pattern can also be observed in
industrial countries. Unemployment rates among primary school-leavers
for the same countries exceeded 40 percent, and rates for secondary gradu-
ates ranged from 13 percent to 38 percent. Unemployment rates were twice
as high in urban areas as in rural areas of Kenya and over three times as
high in Zambia (Dabalen and others 2000, p. 15).
High rates of youth unemployment have led several African govern-
ments to attempt active labor market programs to ease the transition of
youth, especially educated youth, into employment. Examples include
national youth services or brigades. The success rates of such youth
employment programs have not been promising. At least at the national
level, such programs have not succeeded in reducing rates of unemploy-
ment (Fluitman 2001, pp. 28–29).
The failure of the formal sector to generate enough wage employment to
absorb all labor market entrants has drawn attention to the need for labor
market reforms. As a consequence, structural adjustment programs have
given considerable attention in the past decade to the review and reform of
labor codes that create costly barriers to labor mobility and impede wage
flexibility, especially in francophone countries. Although such reforms may
be important, little evidence has emerged to suggest that reduced labor reg-
ulation is a spur to employment growth and demand for skills. Attention has
50 Skills Development in Sub-Saharan Africa
shifted to getting the macroeconomic policies right, promoting good gover-
nance, and supporting the rule of law in order to spur private investment.
The Informal Sector
The rapid growth of the informal sector is a major consequence of rapid
labor force expansion coupled with minimal growth in wage employment.
Growth in the informal sector is probably a permanent feature for the fore-
seeable future. It is not just a transitory phase, as governments have con-
ceived of and treated it. Instead, micro and small enterprises will remain the
backbone of many developing economies (Haan 2001, p. 167).
The informal sector is heterogeneous and is viewed as consisting of three
segments:
1. Subsistence types of self-employment characterized by part-time
(seasonal) operations, traditional technologies, local materials, and
local markets, a particularly important source of income for poor
rural women.
2. Micro enterprises of up to 10 workers, mostly family members or
apprentices using a mix of technologies, serving rural markets, and
often operating in rural centers.
3. Small-scale enterprises with 10 to 50 workers, using some modern
technologies, semiformalized, and with some growth potential.
Each of these segments has its own set of constraints and requires a particu-
lar support strategy (Haan 2001, p. 169).
Size and Structure
The informal economy is already responsible for most rural nonfarm and
urban employment (figure 2.3). According to a 1997 nationwide household
survey, 87 percent of people employed in Ghana worked in the informal
sector—92 percent in rural areas and 77 percent in urban areas. Official esti-
mates for Cameroon are that 4.2 million people were working in 1996, 15
percent of them in the formal sector and 85 percent in the informal sector.
On average, in Benin the informal sector accounts for 78 percent of nonfarm
employment and more than 92 percent of all employment (Haan and Ser-
riere 2002, pp. 17–24, 133). Almost equal numbers of women and men were
employed, but more women than men worked in the informal sector; for-
mal sector employment is largely a male domain (Fluitman 2001, p. 16). The
informal sector seems to be particularly important for people migrating
from rural to urban areas (Haan and Serriere 2002, p. 134).
Employment in the informal sector has risen sharply since the early
1970s. The informal sector in Benin grew at 10 percent per year between
1979 and 1992 (Haan and Serriere 2002, p. 133). In Uganda informal sector
employment was estimated to be growing 20 percent per year. In Kenya
micro and small enterprises accounted for 10 percent of employment in
Labor Market Context and Developments 51
1972 but 54 percent in 1994. At the same time, public sector employment
declined from 36 to 21 percent, and modern private sector employment
from 54 to 24 percent (Haan 2001, pp. 42, 96).
The informal sector is dominated by small trading activities, which
account for 35 to 88 percent of informal sector enterprises. Services, includ-
ing transport, account for 6 to 26 percent of informal sector enterprises and
manufacturing from 6 to 42 percent in countries reviewed (Haan 2001, Haan
and Serriere 2002).
In West Africa the best known segment of nonfarm employment is l’arti-
sanat, or traditional craft activities. Commonly l’artisanat is equated with
traditional small-scale manufacturing activities, such as blacksmithing,
weaving, and wood carving. More modern activities such as welding, met-
alworking, and furniture making are also included. Small trading and per-
sonal services are not considered part of l’artisanat. Thus, the “artisan
sector” generally represents the “higher end” of the informal sector (Haan
and Serriere 2002, pp. 17, 131). (Figure 2.4 shows the proportions for
selected francophone countries.)
The informal sector is geared to final consumption. Small-scale trading is
mostly for wholesale goods; services consist of repair and personal services
52 Skills Development in Sub-Saharan Africa
0
10
20
30
40
50
60
70
80
90
100
Percentage of employment
South Africa
Senegal
Mozambique
Mauritania
Mali
Kenya
Ghana
Chad
Cameroon
Burkina Faso
Benin
Morocco
Figure 2.3. Informal Sector Employment as a Share of Nonagricultural
Employment, Selected African Countries (1990s)
Source: Based on Haan 2001, table 1.
for consumers. Production of goods for final consumption (garments,
leather products, furniture, foodstuffs) is by far the most important activity
in manufacturing (Haan and Serriere 2002, pp. 18, 134).
Women constitute an important part of informal sector employees.
Given limited opportunities, self-employment in micro businesses has
become the most common form of women’s labor force participation next to
employment on the farm. In many African towns and cities, women repre-
sent a large if not the major share of the self-employed in the informal econ-
omy, including work in retail trading, tailoring, handicraft production, food
processing, and hairdressing (Fluitman 2001, p. 26).
Dynamics and Complexities
The informal sector is neither static nor hermetically separated from mod-
ern wage employment. Many people straddle the line, complementing
income from wage jobs with secondary sources of income generated in the
informal sector (Afenyadu and others, 1999). Or, they move from one sec-
tor to the other. One beneficial consequence of company downsizing due to
Labor Market Context and Developments 53
0
10
20
30
40
50
60
70
80
90
100
Percentage of enterprises
Construction
Services
Manufacturing
Trade
SenegalMali
Madagascar
GuineaCameroonBurkina
Faso
Benin
Figure 2.4. Structure of the Urban Informal Sector, Selected
Francophone Countries, 1980s/1990s
Source: Based on sample surveys in selected urban areas. Based on Haan 2001, table 2.
liberalization and economic reforms has been the transfer of skills between
the formal and informal sectors as workers change sectors.
“Push” rather than “pull” factors have been responsible for the growth
of the informal sector (Haan 2001, p. 168). The informal sector has been con-
sidered the employer of last resort for people who could not find wage
employment. This implies that individuals with low or no education are the
first to enter the informal sector, and studies have confirmed this trend
(Dabalen and others 2000, p. 11).
The informal sector is dynamic, with considerable “churning,” a complex
and uneven process of simultaneous expansion and contraction of different
segments of the sector. When the economy is growing, the high end of the
informal sector in manufacturing and maintenance services thrives, while at
the low end, income-generating activities shrink as the persons employed in
those activities move to more rewarding activities. When the economy stag-
nates, few micro and small enterprises expand, and most lay off workers.
Income-generating activities then grow rapidly (Haan 2001, p. 169).
The character of the informal sector also changes as it expands. New
activities are included; for instance, informal cybercafés. These activities are
started by what some observers call a “new generation” of entrepreneurs in
the informal sector. These entrepreneurs are younger and, on average, better
educated. Reportedly, they do not view the informal sector as an employer
of last resort, but instead have come to appreciate the opportunities offered
by self-employment. These new entrepreneurs in the informal sector are
more open to upgrading not only their own skills but also those of their
workers (Haan and Serriere 2002, pp.17, 135).
The rate of failure among informal sector enterprises is high (13 percent
a year, according to African surveys, but this is probably an underestimate
[Haan 2001, p. 34]). Half of these businesses close for economic reasons and
one-fourth for personal reasons. More than half the closures take place in
the first three years of operation. In Kenya, entrepreneurs of 60 percent of
micro and small enterprises that ceased operation subsequently opened
another business (Haan 2001, p. 34). These patterns are not unusual when
compared with those in other regions.
Education is an important building block for new entrepreneurs in the
informal sector. Educated informal sector entrepreneurs in West Africa are
likely to need less time to enter into self-employment. A typical sequence in
becoming an entrepreneur is to acquire a basic education, then develop
skills through a variety of means (formal training, informal training, on-the-
job training), then obtain wage employment, and finally enter into self-
employment (Haan 2001, p. 23) (see box 2.1).
Problems and Constraints
In view of the extraordinarily large numbers of persons turning to the informal
sector almost everywhere in Sub-Saharan Africa, the informal sector could
reach the limits of its absorptive capacity. Already saturation is evident in a
54 Skills Development in Sub-Saharan Africa