The Global Financial Crisis: Analysis and Policy Implications phần 3 ppt
Bạn đang xem bản rút gọn của tài liệu. Xem và tải ngay bản đầy đủ của tài liệu tại đây (234.01 KB, 15 trang )
The Global Financial Crisis: Analysis and Policy Implications
Congressional Research Service 28
Problem Targets of Policy
Actions Taken or Possibly To
Take
Board)
—Restructure mortgages
—Nationalize debt holding
institutions?
Credit market freeze Lending institutions —Coordinated lowering of interest
rates by central banks/Federal
Reserve
—Guarantee short-term,
uncollateralized business lending
—Capital injection through loans or
stock purchases
Consumer runs on deposits in banks
and money market funds
Banks
Brokerage houses
—Guarantee bank deposits
—Guarantee money market
accounts
—Buy underlying money market
securities to cover redemptions
Declining stock markets Investors
Short sellers
—Temporary ban on short sales of
stock
—Government purchases of stock?
Global recession, rising
unemployment, decreasing tax
revenues, declining exports
National governments —Stimulative monetary and fiscal
policies
—Increased lending by International
Financial Institutions (April 2009 G-
20 declaration to increase IMF
funding)
—Trade policy?
—Support for unemployed
—Cash for Clunkers rebates for
buying new cars with better gas
mileage (June 2009)
Coping with Long-Term, Systemic Problems
Poor underwriting standards
Overly high ratings of collateralized
debt obligations by rating companies
Lack of transparency in ratings
Credit rating agencies
Bundlers of collateralized debt
obligations
Corporate leveraged lenders
—More transparency in factors
behind credit ratings and better
models to assess risk?
—Regulation of Credit Rating
Agencies (April 2, 2009 London
Summit)
—Changes to the IOSCO Code of
Conduct for Credit Rating Agencies?
—Strengthen oversight of lenders?
—Strengthen disclosure require-
ments to make information more
easily accessible and usable?
Incentive distortions for originators
of mortgages (no penalty for
mortgage defaults due to faulty
lending practices)
Mortgage originators
Fannie Mae/Freddie Mac
All participants in the originate-to-
distribute chain
—Require loan originators and
bundlers to provide initial and
ongoing information on the quality
and performance of securitized
assets or to retain a 5% interest in
the security (June 17 Treasury Plan)
—Strengthened oversight of
mortgage originators (June 17
Treasury Plan)
—Penalties for malfeasance by
The Global Financial Crisis: Analysis and Policy Implications
Congressional Research Service 29
Problem Targets of Policy
Actions Taken or Possibly To
Take
originators?
Shortcomings in risk management
practices
Severe underestimation of
risks in the tails of default
distributions and insufficient regard
for systemic risk
Risk models that encourage pro-
cyclical risk taking
Investors
Banks, securities companies
Regulatory agencies
—More prudent oversight of capital,
liquidity, and risk management?
—Raise capital requirements for
complex structured credit products
and to account for liquidity risk (June
17 Treasury Plan)
—Strengthen authorities’
responsiveness to risk?
—Set stricter capital and liquidity
buffers for financial institutions (June
17 Treasury Plan)
Banks had weak controls over off-
balance sheet risks
Bank structured investment vehicles
Bank sponsored conduits
Regulatory agencies
—Strengthen accounting and
regulatory practices?
—Raise capital requirements for off-
balance sheet investment vehicles?
Regulators are “stove piped.” Do not
deal adequately with large complex
financial institutions
Financial intermediaries engaged in a
combination of banking, securities,
futures, or insurance
—create an independent agency to
monitor systemic risk (March 20 and
June 17, 2009 Treasury
Announcements and plans)
—Create a Financial Services
Oversight Council or other
organization to improve interagency
coordination and cooperation (June
17,2009 Treasury plan)
Hedge funds and private equity are
largely unregulated
Information on Credit Default Swaps
not public
Regulatory agencies —extend regulation and oversight to
hedge funds and private equity (April
2, 2009, London Summit, June 17,
2009 Treasury Plan)
—create clearing counterparty for
credit default swaps (March 26, 2009
Treasury Announcement)
Consumers being “victimized” in
credit card, mortgage, and other
financial markets
Bank regulatory agencies —create a Consumer Financial
Protection Agency (June 17, 2009
Treasury Plan)
Problems for International Policy
Lack of consistency in regulations
among nations and need for new
regulations to cope with new risks
and exposures
National regulatory and oversight
authorities
Bank for International Settlements
International Monetary Fund
Financial Stability Board (Financial
Stability Forum)
—Implement G-20 Action Plan
(November 15, 2008 G-20 Summit)
—Implement Basel II (Bank for
International Settlements’ capital and
other requirements for banks) (in
process by countries)
—Bretton Woods II agreement?
—Greater role for the Financial
Stability Board/Forum and
International Monetary Fund (April 2,
2009 London Summit, June 17
Treasury Plan)
—Establish colleges of national
supervisors to oversee financial
sectors across boundaries
(November 15, 2008 G-20 Summit)
The Global Financial Crisis: Analysis and Policy Implications
Congressional Research Service 30
Problem Targets of Policy
Actions Taken or Possibly To
Take
Countries unable to cope with
financial crisis
IMF, Development Banks
National monetary authorities and
governments
—Increased resources for the IMF
and World Bank (April 2, 2009
London Summit) (H.R. 2346,
provided for increase in quota and
loans to the IMF)
—Loans and swaps by capital surplus
countries
—Creation of long-term
international liquidity pools to
purchase assets?
Countries slow to recognize
emerging problems in financial
systems
National monetary and banking
authorities
Governments
IMF
Regional organizations
—Increased IMF and Financial
Stability Board/Forum
macroprudential/systemic oversight,
surveillance and consultations (April
2, 2009 London Summit, June 17
Treasury Plan)
—Build more resilience into the
system?
—Increase reporting requirements?
—Establish colleges of national
supervisors to oversee financial
sectors across national borders
(Nov. 15, 2008, G-20 Summit)
Lack of political support to
implement changes in policy
National political leaders —G-20 international summit
meetings
—Bilateral and plurilateral meetings
and events
Source: Congressional Research Service
Notes: In the Actions to Take column, a “?” indicates that the action or policy has been proposed but is still in
development or not yet taken.
Origins, Contagion, and Risk
88
Financial crises of some kind occur sporadically virtually every decade and in various locations
around the world. Financial meltdowns have occurred in countries ranging from Sweden to
Argentina, from Russia to Korea, from the United Kingdom to Indonesia, and from Japan to the
United States.
89
As one observer noted: as each crisis arrives, policy makers express ritual shock,
then proceed to break every rule in the book. The alternative is unthinkable. When the worst is
passed, participants renounce crisis apostasy and pledge to hold firm next time.
90
Each financial crisis is unique, yet each bears some resemblance to others. In general, crises have
been generated by factors such as an overshooting of markets, excessive leveraging of debt, credit
88
Prepared by Dick K. Nanto. See also, CRS Report RL34730, Troubled Asset Relief Program: Legislation and
Treasury Implementation, by Baird Webel and Edward V. Murphy.
89
For a review of past financial crises, see Luc Laeven and Fabian Valencia. “Systemic Banking Crises: A New
Database,” International Monetary Fund Working Paper WP/08/224, October 2008. 80p.
90
Gelpern, Anna. “Emergency Rules,” The Record (Bergen-Hackensack, NJ), September 26, 2008.
The Global Financial Crisis: Analysis and Policy Implications
Congressional Research Service 31
booms, miscalculations of risk, rapid outflows of capital from a country, mismatches between
asset types (e.g., short-term dollar debt used to fund long-term local currency loans),
unsustainable macroeconomic policies, off-balance sheet operations by banks, inexperience with
new financial instruments, and deregulation without sufficient market monitoring and oversight.
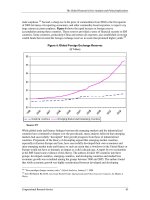
As shown in Figure 2, the current crisis harkens back to the 1997-98 Asian financial crisis in
which Thailand, Indonesia, and South Korea had to borrow from the International Monetary Fund
to service their short-term foreign debt and to cope with a dramatic drop in the values of their
currency and deteriorating financial condition. Determined not to be caught with insufficient
foreign exchange reserves, countries subsequently began to accumulate dollars, Euros, pounds,
and yen in record amounts. This was facilitated by the U.S. trade (current account) deficit and by
its low saving rate.
91
By mid-2008, world currency reserves by governments had reached $4.4
trillion with China’s reserves alone approaching $2 trillion, Japan’s nearly $1 trillion, Russia’s
more than $500 billion, and India, South Korea, and Brazil each with more than $200 billion.
92
The accumulation of hard currency assets was so great in some countries that they diverted some
of their reserves into sovereign wealth funds that were to invest in higher yielding assets than
U.S. Treasury and other government securities.
93
91
From 2005-2007, the U.S. current account deficit (balance of trade, services, and unilateral transfers) was a total of
$2.2 trillion.
92
Reuters. Factbox—Global foreign exchange reserves. October 12, 2008.
93
See CRS Report RL34336, Sovereign Wealth Funds: Background and Policy Issues for Congress, by Martin A.
Weiss.
CRS-32
Figure 2. Origins of the Financial Crisis: The Rise and Fall of Risky Mortgage and Other Debt
The Global Financial Crisis: Analysis and Policy Implications
Congressional Research Service 33
Following the Asian financial crisis, much of the world’s “hot money” began to flow into high
technology stocks. The so-called “dot-com boom” ended in the spring of 2000 as the value of
equities in many high-technology companies collapsed.
After the dot-com bust, more “hot investment capital” began to flow into housing markets—not
only in the United States but in other countries of the world. At the same time, China and other
countries invested much of their accumulations of foreign exchange into U.S. Treasury and other
securities. While this helped to keep U.S. interest rates low, it also tended to keep mortgage
interest rates at lower and attractive levels for prospective home buyers.
94
This housing boom
coincided with greater popularity of the securitization of assets, particularly mortgage debt
(including subprime mortgages), into collateralized debt obligations (CDOs).
95
A problem was
that the mortgage originators often were mortgage finance companies whose main purpose was to
write mortgages using funds provided by banks and other financial institutions or borrowed. They
were paid for each mortgage originated but had no responsibility for loans gone bad. Of course,
the incentive for them was to maximize the number of loans concluded. This coincided with
political pressures to enable more Americans to buy homes, although it appears that Fannie Mae
and Freddie Mac were not directly complicit in the loosening of lending standards and the rise of
subprime mortgages.
96
In order to cover the risk of defaults on mortgages, particularly subprime mortgages, the holders
of CDOs purchased credit default swaps
97
(CDSs). These are a type of insurance contract (a
financial derivative) that lenders purchase against the possibility of credit event (a default on a
debt obligation, bankruptcy, restructuring, or credit rating downgrade) associated with debt, a
borrowing institution, or other referenced entity. The purchaser of the CDS does not have to have
a financial interest in the referenced entity, so CDSs quickly became more of a speculative asset
than an insurance policy. As long as the credit events never occurred, issuers of CDSs could earn
huge amounts in fees relative to their capital base (since these were technically not insurance,
they did not fall under insurance regulations requiring sufficient capital to pay claims, although
credit derivatives requiring collateral became more and more common in recent years). The
94
See U.S. Joint Economic Committee, “Chinese FX Interventions Caused international Imbalances, Contributed to
U.S. Housing Bubble,” by Robert O’Quinn. March 2008.
95
For further analysis, see CRS Report RL34412, Containing Financial Crisis, by Mark Jickling, U.S. Joint Economic
Committee, “The U.S. Housing Bubble and the Global Financial Crisis: Vulnerabilities of the Alternative Financial
System,” by Robert O’Quinn. June 2008.
96
Fannie Mae (Federal National Mortgage Association) is a government-sponsored enterprise (GSE) chartered by
Congress in 1968 as a private shareholder-owned company with a mission to provide liquidity and stability to the U.S.
housing and mortgage markets. It operates in the U.S. secondary mortgage market and funds its mortgage investments
primarily by issuing debt securities in the domestic and international capital markets. Freddie Mac (Federal Home Loan
Mortgage Corp) is a stockholder-owned GSE chartered by Congress in 1970 as a competitor to Fannie Mae. It also
operates in the secondary mortgage market. It purchases, guarantees, and securitizes mortgages to form mortgage-
backed securities. For an analysis of Fannie Mae and Freddie Mac’s role in the subprime crisis, see David Goldstein
and Kevin G. Hall, “Private sector loans, not Fannie or Freddie, triggered crisis,” McClatchy Newspapers, October 12,
2008.
97
A credit default swap is a credit derivative contract in which one party (protection buyer) pays a periodic fee to
another party (protection seller) in return for compensation for default (or similar credit event) by a reference entity.
The reference entity is not a party to the credit default swap. It is not necessary for the protection buyer to suffer an
actual loss to be eligible for compensation if a credit event occurs. The protection buyer gives up the risk of default by
the reference entity, and takes on the risk of simultaneous default by both the protection seller and the reference credit.
The protection seller takes on the default risk of the reference entity, similar to the risk of a direct loan to the reference
entity. See CRS Report RS22932, Credit Default Swaps: Frequently Asked Questions, by Edward V. Murphy.
The Global Financial Crisis: Analysis and Policy Implications
Congressional Research Service 34
sellers of the CDSs that protected against defaults often covered their risk by turning around and
buying CDSs that paid in case of default. As the risk of defaults rose, the cost of the CDS
protection rose. Investors, therefore, could arbitrage between the lower and higher risk CDSs and
generate large income streams with what was perceived to be minimal risk.
In 2007, the notional value (face value of underlying assets) of credit default swaps had reached
$62 trillion, more than the combined gross domestic product of the entire world ($54 trillion),
98
although the actual amount at risk was only a fraction of that amount (approximately 3.5%). By
July 2008, the notional value of CDSs had declined to $54.6 trillion and by October 2008 to an
estimated $46.95 trillion.
99
The system of CDSs generated large profits for the companies
involved until the default rate, particularly on subprime mortgages, and the number of
bankruptcies began to rise. Soon the leverage that generated outsized profits began to generate
outsized losses, and in October 2008, the exposures became too great for companies such as AIG
Risk
The origins of the financial crisis point toward three developments that increased risk in financial
markets. The first was the originate-to-distribute model for mortgages. The originator of
mortgages passed them on to the provider of funds or to a bundler who then securitized them and
sold the collateralized debt obligation to investors. This recycled funds back to the mortgage
market and made mortgages more available. However, the originator was not penalized, for
example, for not ensuring that the borrower was actually qualified for the loan, and the buyer of
the securitized debt had little detailed information about the underlying quality of the loans.
Investors depended heavily on ratings by credit agencies.
The second development was a rise of perverse incentives and complexity for credit rating
agencies. Credit rating firms received fees to rate securities based on information provided by the
issuing firm using their models for determining risk. Credit raters, however, had little experience
with credit default swaps at the “systemic failure” tail of the probability distribution. The models
seemed to work under normal economic conditions but had not been tested in crisis conditions.
Credit rating agencies also may have advised clients on how to structure securities in order to
receive higher ratings. In addition, the large fees offered to credit rating firms for providing credit
ratings were difficult for them to refuse in spite of doubts they might have had about the
underlying quality of the securities. The perception existed that if one credit rating agency did not
do it, another would.
The third development was the blurring of lines between issuers of credit default swaps and
traditional insurers. In essence, financial entities were writing a type of insurance contract without
regard for insurance regulations and requirements for capital adequacy (hence, the use of the term
“credit default swaps” instead of “credit default insurance”). Much risk was hedged rather than
backed by sufficient capital to pay claims in case of default. Under a systemic crisis, hedges also
may fail. However, although the CDS market was largely unregulated by government, more than
850 institutions in 56 countries that deal in derivatives and swaps belong to the ISDA
(International Swaps and Derivatives Association). The ISDA members subscribe to a master
98
Notional value is the face value of bonds and loans on which participants have written protection. World GDP is
from World Bank. Development Indicators.
99
International Swaps and Derivatives Association, ISDA Applauds $25 Trn Reductions in CDS Notionals, Industry
Efforts to Improve CDS Operations. News Release, October 27, 2008.
The Global Financial Crisis: Analysis and Policy Implications
Congressional Research Service 35
agreement and several protocols/amendments, some of which require that in certain
circumstances companies purchasing CDSs require counterparties (sellers) to post collateral to
back their exposures.
100
It was this requirement to post collateral that pushed some companies
toward bankruptcy. The blurring of boundaries among banks, brokerage houses, and insurance
agencies also made regulation and information gathering difficult. Regulation in the United States
tends to be functional with separate government agencies regulating and overseeing banks,
securities, insurance, and futures. There was no suprafinancial authority.
The Downward Slide
The plunge downward into the global financial crisis did not take long. It was triggered by the
bursting of the housing bubble and the ensuing subprime mortgage crisis in the United States, but
other conditions have contributed to the severity of the situation. Banks, investment houses, and
consumers carried large amounts of leveraged debt. Certain countries incurred large deficits in
international trade and current accounts (particularly the United States), while other countries
accumulated large reserves of foreign exchange by running surpluses in those accounts. Investors
deployed “hot money” in world markets seeking higher rates of return. These were joined by a
huge run up in the price of commodities, rising interest rates to combat the threat of inflation, a
general slowdown in world economic growth rates, and increased globalization that allowed for
rapid communication, instant transfers of funds, and information networks that fed a herd instinct.
This brought greater uncertainty and changed expectations in a world economy that for a half
decade had been enjoying relative stability.
An immediate indicator of the rapidity and spread of the financial crisis has been in stock market
values. As shown in Figure 3, as values on the U.S. market plunged, those in other countries were
swept down in the undertow. By mid-October 2008, the stock indices for the United States, U.K.,
Japan, and Russia had fallen by nearly half or more relative to their levels on October 1, 2007.
The downward slide reached a bottom in mid-March 2009, although there still is concern that the
subsequent slow recovery in stock values has been a “bear market bounce” and that these stock
markets may again go into sustained decline. the close tracking of the equities markets in the
United States, Japan, and the U.K. provides further evidence of the global nature of capital
markets and the rapidity of international capital flows.
100
For information on the International Swaps and Derivatives Association, see . In 2008, credit
derivatives had collateralized exposure of 74%. See ISDA, Margin Survey 2008. Collateral calls have been a major
factor in the financial difficulties of AIG insurance.
The Global Financial Crisis: Analysis and Policy Implications
Congressional Research Service 36
Figure 3. Selected Stock Market Indices for the United States, U.K., Japan,
and Russia
3
1
-
O
c
t
-
0
7
3
0
-
N
o
v
-
0
7
3
1
-
D
e
c
-
0
7
3
1
-
J
a
n
-
0
8
2
9
-
F
e
b
-
0
8
3
1
-
M
a
r
-
0
8
3
0
-
A
p
r
-
0
8
3
0
-
M
a
y
-
0
8
3
0
-
J
u
n
-
0
8
3
1
-
J
u
l
-
0
8
2
9
-
A
u
g
-
0
8
3
0
-
S
e
p
-
0
8
3
1
-
O
c
t
-
0
8
2
8
-
N
o
v
-
0
8
3
1
-
D
e
c
-
0
8
3
0
-
J
a
n
-
0
9
2
7
-
F
e
b
-
0
9
3
1
-
M
a
r
-
0
9
3
0
-
A
p
r
-
0
9
2
9
-
M
a
y
-
0
9
3
0
-
J
u
n
-
0
9
3
1
-
J
u
l
-
0
9
1
8
-
A
u
g
-
0
9
Day/Month/Year
20
40
60
80
100
120
140
Stock Market Indices (1 Oct 2007 = 100)
Russ ian RTS
Japan’s Nikkei 225
Dow Jones Industrials
UK FTSE
100
Mild Global Contagion
Severe
Global
Contagion
Source: Factiva database.
Declines in stock market values reflected huge changes in expectations and the flight of capital
from assets in countries deemed to have even small increases in risk. Many investors, who not too
long ago had heeded financial advisors who were touting the long term returns from investing in
the BRICs (Brazil, Russia, India, and China),
101
pulled their money out nearly as fast as they had
put it in. Dramatic declines in stock values coincided with new accounting rules that required
financial institutions holding stock as part of their capital base to value that stock according to
market values (mark-to-market). Suddenly, the capital base of banks shrank and severely curtailed
their ability to make more loans (counted as assets) and still remain within required capital-asset
ratios. Insurance companies too found their capital reserves diminished right at the time they had
to pay buyers of or post collateral for credit default swaps. The rescue (establishment of a
conservatorship) for Fannie Mae and Freddie Mac in September 2008 potentially triggered credit
default swap contracts with notional value exceeding $1.2 trillion.
In addition, the rising rate of defaults and bankruptcies created the prospect that equities would
suddenly become valueless. The market price of stock in Freddie Mac plummeted from $63 on
October 8, 2007 to $0.88 on October 28, 2008. Hedge funds, whose “rocket scientist” analysts
claimed that they could make money whether markets rose or fell, lost vast sums of money. The
101
Thomas M. Anderson, “Best Ways to Invest in BRICs,” Kiplinger.com, October 18, 2007.
The Global Financial Crisis: Analysis and Policy Implications
Congressional Research Service 37
prospect that even the most seemingly secure company could be bankrupt the next morning
caused credit markets to freeze. Lending is based on trust and confidence. Trust and confidence
evaporated as lenders reassessed lending practices and borrower risk.
One indicator of the trust among financial institutions is the Libor, the London Inter-Bank
Offered Rate. This is the interest rate banks charge for short-term loans to each other. Although it
is a composite of primarily European interest rates, it forms the basis for many financial contracts
world wide including U.S. home mortgages and student loans. During the worst of the financial
crisis in October 2008, this rate had doubled from 2.5% to 5.1%, and for a few days much
interbank lending actually had stopped. The rise in the Libor came at a time when the U.S.
monetary authorities were lowering interest rates to stimulate lending. The difference between
interest on Treasury bills (three month) and on the Libor (three month) is called the “Ted spread.”
This spread averaged 0.25 percentage points from 2002 to 2006, but in October 2008 exceeded
4.5 percentage points. By the end of December, it had fallen to about 1.5%. The greater the
spread, the greater the anxiety in the marketplace.
102
As the crisis has moved to a global economic slowdown, many countries have pursued
expansionary monetary policy to stimulate economic activity. This has included lowering interest
rates and expanding the money supply.
Currency exchange rates serve both as a conduit of crisis conditions and an indicator of the
severity of the crisis. As the financial crisis hit, investors fled stocks and debt instruments for the
relative safety of cash—often held in the form of U.S. Treasury or other government securities.
That increased demand for dollars, decreased the U.S. interest rate needed to attract investors, and
caused a jump in inflows of liquid capital into the United States. For those countries deemed to be
vulnerable to the effects of the financial crisis, however, the effect was precisely the opposite.
Demand for their currencies fell and their interest rates rose.
Figure 4 shows indexes of the value of selected currencies relative to the dollar for countries in
which the effects of the financial crisis have been particularly severe. For much of 2007 and
2008, the Euro and other European currencies, including the Hungarian forint had been
appreciating in value relative to the dollar. Then the crisis broke. Other currencies, such as the
Korean won, Pakistani rupee, and Icelandic krona had been steadily weakening over the previous
year and experienced sharp declines as the crisis evolved. Recently, however, they have recovered
slightly.
For a country in crisis, a weak currency increases the local currency equivalents of any debt
denominated in dollars and exacerbates the difficulty of servicing that debt. The greater burden of
debt servicing usually has combined with a weakening capital base of banks because of declines
in stock market values to further add to the financial woes of countries. National governments
have had little choice but to take fairly draconian measures to cope with the threat of financial
collapse. As a last resort, some have turned to the International Monetary Fund for assistance.
102
For these and other indicators of the crisis in credit, see />economy/20081008-credit-chart-graphic.html.
The Global Financial Crisis: Analysis and Policy Implications
Congressional Research Service 38
Figure 4. Exchange Rate Values for Selected Currencies Relative to the U.S. Dollar
1
0
/
3
1
/
2
0
0
7
1
1
/
3
0
/
2
0
0
7
1
2
/
3
1
/
2
0
0
7
1
/
3
1
/
2
0
0
8
2
/
2
9
/
2
0
0
8
3
/
3
1
/
2
0
0
8
4
/
3
0
/
2
0
0
8
5
/
3
0
/
2
0
0
8
6
/
3
0
/
2
0
0
8
7
/
3
1
/
2
0
0
8
8
/
2
9
/
2
0
0
8
9
/
3
0
/
2
0
0
8
1
0
/
3
1
/
2
0
0
8
1
1
/
2
8
/
2
0
0
8
1
2
/
3
1
/
2
0
0
8
1
/
3
0
/
2
0
0
9
2
/
2
7
/
2
0
0
9
3
/
3
1
/
2
0
0
9
Month/Day/Year
20
40
60
80
100
120
140
Currency Exchange Rates in Dollars (Oct 1, 2007 = 100)
Eur o
Hungarian Forint
Icelandic Krona
Pakistani Rupees
South Korean Won
Mild Global Contagion
Severe
Global
Contagion
Source: Data from PACIFIC Exchange Rate Service, University of British Columbia.
As economies weakened, governments moved from shoring up their financial institutions to
coping with rapidly developing recessionary economic conditions. While actions to assist banks,
insurance companies, and securities firms recover or stave off bankruptcy continued, stimulus
packages became policy priorities. In the fourth quarter of 2008, economic growth rates dropped
in some countries at rates not seen in decades.(See Figure 1) China alone has estimated that 20
million workers have become unemployed. Table 2 shows stimulus packages by selected major
countries of the world. While the $787 billion package by the United States is the largest, China’s
$586 billion, the European Union’s $256 billion, and Japan’s $396 billion packages also are quite
large. Appendix A provides a more complete list of stimulus packages by country.
The Global Financial Crisis: Analysis and Policy Implications
Congressional Research Service 39
Table 2. Stimulus Packages by Selected Countries
Date
Announced
Country $Billion Status, Package Contents
17-Feb-09 United
States
787.00 Infrastructure technology, tax cuts, education, transfers to states, energy,
nutrition, health, unemployment benefits. Budget in deficit.
4-Feb-09 Canada 32.00 Two-year program. Infrastructure, tax relief, aid for sectors in peril.
Government to run an estimated $1.1 billion budget deficit in 2008 and $52
billion deficit in 2009.
7-Jan-09 Mexico 54.00 Infrastructure, a freeze on gasoline prices, reducing electricity rates, help for
poor families to replace old appliances, construction of low-income housing
and an oil refinery, rural development, increase government purchases from
small- and medium-sized companies. Paid for by taxes, oil revenues, and
borrowing.
12-Dec-08 European
Union
39.00 Total package of $256 billion called for states to increase budgets by $217
billion and for the EU to provide $39 billion to fund cross-border projects
including clean energy and upgraded telecommunications architecture.
13-Jan-09 Germany 65.00 Infrastructure, tax cuts, child bonus, increase in some social benefits, $3,250
incentive for trading in cars more than nine years old for a new or slightly
used car.
24-Nov-08 United
Kingdom
29.60 Proposed plan includes a 2.5% cut in the value added tax for 13 months, a
postponement of corporate tax increases, government guarantees for loans
to small and midsize businesses, spending on public works, including public
housing and energy efficiency. Plan includes an increase in income taxes on
those making more than $225,000 and increase National Insurance
contribution for all but the lowest income workers.
5-Nov-08 France 33.00 Public sector investments (road and rail construction, refurbishment and
improving ports and river infrastructure, building and renovating
universities, research centers, prisons, courts, and monuments) and loans
for carmakers. Does not include the previously planned $15 billion in
credits and tax breaks on investments by companies in 2009.
16-Nov-08
Italy 52.00
(3.56)
Three year program. Measures to spur consumer credit, provide loans to
companies, and rebuild infrastructure.
Feb. 6, 2009, $2.56 billion stimulus package that is part of the three-year
program. Included payments of up to $1,950 for trading in an old car for a
new, less polluting one and 20% tax deductions for purchases of appliances
and furniture. Additional $1 billion allocated in March 2009 for building a
bridge and increasing welfare aid.
20-Nov-08 Russia 20.00 Cut in the corporate profit tax rate, a new depreciation mechanism for
businesses, to be funded by Russia’s foreign exchange reserves and rainy day
fund.
10-Nov-08 China 586.00 Low-income housing, electricity, water, rural infrastructure, projects aimed
at environmental protection and technological innovation, tax deduction for
capital spending by companies, and spending for health care and social
welfare.
13-Dec-08
6-Apr-09
Japan
Japan
250.00
146.00
Increase in government spending, funds to stabilize the financial system
(prop up troubled banks and ease a credit crunch by purchasing commercial
paper), tax cuts for homeowners and companies that build or purchase new
factories and equipment, and grants to local government. The April 2009
package included increasing the safety net for non-regular workers,
supporting small businesses, new car purchase subsidies, revitalizing regional
economies, promoting solar power and nursing and medical services.
The Global Financial Crisis: Analysis and Policy Implications
Congressional Research Service 40
Date
Announced
Country $Billion Status, Package Contents
3-Nov-08
9-Feb-09
South
Korea
South
Korea
14.64
37.87
$11 billion for infrastructure (including roads, universities, schools, and
hospitals; funds for small- and medium-business, fishermen, and families with
low income) and tax cuts. Includes an October 2008 stimulus package of
$3.64 billion to provide support for the construction industry.
The government announced its intention to invest $37.87 billion over the
next four years in eco-friendly projects including the construction of dams;
“green” transportation networks such as low-carbon emitting railways,
bicycle roads, and other public transportation systems; and expand existing
forest areas.
28-Nov-08 Taiwan 15.60 Shopping vouchers of $108 each for all citizens, construction projects to be
carried out over four years include expanding metro systems, rebuilding
bridges and classrooms, improving, railway and sewage systems, and renew
urban areas.
26-Jan-09 Australia 35.2 $7 billion stimulus package in October 2008 was cash handouts to low
income earners and pensioners. January’s $28.2 billion package includes
infrastructure, schools and housing, and cash payments to low- and middle-
income earners. Budget is in deficit.
23-Dec-08 Brazil 5.00 Program established in 2007 to continue to 2010. Tax cuts (exempt capital
goods producers from the industrial and welfare taxes, increase the value of
personal computers exempted from taxes) and rebates. Funded by reducing
the government’s budget surplus.
Source: Congressional Research Service from various news articles and government press releases.
Notes: Currency conversions to U.S. dollars were either already done in the news articles or by CRS using
current exchange rates.
Effects on Emerging Markets
103
The global credit crunch that began in August 2007 has led to a financial crisis in emerging
market countries (see box) that is being viewed as greater in both scope and effect than the East
Asian financial crisis of 1997-98 or the Latin American debt crisis of 2001-2002, although the
impact on individual countries may have been greater in previous crises. Of the emerging market
countries, those in Central and Eastern Europe appear, to date, to be the most impacted by the
financial crisis.
The ability of emerging market countries to borrow from global capital markets has allowed
many countries to experience incredibly high growth rates. For example, the Baltic countries of
Latvia, Estonia, and Lithuania experienced annual economic growth of nearly 10% in recent
years. However, since this economic expansion was predicated on the continued availability of
access to foreign credit, they were highly vulnerable to a financial crisis when credit lines dried
up.
103
Prepared by Martin A. Weiss, Specialist in International Trade and Finance, Foreign Affairs, Defense, and Trade
Division.
The Global Financial Crisis: Analysis and Policy Implications
Congressional Research Service 41
What are Emerging Market Countries?
There is no uniform definition of the term “emerging markets.” Originally conceived in the early 1980s, the term is
used loosely to define a wide range of countries that have undergone rapid economic change over the past two
decades. Broadly speaking, the term is used to distinguish these countries from the long-industrialized countries, on
one hand, and less-developed countries (such as those in Sub-Saharan Africa), on the other. Emerging market
countries are located primarily in Latin America, Central and Eastern Europe, and Asia.
Since 1999, the finance ministers of many of these emerging market countries began meeting with their peers from
the industrialized countries under the aegis of the G-20, an informal forum to discuss policy issues related to global
macroeconomic stability. The members of the G-20 are the European Union and 19 countries: Argentina, Australia,
Brazil, Canada, China, France, Germany, India, Indonesia, Italy, Japan, Mexico, Russia, Saudi Arabia, South Africa, South
Korea, Turkey, the United Kingdom and the United States.
For more information, see “When are Emerging Markets no Longer Emerging?, Knowledge@Wharton, available at
Of all emerging market countries, Central and Eastern Europe appear to be the most vulnerable.
On a wide variety of economic indicators, such as the total amount of debt in the economy, the
size of current account deficits, dependence on foreign investment, and the level of indebtedness
in the domestic banking sector, countries such as Hungary, Ukraine, Bulgaria, Kazakhstan,
Kyrgyzstan, Latvia, Estonia, and Lithuania, rank among the highest of all emerging markets.
Throughout the region, the average current account deficit increased from 2% of GDP in 2000 to
9% in 2008. In some countries, however, the current account deficit is much higher. Latvia’s
estimated 2008 current account deficit is 22.9% of GDP and Bulgaria’s is 21.4%.
104
The average
deficit for the region was greater than 6% in 2008 (Figure 5).
104
Mark Scott, “Economic Problems Threaten Central and Eastern Europe,” BusinessWeek, October 17, 2008.
The Global Financial Crisis: Analysis and Policy Implications
Congressional Research Service 42
Figure 5. Current Account Balances (as a percentage of GDP)
Source: International Monetary Fund
Due to the impact of the financial crisis, several Central and Eastern European countries have
already sought emergency lending from the IMF to help finance their balance of payments. On
October 24, the IMF announced an initial agreement on a $2.1 billion two-year loan with Iceland
(approved on November 19). On October 26, the IMF announced a $16.5 billion agreement with
Ukraine. On October 28, the IMF announced a $15.7 billion package for Hungary. On November
3, a staff-level agreement on an IMF loan was reached with Kyrgyzstan,
105
and on November 24,
the IMF approved a $7.6 billion stand-by arrangement for Pakistan to support the country’s
economic stabilization.
106
The quickness with which the crisis has impacted emerging market economies has taken many
analysts by surprise. Since the Asian financial crisis, many Asian emerging market economies
enacted a policy of foreign reserve accumulation as a form of self-insurance in case they once
again faced a “sudden stop” of capital flows and the subsequent financial and balance of
payments crises that result from a rapid tightening of international credit flows.
107
Two additional
factors motivated emerging market reserve accumulation. First, several countries have pursued an
export-led growth strategy targeted at the U.S. and other markets with which they have generated
105
Information on ongoing IMF negotiations is available at .
106
International Monetary Fund, “IMF Executive Board Approves Stand-by Arrangement for Pakistan.” Press Release
No. 08/303, November 24, 2008.
107
Reinhart, Carmen and Calvo, Guillermo (2000): When Capital Inflows Come to a Sudden Stop: Consequences and
Policy Options. Published in: in Peter Kenen and Alexandre Swoboda, eds. Reforming the International Monetary and
Financial System (Washington DC: International Monetary Fund, 2000) (2000): pp. 175-201.