This is the first version of this article to be made available publicly. docx
Bạn đang xem bản rút gọn của tài liệu. Xem và tải ngay bản đầy đủ của tài liệu tại đây (186.59 KB, 10 trang )
Genome Biology 2004, 5:P10
Deposited research article
A new estimate of the proportion unchanged genes in a
microarray experiment
Per Broberg
Address: Biological Sciences, AstraZeneca R&D Lund, S-221 87 Lund, Sweden. E-mail:
comment
reviews
reports
deposited research
interactions
information
refereed research
.deposited research
AS A SERVICE TO THE RESEARCH COMMUNITY, GENOME BIOLOGY PROVIDES A 'PREPRINT' DEPOSITORY
TO WHICH ANY ORIGINAL RESEARCH CAN BE SUBMITTED AND WHICH ALL INDIVIDUALS CAN ACCESS
FREE OF CHARGE. ANY ARTICLE CAN BE SUBMITTED BY AUTHORS, WHO HAVE SOLE RESPONSIBILITY FOR
THE ARTICLE'S CONTENT. THE ONLY SCREENING IS TO ENSURE RELEVANCE OF THE PREPRINT TO
GENOME BIOLOGY'S SCOPE AND TO AVOID ABUSIVE, LIBELLOUS OR INDECENT ARTICLES. ARTICLES IN THIS SECTION OF
THE JOURNAL HAVE NOT BEEN PEER-REVIEWED. EACH PREPRINT HAS A PERMANENT URL, BY WHICH IT CAN BE CITED.
RESEARCH SUBMITTED TO THE PREPRINT DEPOSITORY MAY BE SIMULTANEOUSLY OR SUBSEQUENTLY SUBMITTED TO
GENOME BIOLOGY OR ANY OTHER PUBLICATION FOR PEER REVIEW; THE ONLY REQUIREMENT IS AN EXPLICIT CITATION
OF, AND LINK TO, THE PREPRINT IN ANY VERSION OF THE ARTICLE THAT IS EVENTUALLY PUBLISHED. IF POSSIBLE, GENOME
BIOLOGY WILL PROVIDE A RECIPROCAL LINK FROM THE PREPRINT TO THE PUBLISHED ARTICLE.
Posted: 1 April 2004
Genome Biology 2004, 5:P10
The electronic version of this article is the complete one and can be
found online at />© 2004 BioMed Central Ltd
Received: 30 March 2004
This is the first version of this article to be made available publicly.
This information has not been peer-reviewed. Responsibility for the findings rests solely with the author(s).
A new estimate of the proportion unchanged genes in a microarray
experiment
Per Broberg
Biological Sciences, AstraZeneca R&D Lund, S-221 87 Lund, Sweden
Correspondence:
Telephone: + 46 46 33 78 22
Fax: +46 46 33 71 64
Running heading : A new estimate of the proportion unchanged genes
Abstract
Background
In the analysis of microarray data one generally produces a vector of p-values that
for each gene give the likelihood of obtaining equally strong evidence of change by
pure chance. The distribution of these p-values is a mixture of two components
corresponding to the changed genes and the unchanged ones. The basic question
‘What proportion of genes is changed’ is a non-trivial one, with implications for the
way that such experiments are analysed. An estimate not requiring any assumptions
on the distributions is proposed and evaluated. The approach relies on the concept
of a moment generating function.
Results
A simulation model of real microarray data was used to assess the proposed method.
The method fared very well, and gave evidence of low bias and very low variance.
Conclusions
The approach opens up a new possibility of sharpening the inference concerning
microarray experiments, including more stable estimates of the false discovery rate.
Background
The microarray technology permits the simultaneous measurement of the
transcription of thousands of genes. The analysis of such data has however turned
out to be quite a challenge. In drug discovery one would like to know what genes are
involved in certain pathological processes, or what genes are affected by the
intervention of a particular compound. A more basic question is ‘How many genes
are affected or changed?’ It turns out that the answer to this basic question has a
bearing on the other ones.
In the two-component model for the distribution of the test statistic the mixing
parameter p
0
, which represents the proportion unchanged genes, is not estimable
without strong distributional assumptions, see Efron et al. [1]. In this model the
probability density function (pdf) f
t
of a test statistic t may be written as the weighted
sum of the null distribution pdf f
0
t
and the alternative distribution pdf f
1
t
() () ( ) ()
xfpxfpxf
tt
t
1000
1−+×= .
If, on the other hand, we know the value of p
0
we can estimate f
0
t
through a bootstrap
procedure Efron et al. [1], and thus obtain also f
1
t
.
This mixing parameter has attracted a lot of interest lately. Indeed it is interesting for
a number of applications.
1) Knowing the proportion changed genes in a microarray experiment is of interest in
its own right. It gives an important summary measure of the amount of changes
studied.
2) The use of the False Discovery Rate (FDR) in the inference has increased, and
that quantity may be estimated as
()
()
()
αα
pPpDRF
L
/
ˆ
ˆ
0
×=
, where ‘^’ above a quantity means it is a parameter estimate, P
(L)
is the largest p-
value not exceeding
α
and p(
α
) is the proportion significant (the proportion of p-
values less than
α
), see also Storey (2001) [2].
A very similar concept is that of the qvalue, which according to Storey and Tibshirani
(2003) [3] represents the expected proportion of false positives.
3) Knowing p
0
we may calculate the posterior probability of a gene being changed
()
()
()
xf
xf
pxp
t
t
0
01
1−=
see Efron et al. [1].
4) In the samroc methodology Broberg (2003) [4] one calculates estimates of the
false positive and false negative rates as
α
0
ˆ
ˆ
pPF =
and
()()
αα
ppNF −−−= 1
ˆ
1
ˆ
0
where α is the significance level and p(
α
) is the proportion of genes judged
significant.
Furthermore, the criterion
22
FNFPC +=
is minimised by choosing an optimal pair of values of the tuning parameter S
0
in the
SAM statistic Tusher et al. (2001) [5] and the significance level α. The statistic is
defined by
SS
diff
d
+
=
0
where diff is an effect estimate, e.g. a group mean difference, and S is a standard
error.
Earlier research providing estimates of p
0
include Efron et al (2001) [1], Tusher et al
(2001) [5], Storey (2001) [2], Allison et al (2002) [6], Storey and Tibshirani (2003) [3]
and Pounds and Morris (2003) [7].
Methods
Denote the pdf of p-values by f, the proportion unchanged by p
0
and the distribution
of the p-values corresponding the changed genes by f
1
. Then the distribution of p-
values may be written as
() ( ) ()
xfppxf
100
11 −+×=
using the fact that p-values for the unchanged genes follow a uniform distribution.
The present approach is based on the moment generating function (mgf), which is a
transform of a random distribution, which yields a function R characteristic of the
distribution, cf. Fourier or Laplace transforms, e.g. Feller (1971) [8]. In fact the mgf is
a Laplace transform. Knowing the transform means knowing the distribution. It is
defined as the expectation (or the true mean) of the antilog transform of s times a
random variable X, i.e. the expectation of e
sX
or in mathematical notation:
() ()
∫
= dxxfesR
sx
.
Transforming the above theoretical distribution yields the weighted sum of two
transformed distributions:
() () ()
∫
−+
−
= dxxfep
s
e
psR
sx
s
100
1
1
Denoting the first transform by g(s) and the second by R
1
(s) we finally have
() () ( ) ()
sRpsgpsR
100
1 −+= .
Now, the idea is to estimate these mgf’s and to solve for p
0
. In the above equation
R(s) and g(s) can be estimated based on an observed vector of p-values and
calculated exactly, respectively, while p
0
and R
1
(s) cannot be estimated
independently. The estimable transform is, given the observed p-values p = p
1
,…,p
n
,
estimated by
()
∑
=
=
n
i
sp
p
n
e
sR
i
1
ˆ
.
(From now on drop the index p.)
Instead of a straightforward mean as above, a smoothed estimate of the density will
be tried elsewhere.
However, one can solve the above relation for p
0
for any value of s.
() ()
() ()
sRsg
sRsR
p
1
1
0
−
−
=
(1)
Let us do so for s
n
> s
n-1
, equate the two ratios defined by the right hand side in (1)
and solve for R
1
(s
n
). This gives the recursion
()
()()()() ()()()()
()()
11
1111
1
−−
−−−
−
−+−
=
nn
nnnnnnn
n
sRsg
sRsgsRsgsRsgsR
sR
(2)
If we can find a suitable start for this recursion we should be in a position to
approximate the increasing function R
1
(s) for s = s
1
< s
2
< … < s
m
in (0, 1]. Now, note
that 1 ≤ R(s), for any mgf, with close to equality for small values of s. Thus it makes
sense to start the recursion with R
1
(s
1
) = (1 + R(s
1
))/2. (In general, it will hold true
that 1 < R
1
(s
n
) < R(s
n
) < g(s
n
), since f
1
puts weight to the lower range of the p-values
at the expense of the higher range, the uniform puts equal weight, and f being a
mixture lies somewhere in between.) We calculate g, R and R
1
for a series of values
s in (0,1], e.g. for s in (0.01, 0.0101, 0.0102, …, 1). The output from one data set
appears in Figure 1. From (1) we obtain a series of estimates of p
0
, and may take the
mean as the final estimate.
Results
A simulation of data for 3000 genes was repeated 200 times for true p
0
values
ranging from 0.6 to 0.95 using the R script from Broberg (2003) [4]. The current
method p0.mgf was compared to the estimate presented in Storey and Tibshirani
(2003), denoted qva, and to the bootstrap method from Storey (2002), implemented
in the R package SAG [9, 10, 11]. These methods are both based on a comparison
of the empirical p-value distribution to that of the uniform. There will likely be fewer p-
values close to 1 in the empirical than in the null distribution, which is a uniform. The
observed proportion of p-values exceeding some threshold value
η
over the
expected proportion under the null hypothesis, 1 -
η
, will estimate p
0.
In fact, the ratio
{1-F
e
(
η
)}/{1-
η
}, F
e
denoting the empirical distribution, will often be a good estimate of
p
0
for an astutely chosen threshold
η
.
With the simulated data all methods perform rather well, see Table 1 and Figure 2.
Choosing a statistical method generally involves a trade-off between bias and
variation. The proposed method misses its target by on an average 1.6%
(underestimates p
0
) , which is not as good as Storey’s bootstrap method but better
than qvalue, but it provides estimates with close to half the mean squared error of the
alternatives. So if robustness is an issue then p0.mgf seems like a good choice.
Minor perturbations of the data will not affect the result.
Discussion
In Broberg (2002) [12] an attempt was made to use the mgf for finding differentially
expressed genes, with varying results. The main problem there lay in the few
replicates. In the current application there is ample data to accurately capture the
mgf, providing the p-values were obtained in a reliable fashion, e.g. by a warranted
normal approximation, a bootstrap or a permutation method. Pounds and Morris [7]
mention a case when a two-way ANOVA F-distribution was used and the
distributional assumptions were not met. The estimate of p
0
gave an unrealistic
answer. When permutation p-values were used instead their method gave a more
realistic result. Similar caveats apply to any method based on p-values.
The current method may be used to provide a good starting point for a method like
the EM algorithm. That algorithm is crucially dependent on a good start of the
iteration. Such a combined algorithm remains to be explored. Another twist would be
to take the estimate of R
1
, fit a spline curve, predict the value of R
1
(0), which ought to
be unity. Then, based on the difference R
1
(0) – 1, adjust the value of R
1
(s
1
) and
reiterate (2). This will be tested elsewhere.
A further development would be to use the current approach directly on the test
statistic, e.g. a t-test statistic, and to obtain p-values by modelling the null distribution
instead of the common bootstrap approach. This has been tried in another context
[13] and seems very encouraging.
The method is implemented in R and will appear in the package SAG v 1.2 [11].
References
1. Efron B, Tibshirani R, Storey JD, Tusher VG: Empirical Bayes analysis of a microarray
experiment. Journal of the American Statistical Association 2001, 96: 1151-1160
2. Storey JD: (2001) A Direct Approach to False Discovery Rates J Roy Stat Soc B, 64, 479-498
3. Storey JD and Tibshirani R : Statistical significance for genomewide studies: Proc. Natl. Acad.
Sci.USA 2003, 100: 9440-9445
4. Broberg. P: Statistical methods for ranking differentially expressed genes. Genome Biology
2003, 4:R41
[ /> ]
5. Tusher V.G., Tibshirani R., Chu G: Significance analysis of microarrays applied to the ionizing
radiation response. Proc. Natl. Acad. Sci.USA 2001, 98: 5116-5121
6. Allison DB, Gadbury GL, Moonseong H, Fernandez JR, Cheol-Koo L, Prolla TA and Weindruch RA: A
mixture model approach for the analysis of microarray gene expression data. Computational
Statistics and Data Analysis 2002, 39, 1-20
7. Pounds S and Morris SW: Estimating the occurrence of false positives and false negatives in
microarray studies by approximating and partitioning the empirical distribution of p-values.
Bioinformatics 2003, Vol 19, 10, 1236-1242
8. Feller W: An Introduction to Probability Theory and Its Applications, Volume 2. Second Edition. New
York: Wiley, 1971
9. The R project
[www.cran.r-project.org
]
10. Ihaka R, Gentleman R: (1996) R: A language for data analysis and graphics.
Journal of Computational and Graphical Statistics 1996, 5: 299-314
11. The SAG homepage
[
12. Broberg P: (2002) Ranking genes with respect to differential expression. Genome Biology,
3:preprint0007.1-0007.23
13. Efron B: (2003) Large-Scale Simultaneous Hypothesis Testing: the choice of a null
hypothesis. Report Stanford [
Figures
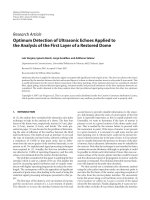
0.00.20.40.60.81.0
1.0 1.1 1.2 1.3 1.4 1.5 1.6 1.7
s
Value of moment generating function
g(s)
R(s)
R1(s)
Figure 1. Estimated moment generating functions (mgf’s). Given an observed vector
of p-values it is possible to calculate mgf’s for the observed distribution f (R) and the
unobserved distribution f
1
(R
1
), and without any observations we can calculate the
mgf for the uniform (g).
0.6 0.7 0.8 0.9 0.95 0.99
0.5 0.7 0.9
qva
Expected proportion unchanged
Estimate
0.6 0.7 0.8 0.9 0.95 0.99
0.5 0.7 0.9
store y
Expected proportion unchanged
Estimate
0.6 0.7 0.8 0.9 0.95 0.99
0.5 0.7 0.9
p0.mgf
Expected proportion unchanged
Estimate
Figure 2. Boxplots of the simulation results. A simulation model of real-life microarray
data was used to give data where the expected proportion of changed genes was set
at 60, 70, 80, 90, 95 or 99%. The proposed method, denoted p0.mgf gave low bias
and low variance over the whole range.
Tables
qva storey p0.mgf
mean
-0.024 -0.0078 0.016
Sd
0.044 0.045 0.024
Table 1. Over-all results of simulations. The summary statistics of the difference
between target value and its estimate show a rather good performance for all
methods, with p0.mgf having the second smallest bias and the smallest variation.