Tài liệu Báo cáo khoa học: Down-regulation of heme oxygenase-2 is associated with the increased expression of heme oxygenase-1 in human cell lines docx
Bạn đang xem bản rút gọn của tài liệu. Xem và tải ngay bản đầy đủ của tài liệu tại đây (984.04 KB, 14 trang )
Down-regulation of heme oxygenase-2 is associated with
the increased expression of heme oxygenase-1 in human
cell lines
Yuanying Ding
1
, Yong Z. Zhang
1
, Kazumichi Furuyama
1
, Kazuhiro Ogawa
2
*, Kazuhiko Igarashi
3
and Shigeki Shibahara
1
1 Department of Molecular Biology and Applied Physiology, Tohoku University School of Medicine, Sendai, Japan
2 Department of Molecular Pharmacology, Tohoku University School of Medicine, Sendai, Japan
3 Department of Biochemistry, Tohoku University Graduate School of Medicine, Sendai, Japan
Heme is an invaluable molecule that is essential for life
and is involved in many cellular processes that sense
or use oxygen. The intracellular concentration of heme
is maintained by the rate of its synthesis and degrada-
tion [1]. Many enzymes and their regulators are
responsible for heme synthesis [1,2]. On the other
hand, heme degradation is mediated by two structur-
ally related isozymes, HO-1 and HO-2, to generate
biliverdin IXa, carbon monoxide (CO), and ferrous
iron [3]. Biliverdin IXa is immediately reduced to bili-
rubin IXa. HO-1 has attracted particular attention,
because its expression is induced by its substrate,
heme, in animals [4,5] and in primary cultures of
macrophages [6–9]. It has therefore provided a good
example of substrate-mediated induction of an enzyme
in mammals [10,11].
Keywords
cancer cell lines; heme homeostasis; heme
oxygenase; isozymes; short interfering RNA
Correspondence
S. Shibahara, Department of Molecular
Biology and Applied Physiology, Tohoku
University School of Medicine, 2-1 Seiryo-
machi, Aoba-ku, Sendai, Miyagi 980-8575,
Japan
Fax: +81 22 717 8118
Tel: +81 22 717 8117
E-mail:
*Present address
Department of Molecular Pharmacology,
Kanazawa University Graduate School of
Medical Science, 13-1 Takara-machi,
Kanazawa 920-8640, Japan
(Received 28 July 2006, revised 3 October
2006, accepted 4 October 2006)
doi:10.1111/j.1742-4658.2006.05526.x
Intracellular heme concentrations are maintained in part by heme degrada-
tion, which is catalyzed by heme oxygenase. Heme oxygenase consists of
two structurally related isozymes, HO-1 and HO-2. Recent studies have
identified HO-2 as a potential oxygen sensor. To gain further insights into
the regulatory role of HO-2 in heme homeostasis, we analyzed the expres-
sion profiles of HO-2 and the biochemical consequences of HO-2 knock-
down with specific short interfering RNA (siRNA) in human cells. Both
HO-2 mRNA and protein are expressed in the eight human cancer cell
lines examined, and HO-1 expression is detectable in five of the cell lines,
including HeLa cervical cancer and HepG2 hepatoma. Down-regulation of
HO-2 expression with siRNA against HO-2 (siHO-2) caused induction of
HO-1 expression at both mRNA and protein levels in HeLa and HepG2
cells. In contrast, knockdown of HO-1 expression did not noticeably influ-
ence HO-2 expression. HO-2 knockdown prolonged the half-life of HO-1
mRNA twofold in HeLa cells. Transient transfection assays in HeLa cells
revealed that the 4.5-kb human HO-1 gene promoter was activated with
selective knockdown of HO-2 in a sequence-dependent manner. Moreover,
HO-2 knockdown caused heme accumulation in HeLa and HepG2 cells
only when exposed to exogenous hemin. HO-2 knockdown may mimic a
certain physiological change that is important in the maintenance of cellu-
lar heme homeostasis. These results suggest that HO-2 may down-regulate
the expression of HO-1, thereby directing the co-ordinated expression of
HO-1 and HO-2.
Abbreviations
GAPDH, glyceraldehyde-3-phosphate dehydrogenase; HO, heme oxygenase; MARE, Maf recognition element; SA, succinylacetone; SnPP,
Sn-protoporphyrin.
FEBS Journal 273 (2006) 5333–5346 ª 2006 The Authors Journal compilation ª 2006 FEBS 5333
On the other hand, it has been reported that expres-
sion of HO-1 is decreased in several types of human
cell under various conditions, such as hypoxia [12,13]
and treatment with interferon-c [14,15] or desferriox-
amine, an iron chelator [12]. Likewise, the expression
of HO-2 is decreased in the placental tissues of abnor-
mal pregnancies [16,17] and in cultured human tropho-
blast cells [18]. We have recently shown that the
expression levels of HO-1 and HO-2 are decreased in
several human cell lines under hypoxia [19]. In mice,
expression of HO-1 and HO-2 proteins is decreased in
decidua and placenta during Th1-mediated abortion
[20]. Moreover, expression of HO-1 and HO-2 proteins
is transiently decreased in the liver, but increased in
the heart during acclimatization of mice to normobaric
hypoxia [21]. These results suggest that expression of
HO-1 and HO-2 is regulated in a complex manner to
maintain intracellular heme concentrations or the
availability of free heme for various hemoproteins.
Free heme is defined as either heme that is newly syn-
thesized but not yet bound to hemoproteins or heme
that has been released from hemoproteins [22].
HO-2 contains the cysteine and proline (CP) motifs
[23], whereas HO-1 lacks a cysteine residue [24,25].
Each CP motif of HO-2 may function as a heme-bind-
ing site [26], suggesting that HO-2 may sequester heme
to maintain the intracellular heme concentrations or
ameliorate heme-mediated oxidative stress. Moreover,
unlike the severe phenotypes of HO-1-deficient mice
(HO-1
– ⁄ –
), including prenatal lethality [27], HO-2
– ⁄ –
mice are fertile and survive for at least 1 year under
basal conditions [28], but show ejaculatory abnormalit-
ies [29] and high susceptibility to oxygen toxicity [30].
Recent studies of our group [31] and other investiga-
tors [32] have shown that HO-2 functions as a poten-
tial oxygen sensor.
In the present study, we show that HO-2 knock-
down is associated with the induction of HO-1 expres-
sion in human cancer cell lines. HO-2 knockdown may
mimic a certain physiological change that is important
in the maintenance of cellular heme homeostasis. We
provide evidence that HO-2 may modulate the expres-
sion level of HO-1 by affecting HO-1 mRNA stability
and intracellular heme concentration.
Results
Expression profiles of HO-1 and HO-2 in various
human cell types
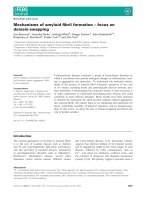
We initially analyzed the expression profiles of HO-1
and HO-2 in eight human cell lines by northern and
western blot analyses (Fig. 1A,B). Expression of HO-1
mRNA was detected in five of these cell lines, but
hardly at all in the other three (K562 erythroleukemia,
Jurkat T cell, and H146 small cell lung cancer), in
which HO-1 protein was also undetectable. In contrast,
HO-2 mRNA and protein were both expressed in all
eight cell lines (Fig. 1A,B). We also measured the heme
content of these cell lines: it was about twofold higher
in YN-1 and K562 erythroleukemia cells than in the
other cell types (Fig. 1C). Higher heme content may
reflect hemoglobin production in YN-1 and K562 cells
[33,34]. In fact, the population of hemoglobin-positive
cells was about 4.4% in YN-1 cells and 4.9% in K562
cells under basal conditions [19]. Otherwise, there was
A
B
C
Fig. 1. Expression profiles of HO-1 and HO-2 in various human cell
lines. (A) Total RNA and proteins were prepared from the indicated
cell lines and subjected to northern blot analysis and (B) western
blot analysis. (A) Northern blot analysis. Each lane contains 15 lg
total RNA. The bottom panel shows the expression of 18S rRNA as
an internal control. Note that the blot was exposed to the film for
the longest time (1 min) to detect the low expression levels of
HO-1 in some cell lines. (B) Western blot analysis. Each lane
contains 20 lg protein. The same filter was reused for b-actin
expression as an internal control. (C) Cellular heme contents. Cells
were cultured for 48 h, and harvested for the measurement of
heme content (ng ⁄ 10
6
cells).
Heme oxygenase-2 down-regulates heme oxygenase-1 Y. Ding et al.
5334 FEBS Journal 273 (2006) 5333–5346 ª 2006 The Authors Journal compilation ª 2006 FEBS
no apparent correlation between the expression levels
of HO-1 and HO-2 and cellular heme content. The cel-
lular heme content represents the sum of free heme
and bound heme of various hemoproteins.
Role of heme metabolism in cellular heme
content
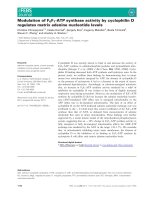
To evaluate the contribution of heme synthesis and
degradation to cellular heme content, we treated
YN-1 erythroleukemia, HeLa cervical cancer, and
HepG2 hepatoma cells for 48 h with succinylacetone
(SA) or Sn-protoporphyrin (SnPP) (Fig. 2). These dis-
tinctive cell lines were chosen because both HO-1 and
HO-2 are expressed at detectable concentrations
(Fig. 1) [19]. SA is a specific inhibitor of d-aminolevu-
linic acid dehydratase, the second enzyme of the heme
biosynthetic pathway. SnPP is a competitive inhibitor
of HO activity [35]. The heme content of all three cell
lines was significantly decreased after treatment with
SA, but increased after treatment with SnPP
(Fig. 2A,B). Thus, an appropriate balance between
heme synthesis and heme degradation is responsible
for maintenance of cellular heme contents. More
importantly, these results indicate that measurement
of heme content is useful for evaluation of heme
dynamics in cultured cells.
Regulatory role of free heme in expression
of HO-1
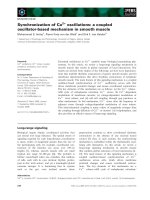
To explore the role of free heme in HO-1 and HO-2
expression, we treated HeLa and HepG2 cells with
SA and determined the expression levels of HO-1 and
HO-2 (Fig. 3). HO-1 mRNA expression was signifi-
cantly reduced in HeLa and HepG2 cells after treat-
ment with SA for 6 h, whereas HO-2 mRNA
expression was not noticeably changed by SA treat-
ment (Fig. 3A,C). Western blot analysis revealed that
treatment with SA reduced the expression of HO-1
protein in HeLa and HepG2 cells, but did not change
the HO-2 protein concentration (Fig. 3B,D). These
results suggest that a certain threshold concentration
of free heme may determine the basal expression levels
of HO-1.
Effects of HO-1 or HO-2 short interfering RNA
(siRNA) on the expression of HO-1
To explore the functional significance of HO-1 and
HO-2, we selectively reduced the expression of HO-1
or HO-2 mRNA with each siRNA. HeLa and HepG2
cells were transfected with siRNA targeted to HO-1,
HO-2 or glyceraldehyde-3-phosphate dehydrogenase
(GAPDH), and total RNA was extracted from cells
after 24 h incubation and subjected to northern blot
analysis (Fig. 4A,C). HO-1 siRNA decreased HO-1
mRNA expression levels by 60%, but exerted no
noticeable effects on HO-2 and GAPDH mRNA con-
centrations in HeLa cells (Fig. 4A). Likewise, HO-2
siRNA and GAPDH siRNA specifically decreased the
expression of HO-2 mRNA and GAPDH mRNA by
more than 90%, respectively. Unexpectedly, treatment
of HeLa cells with HO-2 siRNA induced the expres-
sion of HO-1 mRNA and protein without affecting
the concentration of GAPDH mRNA and b-actin
(Fig. 4A,B). Likewise, the selective reduction of HO-2
mRNA with HO-2 siRNA induced the expression of
HO-1 mRNA and protein in HepG2 cells, but did not
change the concentrations of GAPDH mRNA and
b-actin (Fig. 4C,D). Consistent with HO-1 mRNA
expression, expression of HO-1 protein was also
induced by the treatment with HO-2 siRNA in HepG2
cells. These results indicate that the down-regulation of
HO-2 expression is associated with induction of HO-1
expression.
Fig. 2. Effects of SA and SnPP on cellular heme content in human
cell lines. YN-1 erythroleukemia, HeLa cervical cancer, and HepG2
hepatoma cells were treated with 5 m
M SA (A) or 50 lM SnPP (B)
for 48 h, and the cellular heme contents were measured. Heme
contents are shown as ng ⁄ 10
6
cells. The data are mean ± SEM
from three independent experiments. *P < 0.05, **P<0.01.
Y. Ding et al. Heme oxygenase-2 down-regulates heme oxygenase-1
FEBS Journal 273 (2006) 5333–5346 ª 2006 The Authors Journal compilation ª 2006 FEBS 5335
We then confirmed the effects of HO-2 knockdown
using another HO-2 siRNA with a different sequence
(HO-2 siRNA1) [32] and a scrambled HO-2 siRNA
(siHO-2-R) in HeLa and HepG2 cells (Fig. 5). HO-2
siRNA1 efficiently decreased the expression of HO-2
mRNA and protein and induced the expression of
HO-1 mRNA and protein. In contrast, the scrambled
HO-2 siRNA did not affect the expression of HO-1
and HO-2 mRNAs and proteins in HeLa and HepG2
cells (Fig. 5). Thus, the induction of HO-1 is due to
the selective repression of HO-2 expression achieved
with HO-2 siRNA.
Knockdown of HO-2 expression causes
time-dependent induction of HO-1 mRNA
expression
We then performed a time course study to confirm the
effects of HO-2 siRNA on the expression of HO-1
mRNA in HeLa cells (Fig. 6A). HO-2 siRNA efficiently
reduced the expression of HO-2 mRNA at 6 h, which
was further decreased at 12 h. In contrast, expression of
HO-1 mRNA was time-dependently increased, reaching
a maximum at 24 h (Fig. 6A,B). HO-2 siRNA had not
noticeably changed the concentrations of GAPDH
A
B
C
D
Fig. 3. Effects of SA on HO-1 and HO-2 expression levels in human cell lines. HeLa cells (A and B) and HepG2 cells (C and D) were left
untreated or treated with SA (5 m
M) for the indicated time and harvested. The upper panels in (A) and (C) show the northern blot analysis of
HO-1 and HO-2 mRNA in HeLa (A) and HepG2 cells (C). Each lane contains 15 lg total RNA. The expression of 18S rRNA is also shown as
an internal control. The data presented are from one of three independent experiments. The lower panels in (A) and (C) show relative
expression levels of HO-1 and HO-2 mRNA. The intensity of the signals representing HO-1 or HO-2 mRNA was normalized with respect to
the intensity of the 18S rRNA signal. The ratio of each normalized value to the control value in untreated cells at 6 h is shown as the relative
expression level of HO-1 or HO-2 mRNA. Asterisks represent significant differences compared with the control at 6 h (*P<0.05,
**P<0.01). (B and D) Western blot analysis of HO-1 and HO-2 proteins in HeLa (B) and HepG2 cells (D). Each lane contains 10 lg protein.
The relative expression levels are shown in the lower panels. To normalize the expression levels, the same filter was reused for b-actin
monoclonal antibody. The intensity representing HO-1 or HO-2 protein was normalized with respect to the intensity for the b-actin signal.
The data are mean ± SEM from three independent experiments. *P < 0.05.
Heme oxygenase-2 down-regulates heme oxygenase-1 Y. Ding et al.
5336 FEBS Journal 273 (2006) 5333–5346 ª 2006 The Authors Journal compilation ª 2006 FEBS
mRNA by 24 h. It should be noted that HO-2 siRNA
causes late-onset induction of HO-1 mRNA. In this con-
text, we have reported that maximum induction of HO-1
mRNA expression was detected within 3 h by treatment
with cadmium in HeLa cells, which is due to increased
transcription of the HO-1 gene [36]. Thus, HO-2
AC
D
B
Fig. 4. Knockdown of HO-1 or HO-2 expression by each siRNA in HeLa and HepG2 cells. HeLa cells (A and B) and HepG2 cells (C and D)
were treated for 24 h with siHO-1, siHO-2 or siGAPDH as described in Experimental procedures. Cells treated with Lipofectamine 2000
transfection reagent alone were included as a control. siGAPDH was also used as a control for transfection with siRNA. Other methods are
same as in Fig. 3. (A and C) Northern blot analysis of HO-1, HO-2 and GAPDH mRNAs. The intensity of the signals representing HO-1 or
HO-2 mRNA was normalized with respect to the intensity of the 18S rRNA signal. The ratio of each normalized value to the value in
untreated cells is shown as the relative expression level of HO-1 or HO-2 mRNA (**P<0.01). (B and D) Western blot analysis of HO-1 and
HO-2 proteins. The intensity representing HO-1 or HO-2 protein was normalized with respect to the intensity of the b-actin signal. The ratio
of each normalized value to the control value in siRNA-untreated cells (control) is shown as the relative expression level of HO-1 or HO-2
protein (*P < 0.05, **P<0.01). The data are mean ± SEM from three independent experiments.
Y. Ding et al. Heme oxygenase-2 down-regulates heme oxygenase-1
FEBS Journal 273 (2006) 5333–5346 ª 2006 The Authors Journal compilation ª 2006 FEBS 5337
knockdown may evoke a certain metabolic change,
which in turn induces HO-1 mRNA expression.
HO-2 knockdown increases stability of HO-1
mRNA
Consequently, we analyzed the stability of HO-1
mRNA in HeLa cells treated with HO-2 siRNA. In
this series of experiments, HeLa cells were left untrans-
fected or transfected with the indicated siRNA, and
cultured for 12 h before addition of actinomycin D.
The half-life of HO-1 mRNA was about 3 h in
untransfected and siGAPDH-treated HeLa cells
(Fig. 7A,B), which is in good agreement with the half-
life of HO-1 mRNA determined in HeLa cells [37].
Interestingly, the half-life of HO-1 mRNA was pro-
longed to about 7 h in HeLa cells transfected with
siHO-2. Thus, the induction of HO-1 mRNA with
HO-2 knockdown may be in part due to the increased
stability of HO-1 mRNA.
Effects of HO-2 knockdown on HO-1 and HO-2
promoter activities
To assess the biochemical consequences of HO-2
knockdown, we analyzed whether HO-2 siRNA affects
the promoter activity of the human HO-1 gene, using
reporter constructs (Fig. 8). The 4.5-kb promoter
region of the HO-1 gene, carried by phHOLUC45, has
been shown to be responsive to cadmium [36] and
sodium nitroprusside [38], but unresponsive to hemin
[9,36]. We also included model constructs of pRBGP2
and pRBGP4, containing three copies of the Maf
recognition element (MARE) and three copies of the
mutated MARE, respectively [39]. Co-transfection with
siHO-2 significantly increased the promoter activity of
phHOLUC45, which contains the MARE, but showed
no effect on the promoter activity of phHOLUC40,
lacking the MARE, the HO-2 gene promoter of
phHO2()1494) and phHO2() 663), or a control pro-
moter of pGL3-Basic. Likewise, transfection with
siHO-2 significantly increased the pRBGP2 promoter
activity but not pRBGP4. Knockdown of HO-1 with
siHO-1 tended to increase the HO-1 promoter activity,
but the degree of activation was not statistically signifi-
cant. Neither siHO-1 nor siGAPDH significantly influ-
enced the promoter activities of the HO-2 gene,
pRBGP2 or pRBGP4. We also analyzed the effects of
hemin treatment on the HO-1 gene promoter activity
(Fig. 8B), showing that hemin significantly increased
the expression of pRBGP2 but not the expression of
phHOLUC45 and pRBGP4. These results suggest that
Fig. 5. Induction of HO-1 mRNA expression with knockdown of HO-2 in HeLa and HepG2 cells. Cells were treated for 24 h with each of
two siRNAs against HO-2 (siHO-2 and HO-2siRNA1), scrambled siHO-2 (scramble) or siGAPDH. Other methods are the same as in Fig. 4.
Expression levels of HO-1, HO-2 and GAPDH mRNAs were determined in HeLa cells (A) and HepG2 cells (C) by northern blot analysis.
HO-1 and HO-2 proteins were determined in HeLa cells (B) and HepG2 cells (D) by western blot analysis. The data are mean ± SEM from
three independent experiments. *P < 0.05, **P < 0.01.
Heme oxygenase-2 down-regulates heme oxygenase-1 Y. Ding et al.
5338 FEBS Journal 273 (2006) 5333–5346 ª 2006 The Authors Journal compilation ª 2006 FEBS
HO-2 knockdown may transactivate the promoter of
phHOLUC45 through a heme-independent mechanism.
Moreover, HO-2 knockdown may cause a metabolic
change similar to that evoked by cadmium [36] or
sodium nitroprusside [38], each of which activated the
expression of a reporter gene under the regulation of
the 4.5-kb HO-1 gene promoter. It should be noted,
however, that heme activates the HO-1 gene promoter
[40], but the relevant cis-acting element is not present
in the 4.5-kb promoter region. It is therefore conceiv-
able that HO-2 knockdown may induce HO-1 expres-
sion through not only the heme-independent
mechanism but also the heme-dependent mechanism.
Heme accumulation caused by knockdown of
HO-1 or HO-2 expression
To explore the biological implication of the knock-
down experiments and to evaluate the relative contri-
bution of HO-1 and HO-2 to the total amount of
heme degradation, we measured the heme content of
HeLa cells and HepG2 cells after transfection with
HO-1 or HO-2 siRNA. There were no significant chan-
ges in heme content in HeLa cells (Fig. 9A) and
HepG2 cells (Fig. 9B), which were transfected with
each HO siRNA. Thus, heme content may be main-
tained by a compensatory mechanism, or the changes
in heme content may be below the detectable limit of
the assay method used. Accordingly, we treated HeLa
and HepG2 cells for 12 h with 1 lm hemin, a subopti-
mal concentration for the induction of HO-1 mRNA,
and then measured cellular heme content. It should be
noted that hemin at this concentration does not notice-
ably induce HO-1 expression in HeLa and HepG2 cells
(data not shown). In HeLa cells that were left untrans-
fected (control) or transfected with siGAPDH or
siHO-1, the heme content was twofold higher after
treatment with hemin (Fig. 9A), whereas the heme
content remained unchanged in HepG2 cells treated
with hemin (Fig. 9B). Thus, heme may be more effi-
ciently incorporated into HeLa cells than HepG2 cells
or the incorporated heme may exceed the capacity of
heme degradation mediated by HO-1 and HO-2 in
HeLa cells. In fact, HO activity was detected in
A
BC
Fig. 6. Time-dependent induction of HO-1 mRNA expression with HO-2 knockdown. (A) Northern blot analysis. HeLa cells were cultured for
the indicated time (0, 6, 12, 24 and 48 h) after transfection with HO-2 or GAPDH siRNA. Total RNA was extracted and subjected to northern
blot analysis. Each lane contains 10 lg total RNA. Relative expression levels of HO-1 (B) and HO-2 (C) mRNAs are shown. The intensity rep-
resenting HO-1 or HO-2 mRNA was normalized with respect to the intensity of 18 S rRNA. The ratio of each normalized value to the control
value at 0 time (0 h) is shown as the relative expression level of HO-1 or HO-2 mRNA. The data are mean ± SEM from three independent
experiments. *P < 0.05, **P < 0.01.
Y. Ding et al. Heme oxygenase-2 down-regulates heme oxygenase-1
FEBS Journal 273 (2006) 5333–5346 ª 2006 The Authors Journal compilation ª 2006 FEBS 5339
HepG2 cells, but not in HeLa cells [19]. Moreover,
heme content was further increased twofold in hemin-
treated HeLa cells transfected with siHO-2 (Fig. 9A),
even though HO-2 knockdown with siHO-2 induced
HO-1 expression (see Figs 4 and 6). On the other
hand, knockdown of either HO-1 or HO-2 expression
resulted in the accumulation of heme in the hemin-
treated HepG2 cells. Taken together with the siHO-2-
mediated induction of HO-1 expression, these results
suggest that HO-2 rather than HO-1 may play the pre-
dominant role in heme degradation in cultured human
cells.
Discussion
We have shown that the selective knockdown of HO-2
expression with each of two different siRNAs is consis-
tently associated with increased expression of HO-1
mRNA and protein. Moreover, we provide evidence
that at least three mechanisms may account for the
siHO-2-mediated induction of HO-1 expression:
increased stability of HO-1 mRNA and heme-depend-
ent and heme-independent transcriptional regulation of
the HO-1 gene. These metabolic consequences of HO-2
knockdown suggest a regulatory role for HO-2 in the
co-ordinated expression of HO-1 and HO-2. We there-
fore propose that HO-2 may modulate the expression
of HO-1.
Incidentally, the three cell lines with low HO-1
expression, K562, Jurkat, and H146, were maintained
in suspension culture (Fig. 1), although HO-1 is
expressed in two other cell lines, YN-1 and KG1, that
were also maintained in suspension culture. These
results suggest that the cellular microenvironment,
such as cell attachment, may influence the expression
of HO-1. The dominant expression of HO-2 protein, in
comparison with the low expression of HO-1 protein,
in H146 small cell lung cancer cells is of particular
interest because small cell lung cancer is derived from
the airway neuroepithelial body [41], which functions
as an oxygen-sensing organ in the lung. The neuroepit-
helial body is responsible for ventilation-perfusion
matching, which may be impaired in HO-2
– ⁄ –
mice
[31].
It is noteworthy that HO-2 knockdown increased
the heme content of the hemin-treated HeLa and
HepG2 cells (Fig. 9A,B), despite the induction of
HO-1 expression (Figs 4 and 6). These results suggest
that the increased HO-1 expression may be insufficient
to compensate for a certain degree of reduction in
HO-2 protein. Taken together with the ubiquitous
expression profile of HO-2 in the cell lines examined
(Fig. 1), we suggest that HO-2 may be a key enzyme
responsible for maintaining cellular heme concen-
trations. In this context, HO-2 contains at least two
copies of the CP motif, which may be bound by heme
but is not present in HO-1 [23,26]. Thus, the down-
regulation of HO-2 may transiently increase the cel-
lular free heme concentration, which in turn increases
the expression of HO-1 mRNA.
The induction of HO-1 expression mediated by
HO-2 knockdown may account for the phenotypic dif-
ferences between HO-1
– ⁄ –
mice and HO-2
– ⁄ –
mice.
Unlike the partial lethality of HO-1
– ⁄ –
[27], HO-2
– ⁄ –
mice are able to survive for at least a year under basal
conditions [28]. These mice can probably compensate
for the loss of HO-2 by increasing the expression of
HO-1, which is supported by the following observa-
tions. First, HO-2
– ⁄ –
mice show no noticeable changes
or only a marginal decrease in arterial carboxyhemo-
globin, a marker of overall heme degradation [27,28].
Secondly, no differences in heme concentration were
A
B
Fig. 7. HO-2 knockdown increases the stability of HO-1 mRNA. (A)
Northern blot analysis. HeLa cells, which were left untransfected
(Control) or transfected with the indicated siRNA, were cultured for
12 h, and then treated with actinomycin D (AMD) (1 lgÆmL
)1
) for
the indicated time (h). Each lane contains 15 lg total RNA. The lane
labeled 0 h contained RNA prepared from cells harvested just
before the addition of AMD (0 h). (B) Relative expression levels of
HO-1 mRNA. The intensity representing HO-1 mRNA was normal-
ized with respect to the intensity of 18S rRNA. The intensity repre-
senting HO-1 mRNA at the time of addition of AMD (0 h) under
each condition was considered to be 1. One representative of two
independent experiments with similar results is shown.
Heme oxygenase-2 down-regulates heme oxygenase-1 Y. Ding et al.
5340 FEBS Journal 273 (2006) 5333–5346 ª 2006 The Authors Journal compilation ª 2006 FEBS
detected in tissue homogenates prepared from multiple
tissues of HO-2
– ⁄ –
mice [42]. Thirdly, HO-1 protein is
indeed over-expressed in the lung [30] and pulmonary
venous myocardium [31] of HO-2
– ⁄ –
mice. Taken
together with our proposal that HO-2 down-regulates
HO-1 expression, these results suggest that heme
homeostasis is maintained in HO-2
– ⁄ –
mice through
appropriate resetting of HO-1 expression. In contrast
with HO-1 expression, expression of HO-2 mRNA and
protein was not increased in several human cell lines
examined [15,19,37]. Such a mode of regulation of
HO-2 expression may account for the severe phenotype
of HO-1
– ⁄ –
mice [27]. In particular, the compensation
achieved by HO-2 is not sufficient in the HO-1-
enriched organs, such as spleen, liver, and bone mar-
row. In fact, HO-1
– ⁄ –
mice suffer from severe anemia
and iron deposits [27]. Likewise, human HO-1 defici-
ency is characterized by hypobilirubinemia, persistent
hemolytic anemia, and iron deposits in the liver [43].
HO-2 knockdown increased the transient expression
of phHOLUC45 through the enhancer region of the
human HO-1 gene, located between )4.5 kb and
)4 kb. The increased expression of phHOLUC45 sug-
gests that the cellular microenvironment generated by
HO-2 knockdown may mimic the metabolic change
evoked by cadmium [36] or sodium nitroprusside [38],
each of which activates the expression of a reporter
gene under the regulation of the 4.5-kb HO-1 gene
promoter. This region contains the cadmium-respon-
sive element [36] and the MARE [44,45], but lacks
the element required for full activation by hemin
[9,36,40]. It is the MARE site that is bound by Nrf2,
a transcription activator, or Bach1, a transcription
repressor, each of which functions as a heterodimer
with a member of the Maf family [46]. Bach1 is a
heme-responsive repressor, and its repression activity
is lost when Bach1 is bound by heme, which in turn
leads to transcriptional activation of the HO-1 gene
A
B
Fig. 8. Knockdown of HO-2 expression increases the HO-1 promoter activity. HeLa cells were transiently transfected with each reporter con-
struct (3 lg), then incubated for 24 h, and either re-transfected with each siRNA (A) or treated with 50 l
M hemin (B), as described in Experi-
mental procedures. After 24 h of incubation, luciferase activity was measured. The test promoters analyzed are shown on the left. Relative
luciferase activity is shown as the ratio to the normalized luciferase activity obtained with pGL3Basic; the normalized luciferase activity used
was that in cells treated with siGAPDH in (A) and that in cells untreated with hemin in (B). The data are mean ± SEM from three independ-
ent experiments. **P < 0.01.
Y. Ding et al. Heme oxygenase-2 down-regulates heme oxygenase-1
FEBS Journal 273 (2006) 5333–5346 ª 2006 The Authors Journal compilation ª 2006 FEBS 5341
through the MARE [45–49]. The increased concentra-
tion of endogenous heme may facilitate the binding
of Nrf2, instead of Bach1, to the MARE to activate
the MARE-dependent promoter, as reported for the
mouse HO-1 gene [47]. However, in contrast with the
mouse HO-1 gene, the human HO-1 gene promoter is
under complex regulation [9,40,50]. In fact, both
knockdown of HO-2 and hemin treatment resulted in
activation of the MARE-dependent promoter,
pRBGP2, whereas hemin did not increase the tran-
sient expression of phHOLUC45 (Fig. 8B). It has
been reported that hemin induces HO-1 expression in
HeLa cells [36,51], and hemin activates transcription
of the human HO-1 gene [40]. Taken together with
the findings that HO-2 knockdown tends to cause
heme accumulation, we suggest that HO-2 may
modulate transcription of the HO-1 gene through
both heme-dependent and heme-independent mecha-
nisms.
In summary, HO-2 may determine the expression
level of HO-1 by affecting HO-1 mRNA stability and
transcription of the HO-1 gene. This study also reveals
an important regulatory role for HO-2 in the co-ordi-
nated expression of HO-1 and HO-2 and the mainten-
ance of cellular heme concentrations.
Experimental procedures
Materials
Hemin and 4,6-dioxoheptanoic acid (SA) were purchased
from Sigma Chemical (St Louis, MO, USA). SnPP was
from Porphyrin Products (Logan, UT, USA).
Cell cultures
Human cell lines used were HeLa cervical carcinoma cells,
HepG2 hepatoma cells, K562 and YN-1 erythroleukemia
cells, Jurkat T-lymphocyte cells, KG1 myeloid cells, H146
small cell lung cancer cells, and HMV-II melanoma cells.
H146 small cell lung cancer cells were obtained from
ATCC (HTB-173) and cultured in RPMI-1640 medium.
HMV-II melanoma cells were obtained from Riken Cell
Bank and cultured in nutrient mixture Ham’s F12 med-
ium. HeLa and HepG2 cells were maintained in Dul-
becco’s modified Eagle’s medium (Sigma). YN-1 cells were
maintained in Iscove’s modified Dulbecco’s medium (Sigma),
and K562, KG1 and Jurkat cells were maintained in
RPMI-1640 medium (Sigma). Each medium contained
10% heat-inactivated fetal bovine serum, penicillin G
(100 UÆmL
)1
), and streptomycin sulfate (100 lgÆmL
)1
).
Cells were incubated at 37 °C under 5% CO
2
⁄ 95% room
air, unless otherwise specified. HepG2, HeLa and YN-1
cells were treated with 50 lm SnPP or 5 mm SA for up to
48 h. SnPP was freshly prepared and added immediately
to the culture medium. The culture dishes were placed in
the incubator.
Northern and western blot analyses
Total RNAs and proteins were extracted from cells, and
subjected to northern and western blot analyses [15,19].
HO-1 and HO-2 RNA probes were transcribed by SP6
RNA polymerase from pCR-hHO1, carrying the human
HO-1 cDNA fragment (positions 81–878), and pCR-
hHO2, carrying the human HO-2 cDNA fragment (posi-
tions 85–939), as described previously [19]. mRNA signals
were detected with the DIG Northern Starter Kit (Roche
Diagnostics, Mannheim, Germany) according to the
manufacturer’s protocol. In western blot analysis, the sig-
nals of proteins were detected with the ECL Plus Western
Blot Kit (Amersham Biosciences, Piscataway, NJ, USA)
according to the manufacturer’s protocol. The antibody
Fig. 9. Heme accumulation after knockdown of HO-1 or HO-2
expression. HeLa cells (A) and HepG2 cells (B) were cultured for
12 h after transfection with siHO1, siHO2, or siGAPDH, then trea-
ted with 1 l
M hemin for 12 h, and harvested for the measurement
of heme content. Cells were treated for 24 h with Lipofectamine
2000 transfection reagent alone (control). The data are mean ± SEM
from three independent experiments. **P < 0.01.
Heme oxygenase-2 down-regulates heme oxygenase-1 Y. Ding et al.
5342 FEBS Journal 273 (2006) 5333–5346 ª 2006 The Authors Journal compilation ª 2006 FEBS
for HO-1 was a gift from S. Taketani (Kyoto Institute of
Technology, Japan) [52]. Antibodies to HO-2 and b-actin
were purchased from Stressgen (Victoria, BC, Canada)
and Sigma Chemical, respectively. Each blot was exposed
to the Fuji medical X-ray film (Fuji Photo Film Co.,
Tokyo, Japan) for 10–60 s, depending on the experiments.
Heme content of cultured cells
Heme content (expressed as ng ⁄ 10
6
cells) was determined as
described previously [19]. Cell pellet was dissolved in
0.5 mL 2 m oxalic acid by shaking vigorously and immedi-
ately heated for 30 min at 100 °C. Mixtures that had not
been heated were used as a blank for each measurement of
endogenous porphyrins. After cooling down, fluorescence
was measured in a RF-5300PC spectrofluorometer (Shim-
adzu Corp., Kyoto, Japan). Under the conditions used, the
lowest limit of detection is about 1 ng heme ⁄ assay. Cells
(1 · 10
6
) were used to determine heme content in all assays.
In some experiments, HeLa cells and HepG2 cells were cul-
tured for 12 h after the transfection with siHO1, siHO2, or
siGAPDH, then treated with 1 lm hemin for 12 h, and har-
vested for heme measurement.
SiRNA and expression plasmids of HO-1 and
HO-2
A specific siRNA against HO-1, siHO-1, which was repor-
ted by Miralem et al. [53], was used. HO-2 siRNA (target
base 248–272), named siHO-2, was designed and syn-
thesized by iGENE Therapeutics (Tsukubu, Japan), and
scrambled HO-2 siRNA was used as a negative control:
HO-2 siRNA: sense, 5¢-AGGACUUCUUGAAAGGCAA
CAUUAAAG-3¢, antisense, 3¢-UAUCCUGAAGAACUU
UCCGUUGUAAUU-5¢; scrambled HO-2 siRNA: sense,
5¢-UAUAAGAGUCAGUACACAUCAUGGAAG-3¢,anti-
sense, 3¢-UAAUAUUCUCAGUCAUGUGUAGUACCU-5¢.
Another HO-2-specific siRNA, HO-2 siRNA1 (target base
212–232) reported by other investigators [32], was also
used. GAPDH siRNA, named siGAPDH, was used as a
control for siRNA. When HeLa or HepG2 cells were 50%
confluent, they were treated for 24 h with each siRNA by
using Lipofectamine 2000 transfection (Invitrogen, Carls-
bad, CA, USA), or treated with Lipofectamine 2000 trans-
fection reagent alone as a control, according to the
manufacturer’s protocol. The amounts of each siRNA used
were 40 pmol for HeLa cells and 80 pmol for HepG2 cells,
cultured in a 9-cm dish for the indicated hours of incuba-
tion. The effects of siRNA were assessed by northern blot
and western blot analyses.
To construct an HO-1 expression vector, the human
HO-1 cDNA fragment was amplified from the human
HO-1 cDNA pHHO1 [25] by PCR, and subcloned between
HindIII and XbaI sites of the pRc ⁄ CMV vector to yield an
HO-1 expression vector, pRc ⁄ CMV-hHO-1. The PCR
primers used for HO-1 were: forward, 5¢-TTAA
AAGCTT
ATGGAGCGTCCGCAACCCGA-3¢; reverse, 5¢-TTAA
T
CTAGAAAGAAGGCCTTCCACCGG-3¢. The sequences
underlined are HindIII and XbaI sites, which were used for
cloning into pRc ⁄ CMV. Human HO-2 cDNA was ampli-
fied from the pHHO2-1 plasmid [54] by PCR with Pfu
Turbo DNA polymerase (Stratagene, La Jolla, CA, USA),
and then cloned into pCR-bluntII-TOPO (Invitrogen),
yielding pCR-hHO-2-1. The primers used for HO-2 cDNA
were: forward, 5¢-
AAGCTTCATGTCAGCGGAAGTG
GAAAC-3¢; reverse, 5¢-CTGCAGTCACATGTAGTACC
AGGCCAA-3¢. The sequence underlined is an artificial
HindIII site. A full-length HO-2 cDNA fragment was iso-
lated from pCR-hHO-2-1 with EcoR1 and subcloned into
the pMACS4-IRES vector (Miltenyi Biotec Inc., Bergisch-
Gladbach, Germany), generating the HO-2 expression
vector, pMACS-hHO-2.
Effects of HO-2 siRNA on the stability of HO-1
mRNA
To study the effects of HO-2 knockdown on the stability of
HO-1 mRNA, HeLa cells were left untrasnfected or trans-
fected with siHO-2, and incubated for 12 h, followed by the
addition of actinomycin D (1 lgÆmL
)1
) [37]. The cells were
further incubated for up to 7 h, and then harvested at each
time point for RNA preparation.
Luciferase assays
The luciferase reporter constructs used were the human
HO-1 gene constructs, phHOLUC45 and phHOLUC40
[14,36,55,56], and the human HO-2 gene constructs,
phHO2()1494) and phHO2()663) [19]. The test plasmids,
pRBGP2 and pRBGP4, contain three copies of the MARE
and mutated MARE, respectively, in each promoter region
linked to the luciferase gene [39]. HeLa cells were plated
1 day before transfection and grown to 50–70% confluence
in 24-well plates.
For siRNA experiments, HeLa cells at 50% confluence
in 24-well plates were transfected with each luciferase
reporter construct (0.3 lg) using FuGENE 6 transfection
reagent. After 24 h of culture, transfected cells were
re-transfected with 8 pmol HO-1, HO-2, or GAPDH
siRNA using Lipofectamine 2000 transfection reagent, and
then cultured for an additional 24 h. Luciferase activity in
the transfected cells without siRNA treatment was included
as a control. For hemin treatment, HeLa cells at 50–80%
confluence were transfected with each luciferase reporter
(0.3 lg) using FuGENE 6 transfection reagent. After 24 h
culture, transfected cells were treated with control vehicle
or 50 lm hemin and further incubated for 24 h. Expression
of the reporter gene and pRL-TK (internal control) was
determined with the Dual-Luciferase
TM
Reporter Assay
System (Promega, Madison, WI, USA).
Y. Ding et al. Heme oxygenase-2 down-regulates heme oxygenase-1
FEBS Journal 273 (2006) 5333–5346 ª 2006 The Authors Journal compilation ª 2006 FEBS 5343
Acknowledgements
We thank Professor S. Taketani for providing the
HO-1 antibody. This study was supported by Grants-
in-aid for Scientific Research (B), for Scientific
Research on Priority Areas, and by the 21st Century
COE Program Special Research Grant ‘the Center for
Innovative Therapeutic Development for Common
Diseases’ from the Ministry of Education, Science,
Sports, and Culture of Japan.
References
1 Taketani S (2005) Aquisition, mobilization and utiliza-
tion of cellular iron and heme: endless findings and
growing evidence of tight regulation. Tohoku J Exp
Med 205, 297–318.
2 Furuyama K & Sassa S (2000) Interaction between suc-
cinyl CoA synthetase and the heme-biosynthetic enzyme
ALAS-E is disrupted in sideroblastic anemia. J Clin
Invest 105, 757–764.
3 Yoshida T & Kikuchi G (1978) Purification and proper-
ties of heme oxygenase from pig spleen microsomes.
J Biol Chem 253, 4230–4236.
4 Tenhunen R, Marver HS & Schmid R (1970) The enzy-
matic catabolism of hemoglobin stimulation of microso-
mal heme oxygenase by hemin. J Lab Clin Med 75,
410–421.
5 Pimstone NR, Engel P, Tenhunen R, S eitz PT, Marver HS
& Schmid R (1971) Inducible heme oxygenase in the
kidney: a model for the homeostatic control of hemo-
globin catabolism. J Clin Invest 50, 2042–2050.
6 Pimstone NR, Tenhunen R, Seitz PT, Marver HS &
Schmid R (1971) The enzymatic degradation of hemo-
globin to bile pigments by macrophages. J Exp Med
133, 1264–1281.
7 Shibahara S, Yoshida T & Kikuchi G (1978) Induction
of heme oxygenase by hemin in cultured pig alveolar
macrophages. Arch Biochem Biophys 188, 243–250.
8 Shibahara S, Yoshida T & Kikuchi G (1979) Mechan-
ism of increase of heme oxygenase activity induced by
hemin in cultured pig alveolar macrophages. Arch Bio-
chem Biophys 197, 607–617.
9 Okinaga S, Takahashi K, Takeda K, Yoshizawa M,
Fujita H, Sasaki H & Shibahara S (1996) Regulation of
human heme oxygenase-1 gene expression under thermal
stress. Blood 87, 5074–5084.
10 Alam J, Igarashi K, Immenschuh S, Shibahara S & Tyr-
rell RM (2004) Regulation of heme oxygenase-1 gene
transcription: recent advances and highlights from the
International Conference (Uppsala, 2003) on Heme
Oxygenase. Antioxid Redox Signal 6, 924–933.
11 Shibahara S (2003) The heme oxygenase dilemma in cellu-
lar homeostasis: new insights for the feedback regulation
of heme catabolism. Tohoku J Exp Med 200, 167–186.
12 Nakayama M, Takahashi K, Kitamuro T, Yasumoto K,
Katayose D, Shirato K, Fujii-Kuriyama Y & Shibahara S
(2000) Repression of heme oxygenase-1 by hypoxia in
vascular endothelial cells. Biochem Biophys Res Commun
271, 665–671.
13 Kitamuro T, Ta kahashi K, Ogawa K, Udono-Fujimori R,
Takeda K, Furuyama K, Nakayama M, Sun J, Fujita
H, Hida W, et al. (2003) Bach1 functions as a hypoxia-
inducible repressor for the heme oxygenase-1 gene in
human cells. J Biol Chem 278, 9125–9133.
14 Udono-Fujimori R, Takahashi K, Takeda K,
Furuyama K, Kaneko K, Takahashi S, Tamai M &
Shibahara S (2004) Expression of heme oxygenase-1 is
repressed by interferon-gamma and induced by hypoxia
in human retinal pigment epithelial cells. Eur J Biochem
271, 3076–3084.
15 Takahashi K, Hara E, Suzuki H, Sasano H & Shiba-
hara S (1996) Expression of heme oxygenase isozyme
mRNAs in the human brain and induction of heme
oxygenase-1 by nitric oxide donors. J Neurochem 67,
482–489.
16 Zenclussen AC, Lim E, Knoeller S, Knackstedt M, Her-
twig K, Hagen E, Klapp BF & Arck PC (2003) Heme
oxygenases in pregnancy II: HO-2 is downregulated in
human pathologic pregnancies. Am J Reprod Immunol
50, 66–76.
17 Lash GE, McLaughlin BE, MacDonald-Goodfellow SK,
Smith GN, Brien JF, Marks GS, Nakatsu K & Graham
CH (2003) Relationship between tissue damage and heme
oxygenase expression in chorionic villi of term human
placenta. Am J Physiol Heart Circ Physiol 284,
H160–H167.
18 Appleton SD, Mark SGS, Nakatsu K, Brien JF,
Smith GN, Graham CH & Lash GE (2003) Effects of
hypoxia on heme oxygenase expression in human
chorionic villi explants and immortalized trophoblast
cells. Am J Physiol Heart Circ Physiol 284, H853–H858.
19 Zhang Y, Furuyama K, Kaneko K, Ding Y, Ogawa K,
Yoshizawa M, Kawamura M, Takeda K, Yoshida T &
Shibahara S (2006) Hypoxia reduces the expression of
heme oxygenase-2 in various types of human cell lines.
FEBS J 273, 3136–3147.
20 Zenclussen AC, Joachim R, Hagen E, Peiser C,
Klapp BF & Arck PC (2002) Heme oxygenase is down-
regulated in stress-triggered and interleukin-12-mediated
murine abortion. Scan J Immunol 55, 560–569.
21 Han F, Takeda K, Yokoyama S, Ueda H, Shinozawa Y,
Furuyama K & Shibahara S (2005) Dynamic changes in
expression of heme oxygenases in mouse heart and liver
during hypoxia. Biochem Biophys Res Commun 338 ,
653–659.
22 Sassa S & Nagai T (1996) The role of heme in gene
expression. Int J Hematol 63, 167–178.
23 Ishikawa K, Takeuchi N, Takahashi S, Matera KM,
Sato M, Shibahara S, Rousseau DL, Ikeda-Saito M &
Heme oxygenase-2 down-regulates heme oxygenase-1 Y. Ding et al.
5344 FEBS Journal 273 (2006) 5333–5346 ª 2006 The Authors Journal compilation ª 2006 FEBS
Yoshida T (1995) Heme oxygenase-2. Properties of the
heme complex of the purified tryptic fragment of recom-
binant human heme oxygenase-2. J Biol Chem 270,
6345–6350.
24 Shibahara S, Muller R, Taguchi H & Yoshida T (1985)
Cloning and expression of cDNA for rat heme oxyge-
nase. Proc Natl Acad Sci USA 82, 7865–7869.
25 Yoshida T, Biro P, Cohen T, Muller RM & Shibahara S
(1988) Human heme oxygenase cDNA and induction of
its mRNA by hemin. Eur J Biochem 171, 457–461.
26 McCoubrey WK Jr, Huang TJ & Maines MD (1997)
Heme oxygenase-2 is a hemoprotein and binds heme
through heme regulatory motifs that are not involved in
heme catalysis. J Biol Chem 272, 12568–12574.
27 Poss KD & Tonegawa S (1997) Reduced stress defense
in heme oxygenase 1-deficient cells. Proc Natl Acad Sci
USA 94, 10925–10930.
28 Poss KD, Thomas MJ, Ebralidze AK, O’Dell TJ &
Tonegawa S (1995) Hippocampal long-term potentiation
is normal in heme oxygenase-2 mutant mice. Neuron 15,
867–873.
29 Burnett AL, Johns DG, Kriegsfeld LJ, Klein SL,
Calvin DC, Demas GE, Schramm LP, Tonegawa S,
Nelson RJ, Snyder SH, et al. (1998) Ejaculatory
abnormalities in mice with targeted disruption of the
gene for heme oxygenase-2. Nat Med 4, 84–87.
30 Dennery PA, Spitz DR, Yang G, Tatarov A, Lee CS,
Shegog ML & Poss KD (1998) Oxygen toxicity and iron
accumulation in the lungs of mice lacking heme oxyge-
nase-2. J Clin Invest 101, 1001–1011.
31 Adachi T, Ishikawa K, Hida W, Matsumoto H,
Masuda T, Date F, Ogawa K, Takeda K, Furuyama K,
Zhang Y, et al. (2004) Hypoxemia and blunted hypoxic
ventilatory responses in mice lacking heme oxygenase-2.
Biochem Biophys Res Commun 320, 514–522.
32 Williams SE, Wootton P, Mason HS, Bould J, Iles DE,
Riccardi D, Peers C & Kemp PJ (2004) Hemoxygenase-
2 is an oxygen sensor for a calcium-sensitive potassium
channel. Science 306, 2093–2097.
33 Endo K, Harigae H, Nagai T, Fujie H, Meguro K,
Watanabe N, Furuyama K, Kameoka J, Okuda M &
Hayashi N (1993) Two chronic myelogenous leukaemia
cell lines which represent different stages of erythroid
differentiation. Br J Haematol 85, 653–662.
34 Rutherford TR, Clegg JB & Weatherall DJ (1979) K562
human leukaemic cells synthesise embryonic haemoglo-
bin in response to haemin. Nature 280, 164–165.
35 Sassa S (1997) Inhibition of carbon monoxide produc-
tion by tin-protoporphyrin. J Pediatr Gastroenterol Nutr
6, 167–171.
36 Takeda K, Ishizawa S, Sato M, Yoshida T & Shibahara S
(1994) Identification of a cis-acting element that is
responsible for cadmium-mediated induction of the
human heme oxygenase gene. J Biol Chem 269,
22858–22867.
37 Takahashi K, Hara E, Ogawa K, Kimura D, Fujita H
& Shibahara S (1997) Possible implications of the induc-
tion of human heme oxygenase-1 by nitric oxide donors.
J Biochem (Tokyo) 121, 1162–1168.
38 Hara E, Takahashi K, Takeda K, Nakayama M, Yos-
hizawa M, Fujita H, Shirato K & Shibahara S (1999)
Induction of heme oxygenase-1 as a response in sensing
the signals evoked by distinct nitric oxide donors. Bio-
chem Pharmacol 58, 227–236.
39 Igarashi K, Kataoka K, Itoh K, Hayashi N, N ishizawa M
& Yamamoto M (1994) Regulation of transcription by
dimerization of erythroid factor NF-E2 p45 with small
Maf proteins. Nature 367, 568–572.
40 Hill-Kapturczak N, Sikorski E, Voakes C, Garcia J,
Nick HS & Agarwal A (2003) An internal enhancer reg-
ulates heme- and cadmium-mediated induction of
human heme oxygenase-1.
Am J Physiol Renal Physiol
285, F515–523.
41 Wang D, Youngson C, Wong V, Yeger H, Dinauer MC,
Vega-Saenz de Miera E, Rudy B & Cutz E (1996)
NADPH-oxidase and a hydrogen peroxide-sensitive K
+
channel may function as an oxygen sensor complex in
airway chemoreceptors and small cell lung carcinoma cell
lines. Proc Natl Acad Sci USA 93, 13182–13187.
42 Zakhary R, Poss KD, Jaffrey SR, Ferris CD, Tonegawa
S & Snyder SH (1997) Targeted gene deletion of heme
oxygenase 2 reveals neural role for carbon monoxide.
Proc Natl Acad Sci USA 94, 14848–14853.
43 Yachie A, Niida Y, Wada T, Igarashi N, Kaneda H,
Toma T, Ohta K, Kasahara Y & Koizumi S (1999) Oxi-
dative stress causes enhanced endothelial cell injury in
human heme oxygenase-1 deficiency. J Clin Invest 103,
129–135.
44 Oyake T, Itoh K, Motohashi H, Hayashi N, Hoshino H,
Nishizawa M, Yamamoto M & Igarashi K (1996) Bach
proteins belong to a novel family of BTB-basic leucine
zipper transcription factors that interact with MafK and
regulate transcription through the NF-E2 site. Mol Cell
Biol 16, 6083–6095.
45 Igarashi K & Sun J (2006) The heme-Bach1 pathway
in the regulation of oxidative stress response and ery-
throid differentiation. Antioxid Redox Signal 8, 107–
118.
46 Ogawa K, Sun J, Taketani S, Nakajima O, Nishitani C,
Sassa S, Hayashi N, Yamamoto M, Shibahara S,
Fujita H, et al. (2001) Heme mediates derepression of
Maf recognition element through direct binding to tran-
scription repressor Bach1. EMBO J 20, 2835–2843.
47 Sun J, Hoshino H, Takaku K, Nakajima O, Muto A,
Suzuki H, Tashiro S, Takahashi S, Shibahara S, Alam J,
et al. (2002) Hemoprotein Bach1 regulates enhancer
availability of heme oxygenase-1 gene. EMBO J 21,
5216–5224.
48 Alam J, Stewart D, Touchard C, Boinapally S, Choi AM
& Cook JL (1999) Nrf2, a Cap’n’Collar transcription
Y. Ding et al. Heme oxygenase-2 down-regulates heme oxygenase-1
FEBS Journal 273 (2006) 5333–5346 ª 2006 The Authors Journal compilation ª 2006 FEBS 5345
factor, regulates induction of the heme oxygenase-1 gene.
J Biol Chem 274, 26071–26078.
49 Sun J, Brand M, Zenke Y, Tashiro S, Groudine M &
Igarashi K (2004) Heme regulates the dynamic exchange
of Bach1 and NF-E2-related factors in the Maf tran-
scription factor network. Proc Natl Acad Sci USA 101,
1461–1466.
50 Kimpara T, Takeda A, Watanabe K, Itoyama Y,
Ikawa S, Watanabe M, Arai H, Sasaki H, Higuchi S,
Okita N, et al. (1997) Microsatellite polymorphism in
the human heme oxygenase-1 gene promoter and its
application in association studies with Alzheimer and
Parkinson disease. Hum Genet 100 , 145–147.
51 Sato M, Ishizawa S, Yoshida T & Shibahara S (1990)
Interaction of upstream stimulatory factor with the
human heme oxygenase gene promoter. Eur J Biochem
188, 231–237.
52 Masuya Y, Hioki K, Tokunaga R & Taketani S (1998)
Involvement of the tyrosine phosphorylation pathway in
induction of human heme oxygenase-1 by hemin,
sodium arsenite, and cadmium chloride. J Biochem
(Tokyo) 124, 628–633.
53 Miralem T, Hu Z, Torno MD, Lelli KM & Maines MD
(2005) Small interference RNA-mediated gene silencing
of human biliverdin reductase, but not that of heme
oxygenase-1, attenuates arsenite-mediated induction of
the oxygenase and increases apoptosis in 293A kidney
cells. J Biol Chem 280, 17084–17092.
54 Shibahara S, Yoshizawa M, Suzuki H, Takeda K,
Meguro K & Endo K (1993) Functional analysis of
cDNAs for two types of human heme oxygenase and
evidence for their separate regulation. J Biochem
(Tokyo) 113, 214–218.
55 Shibahara S, Sato M, Muller RM & Yoshida T (1989)
Structural organization of the human heme oxygenase
gene and the function of its promoter. Eur J Biochem
179, 557–563.
56 Takahashi S, Takahashi Y , Ito K, Nagano T, Shibahara S
& Miura T (1999) Positive and negative regulation of
the human heme oxygenase-1 gene expression in cul-
tured cells. Biochim Biophys Acta 1447, 231–235.
Heme oxygenase-2 down-regulates heme oxygenase-1 Y. Ding et al.
5346 FEBS Journal 273 (2006) 5333–5346 ª 2006 The Authors Journal compilation ª 2006 FEBS