Metabolite profiling in plant biology: platforms and destinations pptx
Bạn đang xem bản rút gọn của tài liệu. Xem và tải ngay bản đầy đủ của tài liệu tại đây (264.4 KB, 9 trang )
Genome Biology 2004, 5:109
comment
reviews
reports
deposited research
interactions
information
refereed research
Opinion
Metabolite profiling in plant biology: platforms and destinations
Joachim Kopka, Alisdair Fernie, Wolfram Weckwerth, Yves Gibon and
Mark Stitt
Address: Max-Planck Institute of Molecular Plant Physiology, Am Mühlenberg 1, 14476 Golm, Germany.
Correspondence: Mark Stitt. E-mail:
Published: 18 May 2004
Genome Biology 2004, 5:109
The electronic version of this article is the complete one and can be
found online at />© 2004 BioMed Central Ltd
The challenge
Genes and genomes can be routinely sequenced, the resulting
information stored, accessed and analyzed, and organisms
with altered gene expression produced. Use of these
resources requires powerful phenotyping platforms, including
approaches for the systematic analysis of metabolite com-
position. Whereas the chemistry of nucleic acids is relatively
simple and uniform, there are tens of thousands of metabo-
lites, with an immense range of types of structure. This has
led to a plethora of different extraction, separation and
detection systems for different groups of metabolically
important compounds. Researchers have typically measured
a handful of metabolites, chosen on the basis of assumptions
about what was relevant and the technical capacity of their
laboratory. But now, in parallel with the development of
genome-wide gene-expression arrays, there has been a shift
to an ‘unbiased’ approach to metabolite analysis.
It is helpful to distinguish between metabolite fingerprinting,
metabolite profiling and metabolomics. Metabolic fingerprint-
ing is the application of a broad analytic technology to discover
some big differences between two samples, for example two
different genotypes. It provides information that helps to orien-
tate a research project. Metabolite profiling is the measurement
of hundreds or potentially thousands of metabolites. It requires
a streamlined pipeline for extraction, separation and analysis,
so that large numbers of metabolites can be measured in a
robust and quantitative manner while in the presence of the
extraordinarily complex mixture of chemicals (‘matrix’) that is
found in cellular extracts. Metabolomics, in the strict sense, is
the measurement of all metabolites in a given system. It is not
yet technically possible, and will probably require a platform of
complementary technologies, because no single technique is
comprehensive, selective, and sensitive enough to measure
them all [1]. This article provides an overview of technologies
for metabolite profiling, discusses problems relating to the
reliability and interpretation of the huge datasets these tech-
nologies produce, and outlines how they can be used to answer
important questions in plant biology in the future.
Hardware platforms
Gas chromatography coupled to mass spectrometry
(GC-MS)
In gas chromatography coupled to mass spectrometry
(GC-MS), compounds are separated by GC and then trans-
ferred online to the mass spectrometer for further separation
and detection. This combines two strongly complementary
Abstract
Optimal use of genome sequences and gene-expression resources requires powerful phenotyping
platforms, including those for systematic analysis of metabolite composition. The most used
technologies for metabolite profiling, including mass spectral, nuclear magnetic resonance and
enzyme-based approaches, have various advantages and disadvantages, and problems can arise with
reliability and the interpretation of the huge datasets produced. These techniques will be useful for
answering important biological questions in the future.
technologies: GC can separate metabolites that have almost
identical mass spectra (such as isomers), while MS provides
fragmentation patterns that differentiate between co-eluting,
but chemically diverse, metabolites. GC-MS provides quanti-
tative information and is widely used for clinical diagnostics
[2] and large-scale profiling of complex biological samples
[3-5]. It has six important component steps.
Extraction
Preparation of an extract should be as non-selective and com-
prehensive as possible. But treatments that stabilize one set of
metabolites often lead to degradation or modifications of
others. Furthermore, it may be necessary to separate fractions
so as to profile trace metabolites when the sample is dominated
by a small number of highly concentrated metabolites [6,7].
Derivatization
Derivatization is necessary to render metabolites volatile,
and so amenable to GC-MS. There is an extensive toolbox of
chemical reagents for GC-MS derivatization, including alky-
lating, acylating and silylating reagents [8]. At present,
trimethylsilylation is the favored choice [6]. In contrast to
other reagents, which are in part highly specific for chemical
moieties of certain metabolite classes, trimethylsilylation
uses the most comprehensive reagent and thus complies best
with the requirements of a non-biased metabolite profiling.
Separation by GC
Highly standardized conditions are needed for separation of
metabolites by GC, because slight changes in gas-flow condi-
tions, temperature programming and the type of capillary
column affect chromatographic retention, and can even alter
the order in which compounds are eluted [9].
Ionization
The most widely used ionization method for GC-MS is elec-
tron impact (EI) ionization, a robust, reproducible approach
that is not subject to ion suppression effects (mutual inter-
ference between compounds, leading to one or both being
underestimated or not detected; see the glossary in Box 1 for
further details). EI transfers a fixed energy load of -70 eV to
compounds, and the compounds are then directly trans-
ferred as molecular ions from the GC outlet into a high
vacuum. The energy load exceeds the first ionization energy
of all molecules, leading to very efficient generation of molecu-
lar ions. Surplus energy is dissipated via highly reproducible,
concentration-independent, fragmentation of the molecular
ions, which has two important consequences. Firstly, almost
all molecular ions carry one positive charge, which simplifies
evaluation of the mass spectra. Secondly, the highly repro-
ducible, compound-specific mass spectral fragmentation
pattern aids identification of the compounds.
Detection
Three sorts of mass-detection device are used in GC-MS
couplings: single quadrupole detectors (QUAD), ion-trap
technology (TRAP), and time-of-flight detectors (TOF; see Box
1 for further details). The throughput of GC-QUAD-MS
systems (10-20 samples per day) resembles that of typical
high-performance liquid chromatography (HPLC) applica-
tions. GC-TRAP-MS technology has a similar throughput,
but includes reaction monitoring (MS
n
) capability, in which
a predefined fragment mass is sampled (parent ion trapping)
and subjected to secondary fragmentation to generate
daughter fragments. This increases selectivity and sup-
presses chemical ‘noise’, an advantage for the analysis of
trace compounds in complex samples [6,7]. It also aids in
the identification of compounds. GC-TOF-MS systems allow
higher throughput (10-50 scans per second, allowing 30-40
samples per day).
Evaluation
Compounds are identified by matching their chromato-
graphic retention times and mass-spectral fragmentation
patterns to known and predicted information available in
databases [9]. Typical GC-QUAD-MS software requires
expert knowledge about the characteristic fragment masses
and retention time windows of each metabolite, and of the
pitfalls that can lead to misidentification. Accumulation of
experience is time consuming, but is aided by creating
mass-spectral and retention-time index reference libraries
for all routinely occurring metabolites. This manually sup-
ported process requires around 2 minutes per metabolite,
allowing about 20 chromatogram files to be evaluated per
day (with increasing numbers of metabolites this is the rate-
limiting step of sample analysis). A major advantage of GC-
TOF-MS systems (such as the GC-TOF-Pegasus II MS from
Leco Corp Inc., St. Joseph, USA) is their enhanced software
capability [9,10], which supports automated and compre-
hensive extraction of all mass spectra from a chro-
matogram, in-built mass-spectral correction for co-eluting
metabolites, calculation of retention-time indices, and auto-
mated picking of a suitable fragment mass for selective
quantification. GC-TOF-MS has the potential to be truly
non-biased and fully automated with respect to metabolite
identification, but at present it still requires expert input to
correct inappropriate assignments.
Overall, about two days are needed to carry a batch of 50
samples through extraction and derivatization steps [4]. Analy-
sis and evaluation of one sample (derivatization, separation by
GC and ionization) requires 60-75 minutes by GC-QUAD-MS
or 35-45 minutes by GC-TOF-MS. The throughput is exceeded
only by fingerprinting technologies, or targeted analyses of
single metabolites. The major bottleneck is the evaluation and
manual check for misidentified metabolites. GC-MS provides
exact absolute quantification of the level of a given metabolite
in a concentration range of up to four orders of magnitude, pro-
vided that appropriate external and internal standardization
has been carried out. Each step during extraction, preparation
and analysis can introduce general and substance-specific
losses, however, and these can vary with the biological material.
109.2 Genome Biology 2004, Volume 5, Issue 6, Article 109 Kopka et al. />Genome Biology 2004, 5:109
comment
reviews
reports
deposited research
interactions
information
refereed research
Genome Biology 2004, Volume 5, Issue 6, Article 109 Kopka et al. 109.3
Genome Biology 2004, 5:109
Box 1
Glossary
Ionization methods
Ionization is crucial to mass spectrometry: if there are no ions, there is no means of transporting and separating molecules
through the vacuum that is required for mass detection. Ionization can be performed by passing molecules through a high-
energy electron beam set to 70 eV, in so-called electron impact (EI) ionization; by electron discharge/electospray
ionization (ESI); by chemical reactions (chemical ionization, CI) or by photons (in atmospheric pressure photo-ionization,
APPI). Hard ionization, such as EI, transfers energy in excess of the first ionization energy required, so that all molecules are
ionized but excess energy in most cases causes strong molecular fragmentation. Soft ionization technologies, such as ESI, CI
and APPI, transfer less energy; as a result molecules are less likely to form fragments, but not all compounds can be ionized.
Electrospray ionization (ESI) ionizes molecules that are dissolved in large amounts of solvent, as is typically used in
liquid chromatography. The ionization process starts with the formation of small charged liquid droplets, which are
sprayed into a vacuum. The solvent evaporates while the charge is concentrated at the surface of the shrinking droplets.
Finally the charge is transferred to the solutes, and ions are discharged from the small droplets by electrostatic repul-
sion. The resulting ions can subsequently be analyzed by mass-spectrometric detectors. Electrospray preferentially
ionizes molecules with low ionization potential. If molecules compete for ionization, those molecules that do not readily
form ions may be lost (so-called suppression). Atmospheric pressure photoionization (APPI) is an emerging
alternative to electrospray ionization. APPI uses a hot stream of inert gas instead of a vacuum to dry charged droplets
and finally release ions. Photoionization utilizes photons adjusted to approximately 10 eV, instead of electron discharge
or chemical reactions, for the ionization of molecules. Photoionization has the advantage of allowing the ionization of
less polar molecules, which are either not ionized or produce unstable ions when subjected to other techniques.
Mass-detection approaches
Quadrupole detectors (QUAD) are analytical devices for the mass-spectrometric detection and quantification of ions,
which are generated from molecules of interest by one of the available methods for ionization and fragmentation. The
quadrupole is a set of four metal rods, which are electronically operated as a mass-selective ion filter. Quadrupole detectors
generate mass spectra by counting the ions that pass this filter at each of the successively monitored masses. Triple quadru-
pole detectors are a variation of the single quadrupole detector, in which three quadrupole devices are coupled in a linear
array. Ions that are generated in an ion source are passed through the first quadrupole, which is used as a mass-selective filter
that permits specific selection of ‘parent ions’ of a defined mass. The selected parent ions enter a second quadrupole device,
which is used as a ‘collision cell’. Here, collision of parent ions with gas molecules results in the generation of ‘daughter ions’,
which are breakdown products of the parent ions. The daughter ions are then passed on to the third quadrupole device,
which is again used as a mass-selective filter. This last filter allows determination of the masses of the daughter ions, and also
counts them. Because of the two selective filtering steps, triple quadrupole detectors are much more efficient than single
quadropoles at removing from a complex mixture all unwanted components and leaving the target metabolite of interest.
Ion-trap technology (TRAP) is also used for the mass-spectrometric detection and quantification of ions. In contrast
to quadrupole technology, which allows linear movement of ions, the ion-trap device first collects and stores ions by
forcing them into stable orbits. Then, the ions are released from the device and counted. This two-step process allows
the generation of mass spectra by trapping and release of ions of successive masses. In addition, the collected and
stored ‘primary ions’ can be fragmented a second time and thus secondary fragments can be analyzed. This process is
highly useful in determining the structure of molecules, or in monitoring known compounds in highly complex samples.
Time-of-flight technology (TOF) is a third mass-spectrometric technology for detection and quantification of ions; it was
developed initially for the analysis of macromolecules, such as proteins, peptides and polysaccharides, by matrix-assisted laser
desorption (MALDI-TOF). Recent modifications to this technology allow online coupling to gas chromatography. Ions are
bundled into small packages, simultaneously accelerated along an evacuated flight tube and detected at a fixed distance. Ions
of low mass travel faster than those with a high mass and can thus be distinguished by time of flight. Each of the bundling,
accelerating and detection cycles takes only a few milliseconds. Thus GC-TOF-MS is ideally suited for fast-scanning analysis of
small volatile molecules, whereas MALDI-TOF-MS is the preferred technology in polymer analysis and proteomics.
Ideally, each compound should be standardized using a stable-
isotope-labeled isotopomer that is differentially detectable by
mass spectrometry, or a xenobiotic stereoisomer that is distin-
guishable by its chromatographic properties [4,11]
One major limitation is that GC can be used only for volatile
compounds or compounds that can be chemically trans-
formed into volatile derivatives (see [12] for a list). Current
methods detect trisaccharides, steroids, diglycerides and
some monophosphorylated metabolites (such as glycerol 3-
phosphate and glucose 6-phosphate), but most polyphos-
phorylated and activated metabolic intermediates are
presently not accessible to GC-MS analyses (see Figure 1 for
an example of a GC-QUAD-MS profiling experiment).
The other major limitation of GC-MS is that most peaks are still
unidentified. This is a tribute to the high sensitivity and resolu-
tion of capillary GC-MS, but a frustration for the biologist.
Some ‘unknowns’ may be analytes generated during extraction
and sample preparation, or by fragmentation in the MS step,
but others may be important and even novel metabolites. Their
identification is therefore an important activity, which cumula-
tively increases the power of GC-MS platforms. The straightfor-
ward approach involves addition to the battery of authenticated
standard metabolites that interest the biologist. Elucidating the
identity of a peak of interest is more difficult, however, because
GC-MS is destructive and usually does not generate enough
pure substance for structural elucidation (for example, the
upper microgram to milligram range required for offline
nuclear magnetic resonance, NMR).
Liquid chromatography coupled to mass
spectrometry (LC-MS)
Liquid chromatography coupled to MS (LC-MS) exploits the
high separation power of HPLC, including its ability to sepa-
rate compounds of high molecular weight that cannot be ana-
lyzed by GC. An enormous range of columns and elution
procedures are available. Traditionally, HPLC has been
coupled to ultraviolet and visible light (UV/VIS) or diode-
array detectors. Coupling it to MS instead provides further
selectivity, unbiased detection, and information about the
structures of the separated compounds. Metabolites are intro-
duced into the mass spectrometer by electrospray ionization
(ESI). ESI is an atmospheric pressure process, transferring
analyte molecules that elute from an HPLC column into the
gas phase suitable for mass analysis. The analytes enter the
mass spectrometer as charged molecules that are transported
in an electrical field between the end of the column and the
entrance of the mass spectrometer. Ionization can occur via
protonation (ESI+) or deprotonation (ESI-) [13,14] and can
lead to single and multiple ions. The presence of multiple ions
shifts the mass-to-charge ratio (m/z) of even high-mass ana-
lytes into the scanning range of a typical mass analyzer. When
ESI is combined with high-end mass spectrometers there is
effectively no mass-range restriction, allowing complete pro-
teins to be analyzed [15]. ESI has a bias against less polar com-
pounds, such as terpenes, carotenoids and aliphatics, for
which it is better to use alternative procedures, such as atmos-
pheric pressure photoionization (APPI) [16] or GC-MS.
Structural information is obtained by collision-induced decom-
position [17]. Parent ions produced by ESI are isolated and
accelerated inside the mass spectrometer using quadrupole
mass filters (see Box 1), forcing them to collide with molecules
of the bath gas (usually helium or argon). The resulting frag-
ment spectrum can be compared with fragmentation libraries
for known chemical structures. Depending on the mass ana-
lyzer used, several fragment spectra per second can be per-
formed ‘on the fly’. Using quadrupole ion traps it is further
possible to generate multiple fragment spectra of selected frag-
ments of a parent ion mass (see Box 1 for further information).
Evaluation needs expert knowledge. Complications arise
from chromatographic interference, the enhancement or sup-
pression of ionization in complex matrices, and the presence
of multiple ions [18]. This makes it vital to develop robust
and standardized protocols, and to include routine checks in
case changes in the complex mix of compounds within a bio-
logical extract are affecting the separation and analysis.
Triple quadrupole instruments allow quantification by
single-reaction monitoring (SRM). A specific mass ion - the
metabolite of interest - is selected ‘on-the-fly’ with the first
quadrupole mass filter, fragmented in the second quadru-
pole, and a corresponding fragment is then selected in the
third quadrupole. SRM provides highly specific mass-ion
traces for preselected metabolites, which can then be quanti-
fied by peak integration. It provides high selectivity and sen-
sitivity, but it can only be applied to metabolites that have
known fragmentation pathways. It can also only be applied
to a certain number of metabolites per run.
LC-MS has mainly been used to analyze selected metabolites
[19], but it has enormous potential for metabolite profiling, as
a complement to GC-MS. High-resolution mass spectrometry
[20] (detecting 11,000 mass ions in a single spectrum) and
high-resolution chromatography [21,22] will further increase
the number of metabolites detected. The biggest challenges
are to develop an automated procedure for evaluation and
metabolite quantification from raw chromatograms similar to
those already available for GC-MS [23,24], and to discover
the identity of the huge numbers of unknown metabolites and
analytes detected by these powerful analytic platforms. This
can be achieved using structural information from the MS
n
capactity of LC-MS systems [18,25], and by combining LC-
MS with Fourier-transform ion cyclotron resonance mass
spectrometry (FTICRMS) and NMR.
Fourier-transform ion cyclotron resonance mass
spectrometry
In Fourier-transform ion cyclotron resonance mass spec-
trometry (FTICRMS), extracts are directly infused into the
109.4 Genome Biology 2004, Volume 5, Issue 6, Article 109 Kopka et al. />Genome Biology 2004, 5:109
comment
reviews
reports
deposited research
interactions
information
refereed research
Genome Biology 2004, Volume 5, Issue 6, Article 109 Kopka et al. 109.5
Genome Biology 2004, 5:109
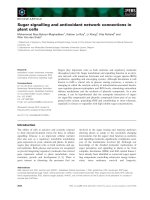
Figure 1
An example of a metabolite profile. The results of quadrupole GC-QUAD-MS total ion chromatogram of different tissues of tomato (Lycopersicon
esculentum) are shown. (a-c) Complete chromatogram (12.0-50.0 min). (d-f) An illustration of sample complexity and analyte range, by a representative
expansion of the chromatograms shown in (a-c) for the region 26.3-28.2 min (highlighted). Tissues are: (a,d) tomato source leaf; (b,e) green fruit (30 days
after flowering, DAF); (c,f) red fruit (60 DAF). Major peaks in the expanded region are identified directly on the chromatogram; *indicates novel
metabolites detected within tomato fruit extracts compared to tomato leaf extracts. This figure illustrates clearly the problem of overloading, as sugars
accumulate to high levels in red fruits, demonstrating the importance of measuring every metabolite at a concentration wherein the peak area is
proportional to the metabolite concentration. Reproduced with permission from [47], which contains further details of the method and of the
metabolites identified.
26.300 26.400 26.500 26.600 26.700 26.800 26.900 27.000 27.100 27.200 27.300 27.400 27.500 27.600 27.700 27.800 27.900 28.000 28.100
rt
27.798
27.603
27.426
26.466
27.687
27.880
28.117
27.770
27.353
26.461
27.515
28.041
27.350
27.083
26.440
26.870
27.516
28.031
citrate
quinate
unknown
frc MX1
frc MX2
glc MX1
glc MX
1
gal
27.782
12.000 14.000 16.000 18.000 20.000 22.000 24.000 26.000 28.000 30.000 32.000 34.000 36.000 38.000 40.000 42.000 44.000
1
92
8
37
6
5
4
16
15
14
13
12
11
10
20
21
22
18
19
17
23
6
4 5
26*
25*
3
24*
2
1
15
13 14
29*
11
27* 28*
7
20
2119
18
30*
16
23
9
rt
1
92
8
37
6
5
4
16
15
14
12
11
10
20
21
22
18
19
17
23
6
4 5
26*
25*
3
24*
2
1
15
13 14
29*
11
27* 28*
7
20
2119
18
30*
16
23
9
100
%
0
100
%
100
%
0
100
%
100
%
0
100
%
0
100
%
0
100
%
0
100
%
(a)
(b)
(c)
(d)
(e)
(f)
MS instrument using soft ionization techniques, to gain fin-
gerprints of the molecular ions present [26]. This technique
requires a mass analyzer of sufficient accuracy to generate
the definitive empirical formulae for several hundred ions.
For profiling, it currently has two major limitations. Firstly,
the lack of chromatography renders it incapable of distin-
guishing between isomers, because of their identical molecu-
lar masses, making unambiguous discrimination of many
metabolites impossible. Secondly, there is no documentation
of vigorous method validation, which is required to support
its utilization for metabolite analyses. These caveats aside, it
is clear that the coupling of such a machine to instrumenta-
tion allowing high-quality separation of analytes would allow
a far greater accuracy of identification - albeit at a heavy cost
in terms of sample throughput.
Nuclear magnetic resonance spectroscopy (NMR)
A radically alternative approach is to use NMR to detect and
quantify metabolites, via the magnetic properties of isotopes
of the constituent atoms. In principle, this approach will
detect an exceedingly broad range of metabolites, because
hydrogen, carbon, nitrogen, phosphorus and oxygen have
magnetic isotopes that are detectable by NMR [27,28]. The
computational analysis and chemometric software are highly
developed, enabling rapid processing of acquired spectral
data and identification of metabolites from the signals.
In practice, however, NMR detects fewer metabolites and
has a smaller dynamic range than MS-based technologies
[5]. Although around 2,700 analytes were detected in a study
of plant extracts using LC-NMR [29], fewer than 50 could be
quantified and unambiguously identified. The lower sensi-
tivity of NMR-based techniques restricts them to quantifica-
tion of the most abundant compounds [30,31] or single
classes of compounds [32,33]. In wide surveys, they provide
mainly non-quantitative information [34].
Although NMR spectroscopy is of limited utility for metabo-
lite profiling, it is important for unequivocal determination
of metabolite structure, which is one of the major bottle-
necks of metabolite profiling. Two other features also make
it invaluable for specific applications: it can be used to study
metabolite levels in vivo, albeit for only a few major metabo-
lites [27,28], and it can be used to unravel complex meta-
bolic fluxes by following labeled atoms through metabolic
intermediates at the atomic level [35].
Developments in UV/visible spectroscopic and
enzyme-based assays
There are innumerable methods for detecting specific com-
pounds or groups of compounds, using UV/visible light
absorbance, fluorescence or luminescence. Metabolites are
detected directly, or after chromatographic separation, or
after specific chemical or enzymatic reactions have con-
verted a given metabolite into an analyte that can be
detected spectroscopically. There are often diverse methods
available for any one metabolite, differing in sensitivity,
specificity, throughput, or in the type of equipment needed
[36]. It is difficult to base a high-throughput profiling plat-
form around such diverse procedures and instrumentation.
They nevertheless provide an important component in any
profiling platform because, for example, they allow sensitive
quantification of low-level phosphorylated intermediates
and coenzymes [37]. Spectrophotometry usually provides
sensitivity in the nanomole range, and this can be increased
100- to 1,000-fold by using enzyme-activation [38], enzyme-
inhibition [39] or cycling [37] assays, fluorimetry [40,41]
and luminometry [42].
These dedicated assays allow high-throughput analysis,
which is crucial for diagnostic purposes and for the design of
profiling experiments, an aspect of functional genomics
whose importance is frequently underestimated [43]. A labo-
ratory equipped with a simple microplate reader can assay
and calculate the results for several hundred extracts in a
day. Throughput can be increased to over 100,000 analyses
per day by combining microplate technology with robotics
[44]. The bottleneck for such approaches is then the prepa-
ration and extraction of samples.
The evolution of high-throughput assays is linked to minia-
turization to save material, costs and time. While microplate
technology is approaching saturation in terms of scaling
down, new microchip-based techniques such as microfluidic
chips that operate in the nanoliter range [45] will dramati-
cally increase throughput and also lower costs [46]. One use
will be in combination with enzymatic reactions which gener-
ate fluorogenic products that allow sensitive detection. This
will probably be restricted by the availability of enzymes and
substrates, however. Another approach will be to use apoen-
zymes (proteins that bind their substrate without further
catalysis) fused to fluorophores, allowing substrate binding
and the resulting conformational changes to be detected by
fluorescence. The creation of vast libraries of apoenzymes
covering the different parts of the metabolome could lead to a
new generation of ultra-high-throughput profiling methods.
Faith is good but controls are better
The chemical complexity of metabolites and extracts makes
checks of the extraction and analytic procedures vital.
Without them, the levels reported for a particular tissue may
be incorrect, and differences reported between tissues may
be artifacts due to differential losses in contrasting matrices.
Compared to transcripts and proteins, metabolites have high
turnover rates. It is imperative to harvest the tissue of inter-
est without subjecting it to transients - for example of chang-
ing light intensity - which could alter the levels of
metabolites (see [43]). Disruption of cellular structure leads
to mixing of metabolites with enzymes that are normally
sequestered in a different subcellular compartment or cell,
and this degrades the metabolites rapidly. It is essential to
109.6 Genome Biology 2004, Volume 5, Issue 6, Article 109 Kopka et al. />Genome Biology 2004, 5:109
quench metabolism fast enough to prevent post-extraction
changes in metabolite levels (by freezing in liquid nitrogen,
for example, or squashing tissue between large metal blocks
precooled in liquid nitrogen). Given the chemical diversity of
metabolites, it is impossible to devise a method that allows
all of them to be quantitatively and totally extracted. The
procedures for extraction and extract handling must there-
fore be tuned to the biological question of interest - which
metabolites is it essential to measure with the highest possi-
ble precision? For example, to measure metabolites that are
susceptible to enzymatic breakdown, it is essential totally to
inhibit all enzyme activity (see [43]). This requires treat-
ments (such as extraction in trichloroacetic acid) that will
degrade or derivatize other metabolites.
Extraction and analysis should be optimized and routinely
checked for specific metabolites of interest, by spiking tissue
samples with small amounts of authenticated chemical stan-
dards just prior to extraction [12]. Such ‘recovery’ experi-
ments should be repeated with each new tissue, or with each
treatment that strongly affects the spectra of enzymes or
metabolites (for example, fruit ripening or pathogen attack).
This becomes impractical when hundreds or thousands of
metabolites are being analyzed. In such cases, a generic
strategy is required for quality control. The simplest is to
mix the tissues 1:1 with a standard tissue, for which the pro-
cedures have already been validated, and to check for each
individual analyte that the level in the mixture is the arith-
metical mean of the level in the individual tissues. This
approach was used, for example, in the adaptation of GC-MS
protocols for the measurement of tomato fruits [47]. A
bonus is that it provides additional information on reten-
tion-time shifts between the standard and novel tissues, and
that it rapidly identifies differences in the dynamic range of
metabolite levels between the tissues.
Software, and making sense of lots of data
Because metabolite profiling is cheap once the hardware
platforms have been established, it can be applied to a large
number of samples to generate huge amounts of data. The
next bottleneck is in finding ways to combine and interpret
the data. A first, apparently trivial, step is to develop a
clearly defined syntax for all the metabolites being mea-
sured. This is analogous to the establishment of a complete
list of all the genes in an organism, but is more complex
because there is no genome sequence that can act as a point
of reference, and because of the large numbers of synonyms
and baffling length of many chemical names. The first steps
towards this goal are being taken, but it is an arduous
journey and requires a combination of expert knowledge of
metabolites and of text-mining algorithms.
Databases of metabolite profiles contain a large number of
experimental data points for each parameter, and are well
suited for data mining. Analysis with statistical tools to
detect correlations and clusters drives unbiased knowledge
acquisition, by identifying unknown relationships. Analysis
via principal component analysis, individual component
analysis or machine-learning approaches can be used to
uncover important patterns or differences in metabolite
levels [4,12]. This will generate leads for further experimen-
tation and define ‘diagnostic’ metabolites that can then be
selectively measured in very high-throughput ways.
Metabolism is notoriously incomprehensible to the non-spe-
cialist. In parallel with informatics-driven approaches, tools
are needed that place metabolite-profiling data in a biologi-
cal context. Metabolic databases (such as KEGG [48])
provide exhaustive information about the possible roles of a
given metabolite, based on information compiled from
numerous prokaryotes and eukaryotes. They are useful for
reference, but daunting for non-specialists. In such data-
bases, pathways are defined as large networks, the informa-
tion is inclusive rather than specific, and it is often unclear
which pathways or sections of them operate in which organ-
ism. Recently a first build of the AraCyc resource was pub-
lished [49,50]. This database will cumulatively assemble
information about different plant metabolic pathways, pro-
viding diagrams that show the metabolites and the genes
that encode the enzymes in each pathway. The next step is to
develop tools to display metabolite data onto diagrams of
pathways. This has been approached by Thimm et al. [51,52]
with a tool called MapMan that allows users to paint
metabolite-profiling datasets out onto existing templates, or
onto diagrams they design themselves. MapMan also places
metabolite data in a wider context, in combination with
expression-profiling datasets and, potentially, with informa-
tion about proteins and enzyme activities.
Back to biology
Measurements of metabolites provide basic information
about biological responses to physiological or environmental
changes. Metabolite profiling allows a shift from hypothesis-
driven research to the analysis of system-wide responses,
especially when it is integrated with other profiling technolo-
gies (see, for example, [53,54]). After characterizing the
response, the next task is to elucidate the regulatory mecha-
nisms. Systematic investigation of all of the metabolites
within a part, or segment, of a metabolic network provides a
powerful and unbiased strategy for identifying the site or
sites at which key mechanisms act to alter fluxes. The regu-
lated enzyme is revealed because the level of its substrate(s)
changes reciprocally to the flux through the pathway (see,
for example, [55]). Metabolite-profiling datasets can also be
chemometrically analyzed to uncover correlations between
individual metabolites and the expression levels of specific
genes [53] or proteins [54]. In the post-genomic era,
metabolite profiling will be increasingly used to phenotype
mutants and transgenic organisms, so as to define the role of
a gene. One of the major challenges in functional genomics is
comment
reviews
reports
deposited research
interactions
information
refereed research
Genome Biology 2004, Volume 5, Issue 6, Article 109 Kopka et al. 109.7
Genome Biology 2004, 5:109
to assign functions to the many poorly or unannotated genes
[56]; metabolite profiling will provide a key for those that
encode proteins involved in metabolism.
In plant breeding, questions related to molecular composi-
tion and its implications for nutrition and health are moving
to the fore. Advances in technology are speeding up the
introduction of new diversity into breeding programs, either
via transgenic technology or by using molecular markers in
combination with wide crosses. Metabolite profiling can be
used to characterize this diversity phenotypically with
respect to its metabolite composition, providing a powerful
resource to guide breeding programs and to alert researchers
at an early stage to positive or detrimental traits. The power
of this approach will be vastly increased if it can be com-
bined with a systematic survey of the metabolite composi-
tion of the plant produce that is already on the market. As
well as providing a baseline, this will also provide a rational
framework for risk assessment via ‘substantial equivalence’:
metabolite profiling will be used to determine the metabolite
composition of novel products, which can be compared with
the range of metabolites in produce already available. Fur-
thermore, metabolic profiling will provide important input
into nutritional research, and into the public debate about
the acceptability of changes in food-production chains.
One of the major challenges for the life sciences in the coming
decades is to move beyond detailed knowledge about organ-
isms and their responses in the laboratory or controlled envi-
ronments to understand complex interactions in natural
ecosystems and during evolution. The combination of high
throughput and breadth will allow metabolite profiling to be
integrated with ecological studies, which require large sam-
pling strategies but have often suffered from the limitations
of preconception-driven research. Metabolite profiling can
also be used to assess genotypic variation, without requiring
the prior development of molecular tools for a particular
species [4,57]. We can expect metabolite profiling to become
a key tool in a variety of fields in the years to come.
References
1. Weckwerth W: Metabolomics in systems biology. Annu Rev
Plant Biol 2003, 54:669-689.
2. Chace DH: Mass spectrometry in the clinical laboratory. Chem
Rev 2001, 101:445-477.
3. Trethewey RN, Krotzky, AJ, Willmitzer L: Metabolic profiling: A
rosetta stone for genomics? Curr Opin Plant Biol 1999, 2:83-85.
4. Fiehn O, Kopka J, Dörmann P, Altmann T, Trethewey RN,
Willmitzer L: Metabolite profiling for plant functional
genomics. Nat Biotechnol 2000, 18:1157-1161.
5. Sumner LW, Mendes P, Dixon RA: Plant metabolomics: large
scale phytochemistry in the functional genomics era. Phyto-
chemistry 2003, 62:817-836.
6. Birkemeyer C, Kolasa A, Kopka J: Comprehensive chemical
derivatization for gas chromatography-mass spectrometry-
based multi-targeted profiling of the major phytohormones.
J Chromatogr A 2003, 993:89-102.
7. Mueller A, Duechting P, Weiler EW: A multiplex GC-MS/MS
technique for the sensitive and quantitative single-run
analysis of acidic phytohormones and related compounds,
and its application to Arabidopsis thaliana. Planta 2002, 216:44-
56.
8. Knapp DR: Handbook of Analytical Derivatization Reactions. New York:
John Wiley & Sons: 1979.
9. Wagner C, Sefkow M, Kopka J: Construction and application of
a mass spectral and retention time index database gener-
ated from plant GC/EI-TOF-MS metabolite profiles. Phyto-
chemistry 2003, 62:887-900.
10. van Deursen MM, Beens J, Janssen H-G, Leclercq PA, Cramers CA:
Evaluation of time-of-flight mass spectrometric detection
for fast gas chromatography. J Chromatogr A 2000, 878:205-213.
11. Roessner U, Luedemann A, Brust D, Fiehn O, Linke T, Willmitzer L,
Fernie AR: Metabolic profiling allows comprehensive pheno-
typing of genetically or environmentally modified plant
systems. Plant Cell 2001, 13:11-29.
12. Roessner U, Wagner C, Kopka J, Trethewey RN, Willmitzer L:
Technnical advance: simultaneous analysis of metabolites in
potato tuber by gas chromatography-mass spectrometry.
Plant J 2000, 23:131-142.
13. Dole M, Mack LL, Hines RL: Molecular beams of macroions.
J Chem Phys 1968, 49:2240-2249.
14. Yamashita M, Fenn JB: Electrospray ion-source - another varia-
tion on the free-jet theme. J Phys Chem 1984, 88:4451-4459.
15. Zabrouskov V, Giacomelli L, van Wijk KJ, McLafferty FW: A new
approach for plant proteomics - characterization of chloro-
plast proteins of Arabidopsis thaliana by top-down mass
spectrometry. Mol Cell Proteomics 2003, 2:1253-1260.
16. Karst U: Detection techniques for liquid chromatography.
Anal Bioanal Chem 2002, 372:27-28.
17. Jennings KR: The changing impact of the collision-induced
decomposition of ions on mass spectrometry. Int J Mass Spec-
trom 2000, 200:479-493.
18. Stafford G: Ion trap mass spectrometry: a personal perspec-
tive. J Am Soc Mass Spectrom 2002, 13:589-596.
19. Niessen WMA: State-of-the-art in liquid chromatography-
mass spectrometry. J Chromatogr A 1999, 856:179-197.
20. Hughey CA, Rodgers RP, Marshall AG: Resolution of 11,000 com-
positionally distinct components in a single electrospray
ionization Fourier transform ion cyclotron resonance mass
spectrum of crude oil. Anal Chem 2002, 74:4145-4149.
21. Tanaka N, Kobayashi H: Monolithic columns for liquid chro-
matography. Anal Bioanal Chem 2003, 376:298-301.
22. Tolstikov V V, Lommen A, Nakanishi K, Tanaka N, Fiehn O:
Monolithic silica-based capillary reversed-phase liquid chro-
matography/electrospray mass spectrometry for plant
metabolomics. Anal Chem 2003, 75:6737-6740.
23. Stein SE: An integrated method for spectrum extraction and
compound identification from gas chromatography/mass
spectrometry data. J Am Soc Mass Spectrom 1999, 10:770-781.
24. Tong CS, Cheng KC: Mass spectral search method using the
neural network approach. Chemometrics Intell Lab Syst 1999,
49:135-150.
25. Tolstikov V V, Fiehn O: Analysis of highly polar compounds of
plant origin: combination of hydrophilic interaction chro-
matography and electrospray ion trap mass spectrometry.
Anal Biochem 2002, 301:298-307.
26. Hall R, Beale M, Fiehn O, Hardy N, Sumner L, Bino R: Plant
metabolomics: the missing link between genotype and phe-
notype. Plant Cell 2002, 14:1437-1440.
27. Ratcliffe RG, Shacher-Hill Y: Probing plant metabolism with
NMR. Annu Rev Plant Physiol Plant Mol Biol 2001, 52:499-526
28. Bligny R, Douce R: NMR and plant metabolism. Curr Opin Plant
Biol 2001, 4:191-196.
29. Noteborn HPJM, Lommen A, van der Jagt RC, Wewsemna JM:
Chemical fingerprinting for the evaluation of unintended
secondary metabolic changes in transgenic food crops.
J Biotechnol 2000, 77:103-114.
30. Fan TWM, Higashi RM, Lane AN: Monitoring of hypoxic metab-
olism in superfused plant tissue by in vivo H-1-NMR. Arch
Biochem Biophys 1986, 251:674-687.
31. Gout E, Bligny R, Pascal N, Douce R: C-13 nuclear-magnetic reso-
nance studies of malate and citrate synthesis and compart-
mentation in higher plant cells. J Biol Chem 1993, 268:3986-3992.
32. Sessa RA, Bennett MH, Lewis MJ, Mansfield JW, Beale MH: Metabolite
profiling of sesquiterpene lactones from Lactura species. Major
latex components are novel oxalate and sulfate conjugates of
lactucin and its derivatives. J Biol Chem 2000, 275:26877-26884.
109.8 Genome Biology 2004, Volume 5, Issue 6, Article 109 Kopka et al. />Genome Biology 2004, 5:109
33. Hanson AD, Roje S: One-carbon metabolism in higher plants.
Annu Rev Plant Physiol Plant Mol Biol 2001, 52:119-137.
34. Hole SJW, Howe PWA, Stanley PD, Hadfield ST: Pattern recogni-
tion analysis of endogenous cell metabolites for high
throughput mode of action identification: removing the
postscreening dilemma associated with whole-organism
high throughput screening. J Biomol Screen 2000, 5:335-342.
35. Fernie AR: Metabolome characterization in plant system
analysis. Funct Plant Biol 2003, 30:111-120.
36. Bergmeyer HU (Ed): Methods of Enzymatic Analysis. VCH; Weinheim,
Germany: 1987.
37. Gibon Y, Vigeolas H, Tiessen A, Geigenberger P, Stitt M: Sensitive
and high throughput metabolite assays for inorganic
pyrophosphate, ADPGlc, nucleotide phosphates, and gly-
colytic intermediates based on a novel enzymic cycling
system. Plant J 2002, 30:221-235.
38. Van Schaftingen E:
D-fructose 2,6-bisphosphate. In: Bergmeyer
HU (Ed). Methods of Enzymatic Analysis, 4th edition, volume 6. Wein-
heim: VCH: 335-341.
39. Blázquez MA,Gancedo JM, Gancedo C: Use of Yarrowia lipolytica
hexokinase for the quantitative determination of trehalose
6-phosphate. FEMS Microbiol Lett 1994, 121:223-227.
40. Häusler RE, Fischer KL, Flügge UI: Determination of low-abun-
dant metabolites in plant extracts by NAD(P)H fluores-
cence with a microtiter plate reader. Anal Biochem 2000,
281:1-8.
41. McElroy KE, Bouchard PJ, Harpel MR, Horiuchi KY, Rogers KC,
Murphy DJ, Chung TDY, Copeland RA: Implementation of a con-
tinuous, enzyme-coupled fluorescence assay for high-
throughput analysis of glutamate-producing enzymes. Anal
Biochem 2000, 284:382-387.
42. Deshpande SS: Principles and applications of luminescence
spectroscopy. Crit Rev Food Sci Nutr 2001, 41:155-224.
43. Stitt M, Fernie AR: From measurements of metabolites to
metabolomics: an ‘on the fly’ perspective illustrated by
recent studies of carbon-nitrogen interactions. Curr Opin
Biotechnol 2003, 14:136-144.
44. Sundberg SA: High throughput and ultra-high throughput
screening: solution- and cell-based approaches. Curr Opin
Biotechnol 2000, 11:47-53.
45. Hadd AG, Raymond DE, Halliwell JW, Jacobson SC, Ramsey JM:
Microchip device for performing enzyme assays. Anal Chem
1997, 69:3407-3412.
46. Hong JW, Quake SR: Integrated nanoliter systems. Nat Biotech-
nol 2003, 21:1179-1183.
47. Roessner-Tunali U, Hegemann B, Lytovchenko A, Carrari F,
Bruedigam C, Granot D, Fernie AR: Metabolic profiling of trans-
genic tomato plants overexpressing hexokinase reveals that
the influence of hexose phosphorylation diminishes during
fruit development. Plant Physiol 2003, 133:84-99.
48. KEGG [ />49. Mueller LA, Zhang PF, Rhee SY: AraCyc: a biochemical pathway
database for Arabidopsis. Plant Physiol 2003, 132:453-460.
50. AraCyc [ />51. Thimm O, Bläsing O, Gibon Y, Nagel A, Meyer S, Krüger P, Selbig J,
Müller LA, Rhee SY, Stitt M: MapMan: A user-driven tool to
display genomics data sets onto diagrams of metabolic
pathways and other biological processes. Plant J 2004, 37:914-
939.
52. MapMan [ />53. Urbanczyk-Wochniak E, Luedemann A, Kopka J, Selbig J, Roessner-
Tunali U, Willmitzer L, Fernie AR: Parallel analysis of transcript
and metabolic profiles: a new approach in systems biology.
EMBO Rep 2003, 4:989-993.
54. Weckwerth W, Wenzel K, Fiehn O: Process for the integrated
extraction, identification and quantification of metabolites,
proteins and RNA to reveal their co-regulation in biochemi-
cal networks. Proteomics 2004, 4:78-83.
55. Tiessen A, Hendriks JHM, Stitt M, Brausheid A, Gibon Y, Farre EM,
Geigenberger P: Starch synthesis in potato tubers is regulated
by post-translational redox modification of ADPglucose
pyrophosphorylase: a novel regulatory mechanism linking
starch synthesis to the sucrose supply. Plant Cell 2002, 14:2191-
2213.
56. Trethewey RN: Gene discovery via metabolite profiling. Curr
Opin Biotechnol 2001, 12:135-138.
57. Roessner U, Willmitzer L, Fernie AR: Metabolic profiling and
biochemical phenotyping of plant systems. Plant Cell Rep 2001,
21:189-196.
comment
reviews
reports
deposited research
interactions
information
refereed research
Genome Biology 2004, Volume 5, Issue 6, Article 109 Kopka et al. 109.9
Genome Biology 2004, 5:109